This article shows how to make a graph showing a Linux machine’s CPU Usage.
The Linux machine is using collectd to gather the load average and send it to the time series back-end – InfluxDB. Grafana is used to visualize the data stored in the time series back-end InfluxDB and organize the graphs in panels and dashboards. Check out the previous articles on the subject to install and configure such software to collect, store and visualize data – Monitor and analyze with Grafana, influxdb 1.8 and collectd under CentOS Stream 9 and Monitor and analyze with Grafana, influxdb 1.8 and collectd under Ubuntu 22.04 LTS.
The collectd daemon is used to gather data on the Linux system and to send it to the back-end InfluxDB.
Key knowledge for the cpu collectd plugin
- The collectd plugin CPU official page – https://collectd.org/wiki/index.php/Plugin:CPU
- The CPU plugin options – https://collectd.org/documentation/manpages/collectd.conf.5.shtml#plugin_cpu
- to enable the CPU plugin, load the plugin with the load directive in /etc/collectd.conf
LoadPlugin cpu
- The CPU plugin collects data every 10 seconds.
- cpu_value – 1 derive value is saved in the database. All values are in jiffies – the kernel unit of time. Showing just jiffers is not practical, that’s why all CPU graphs convert jiffers to CPU percentage usage.
tag key tag value description host server hostname The name of the source this measurement was recorded. instance execution units number The execution unit this measurement was recorded. For example, systems with 8 cores will have 8 different execution units, so instances from 0 to 7. A graph representing the usage of a single CPU core is possible. type cpu The only type available is cpu. type_instance CPU usage metrics CPU metrics – idle, interrupt, nice, softirq, steal, system, user, wait. - DERIVE value – a metric, in which the change of the value is interesting. For example, it can go up indefinitely and it is important how fast it goes up, there are functions and queries, which will give the user the derivative value.
These data sources assume that the change of the value is interesting, i.e. the derivative. Such data sources are very common with events that can be counted, for example, the number of emails that have been received per second by an MTA since it was started. The total number of emails is not interesting.
- To cross check the value, the user can use the /proc/stat
[root@srv ~]# cat /proc/stat
cpu  939 0 988 51486 200 261 56 0 0 0
cpu0 483 0 473 25796 89 114 25 0 0 0
cpu1 455 0 514 25690 110 147 31 0 0 0
intr 123072 118 9 0 0 0 0 0 0 1 6 0 0 156 0 409 409 0 0 1184 501 0 0 0 0 0 0 6823 0 0 0 0 0 0 0 0 0 0 0 0 0 0 0 0 0 0 0 0 0 0 0 0 0 0 0 0 0 0 0 0 0 0 0 0 0 0 0 0 0 0 0 0 0 0 0 0 0 0 0 0 0 0 0 0 0 0 0 0 0 0 0 0 0 0 0 0 0 0 0 0 0 0 0 0 0 0 0 0 0 0 0 0 0 0 0 0 0 0 0 0 0 0 0 0 0 0 0 0 0 0 0 0 0 0 0 0 0 0 0 0 0 0 0 0 0 0 0 0 0 0 0 0 0 0 0 0 0 0 0 0 0 0 0 0 0 0 0 0 0 0 0 0 0 0 0 0 0 0 0 0 0 0 0 0 0 0 0 0 0 0 0 0 0 0 0 0 0 0 0 0 0 0 0 0 0 0 0 0 0 0 0 0 0 0 0 0 0 0 0 0 0 0 0 0 0 0 0 0 0 0 0 0 0 0 0 0 0 0 0 0 0 0 0 0 0 0 0 0 0 0 0 0 0 0 0 0 0 0 0 0 0 0 0 0 0 0 0 0 0 0 0 0 0 0 0 0 0 0 0 0 0 0 0 0 0 0 0 0 0 0 0 0 0 0 0 0 0 0 0 0 0 0 0 0 0 0 0 0 0 0 0 0 0 0 0 0 0 0 0 0 0 0 0 0 0 0 0 0 0 0 0 0 0 0 0 0 0 0 0 0 0 0 0 0 0 0 0 0 0 0 0 0 0 0 0 0 0 0 0 0 0 0 0 0 0 0 0 0 0 0 0 0 0 0 0 0 0 0 0 0 0 0 0 0 0 0 0 0 0 0 0 0 0 0 0 0 0 0 0 0 0 0 0 0 0 0 0 0 0 0 0 0 0 0 0 0 0 0 0 0 0 0 0 0 0 0 0 0 0 0 0 0 0 0 0 0 0 0 0 0 0
ctxt 279137
btime 1666874114
processes 1373
procs_running 1
procs_blocked 0
softirq 64069 2 13685 7 544 6967 0 77 15801 0 26986
The InfluxQL queries for the Linux CPU usage
The queries are Grafana generated.
SELECT non_negative_derivative(mean("value"), 1s) FROM "cpu_value" WHERE ("host" = 'srv' AND "type" = 'cpu') AND time >= now() - 6h and time <= now() GROUP BY time(15s), "type_instance" fill(null);
The mean function will compute the mean if there is more than one value in the database for every 15 minutes (this is the “group by” logic here). Probably the most accurate query might be to use the last() function instead of mean() and to group by time(1s). As mentioned above, the collectd interval is 10 seconds. The function non_negative_derivative is needed to compute the difference between the values.
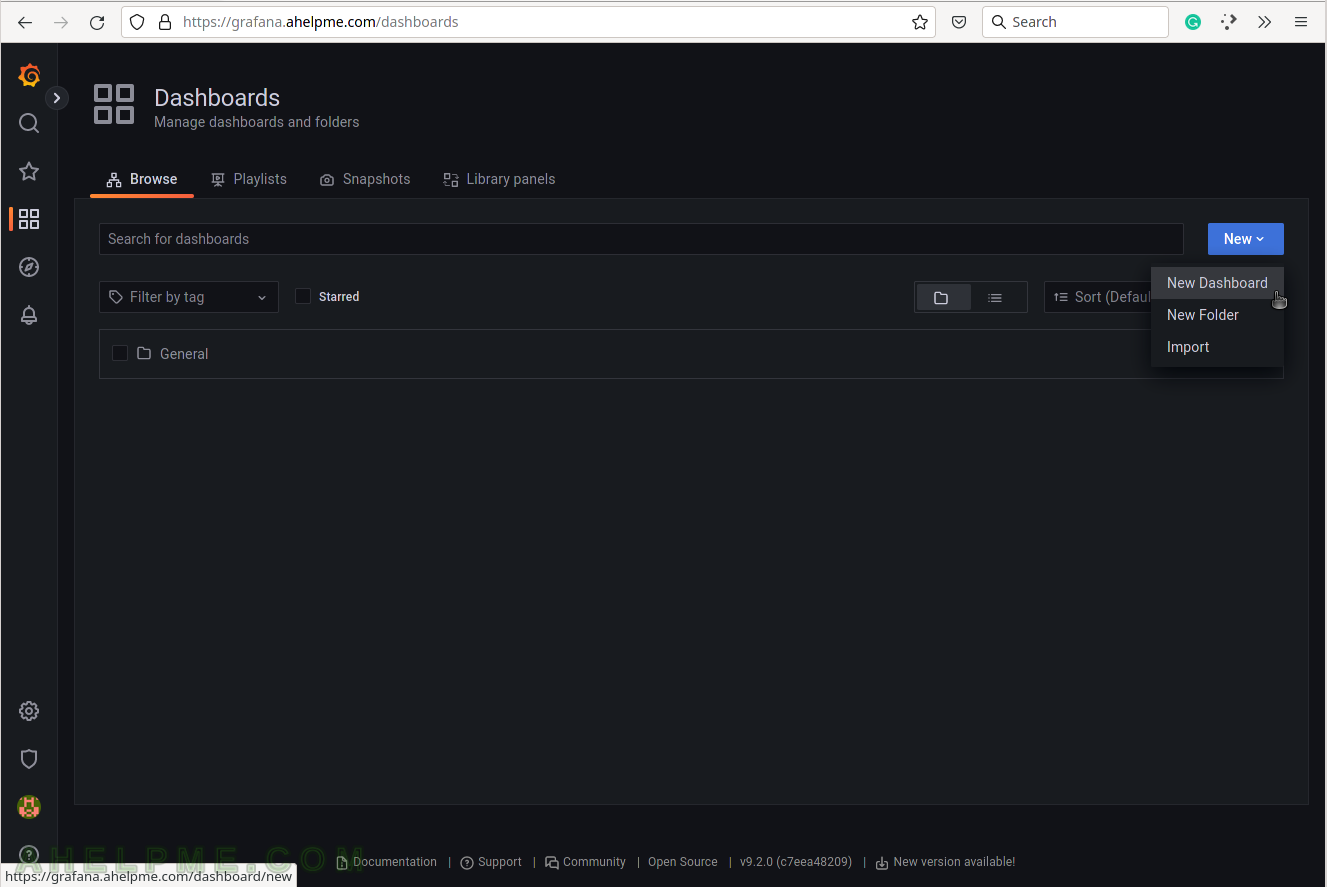
SCREENSHOT 1) Create a new dashboard, which will contain the CPU usage graph.
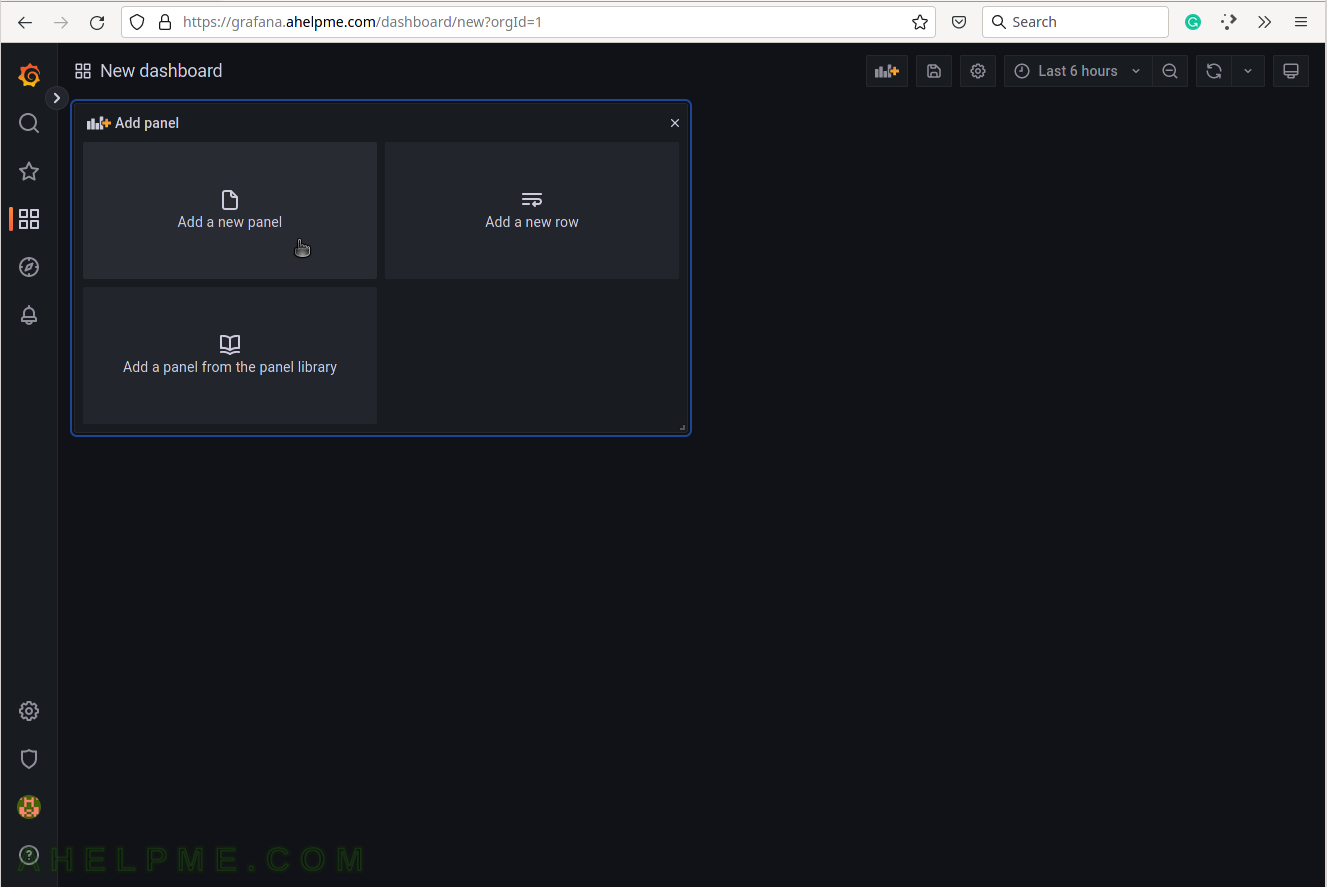
SCREENSHOT 2) Add a new panel in the new dashboard, which will contain the CPU usage graph.
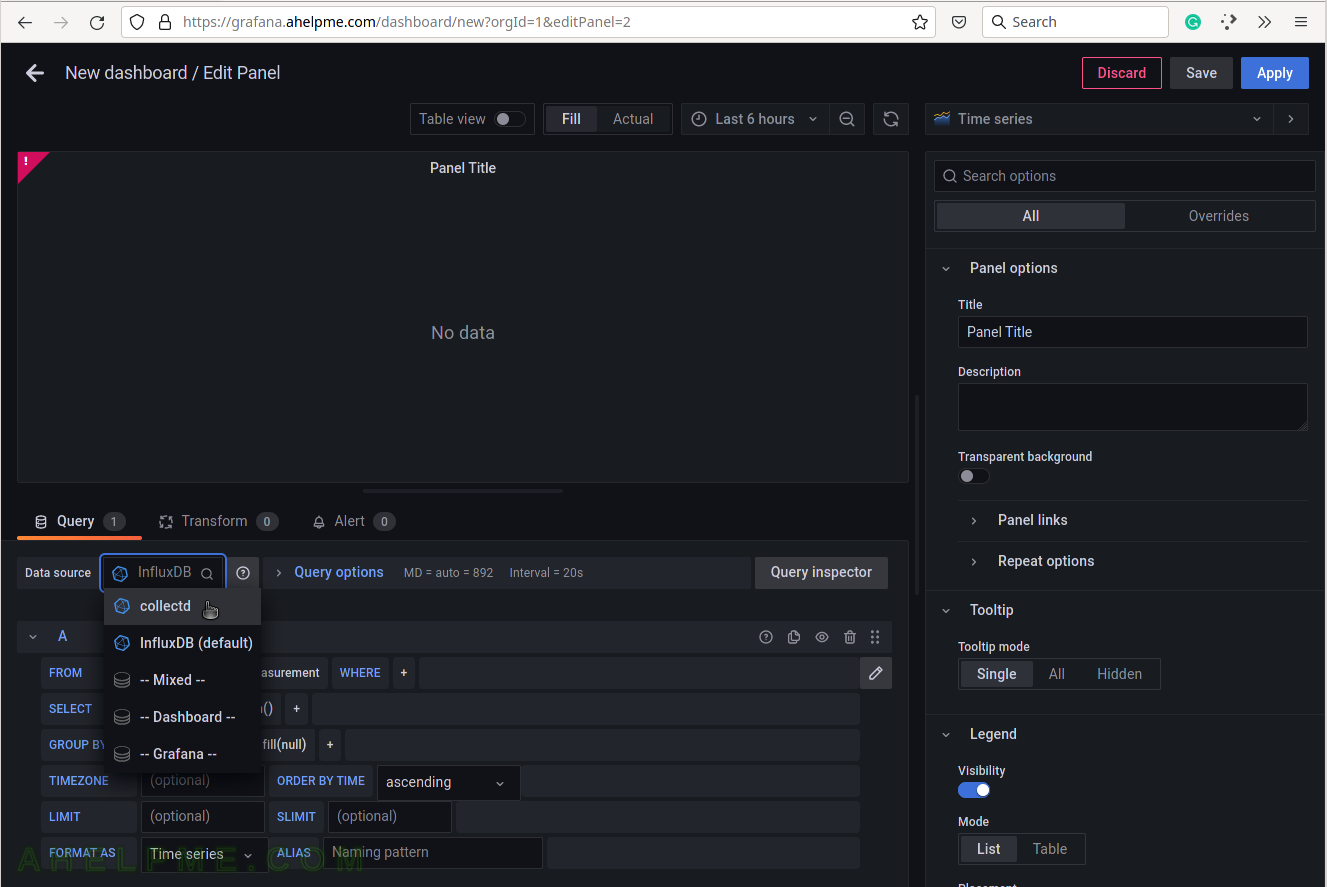
SCREENSHOT 3) Change the “Data Source” to the collectd (InfluxDB) database and ensure on the right top the graph type is “Time series”.
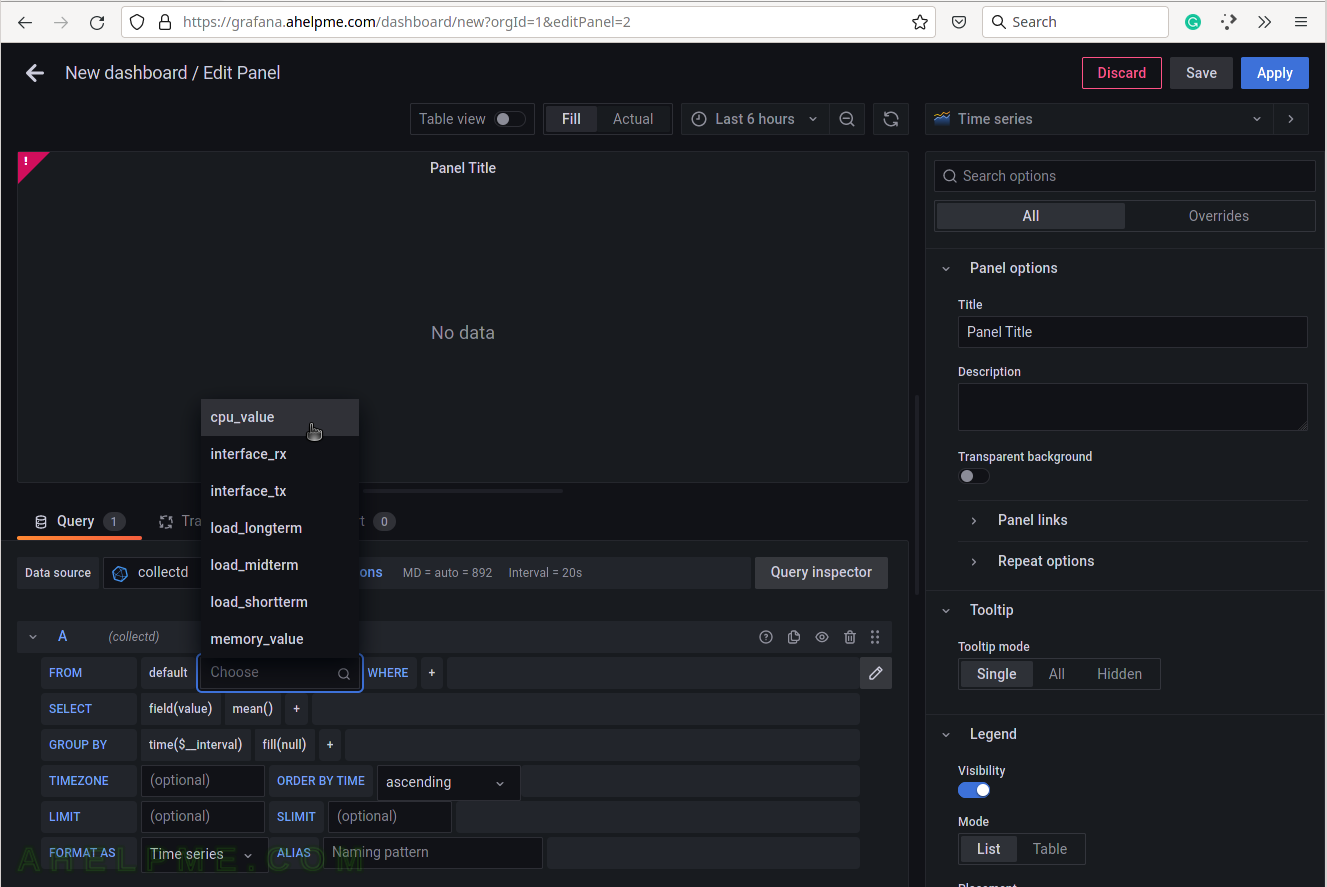
SCREENSHOT 4) Choose the cpu_value from the measurement drop-down list.
There are all measurements in the drop-down list in the database collectd.
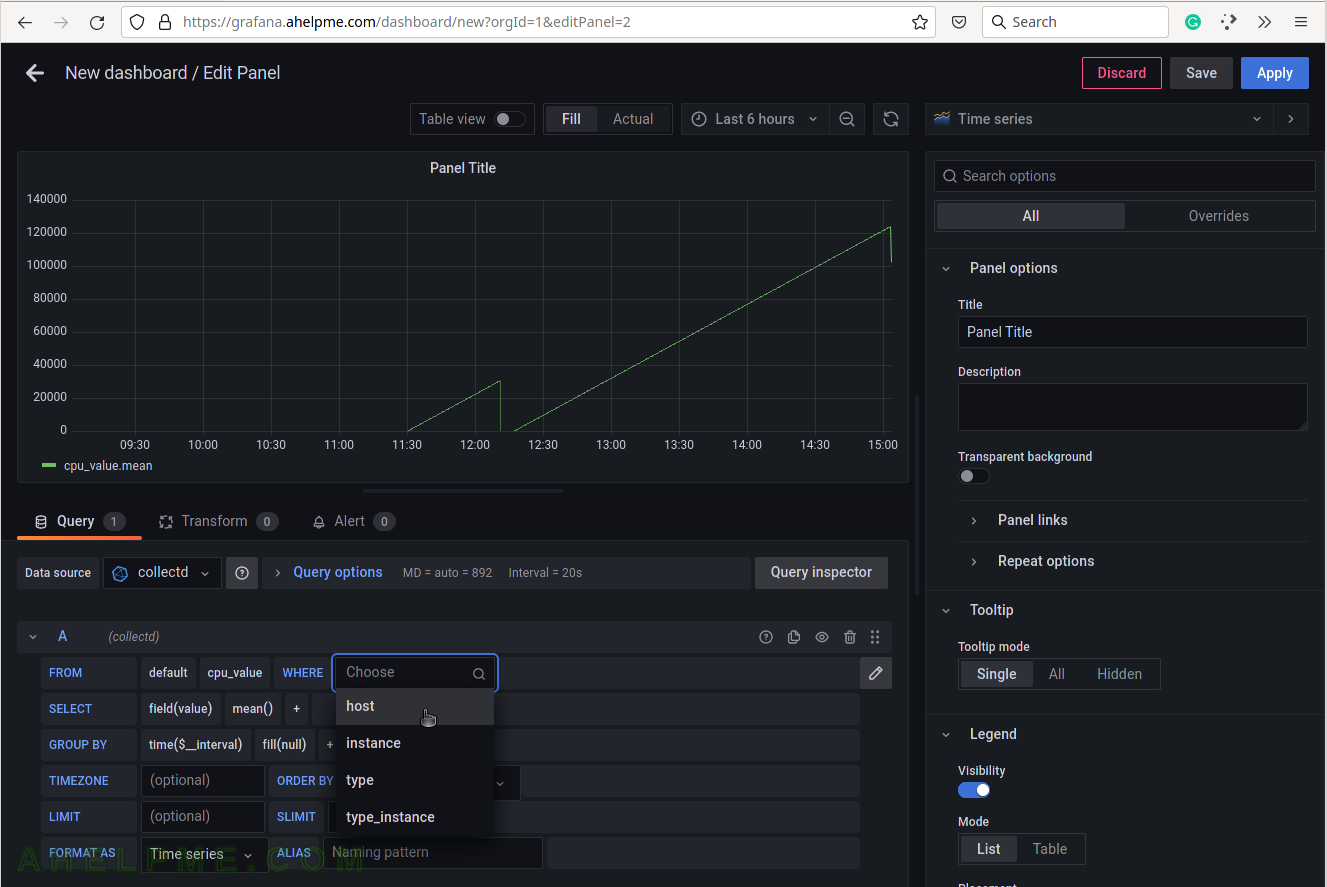
SCREENSHOT 5) Select the tag name “host” to limit the query for a selected hostname.
A tag is a key-value pair, which represents the metadata of a measurement record. For example, a measurement record consists of the actual measurement value and some metadata for it such as which did the measurement and where. The server hostname “srv” is the tag value and the tag key is the “host” name of the tag.
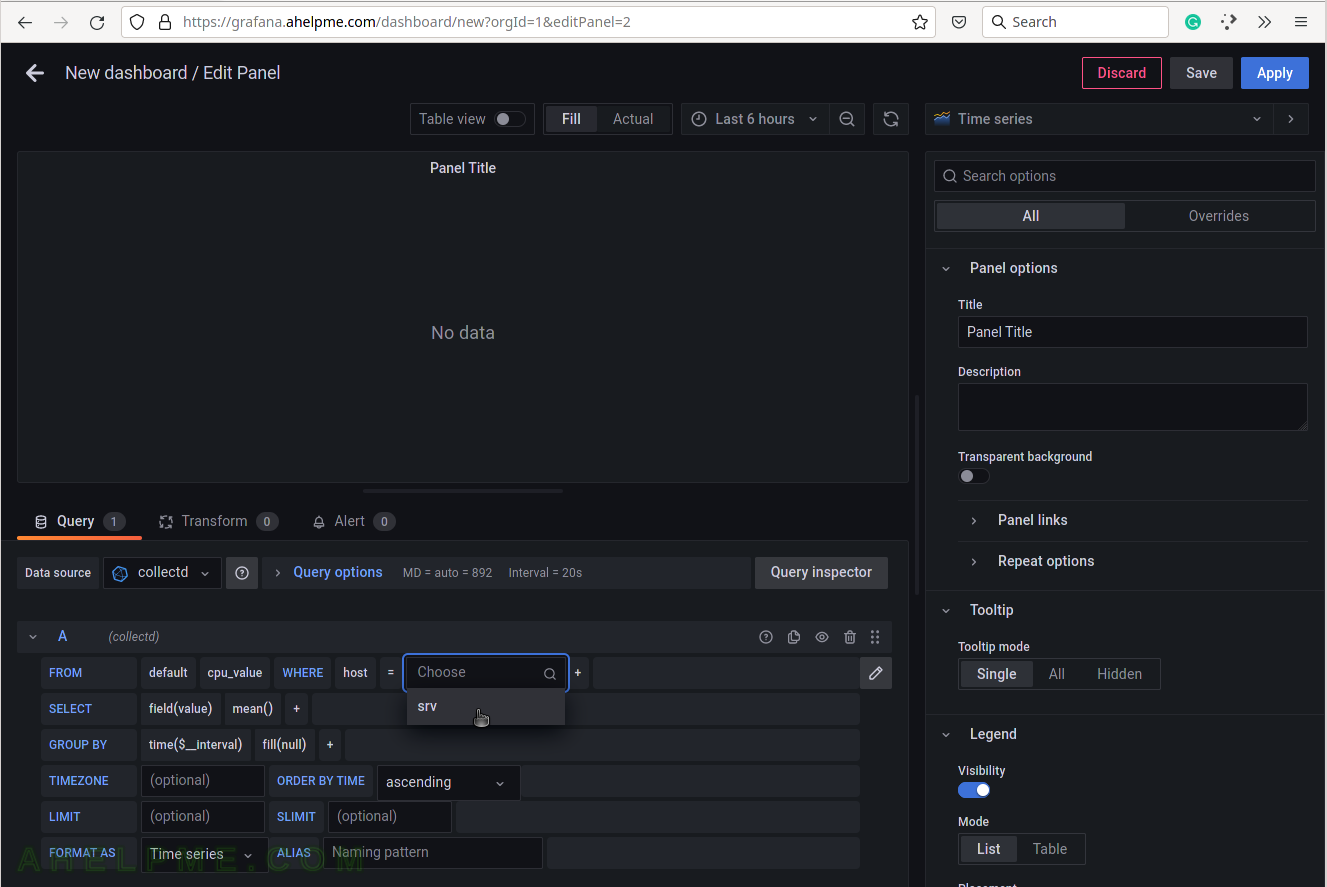
SCREENSHOT 6) Select the tag value “srv”.
This setup has only one server, so no other servers’ hostnames are shown.
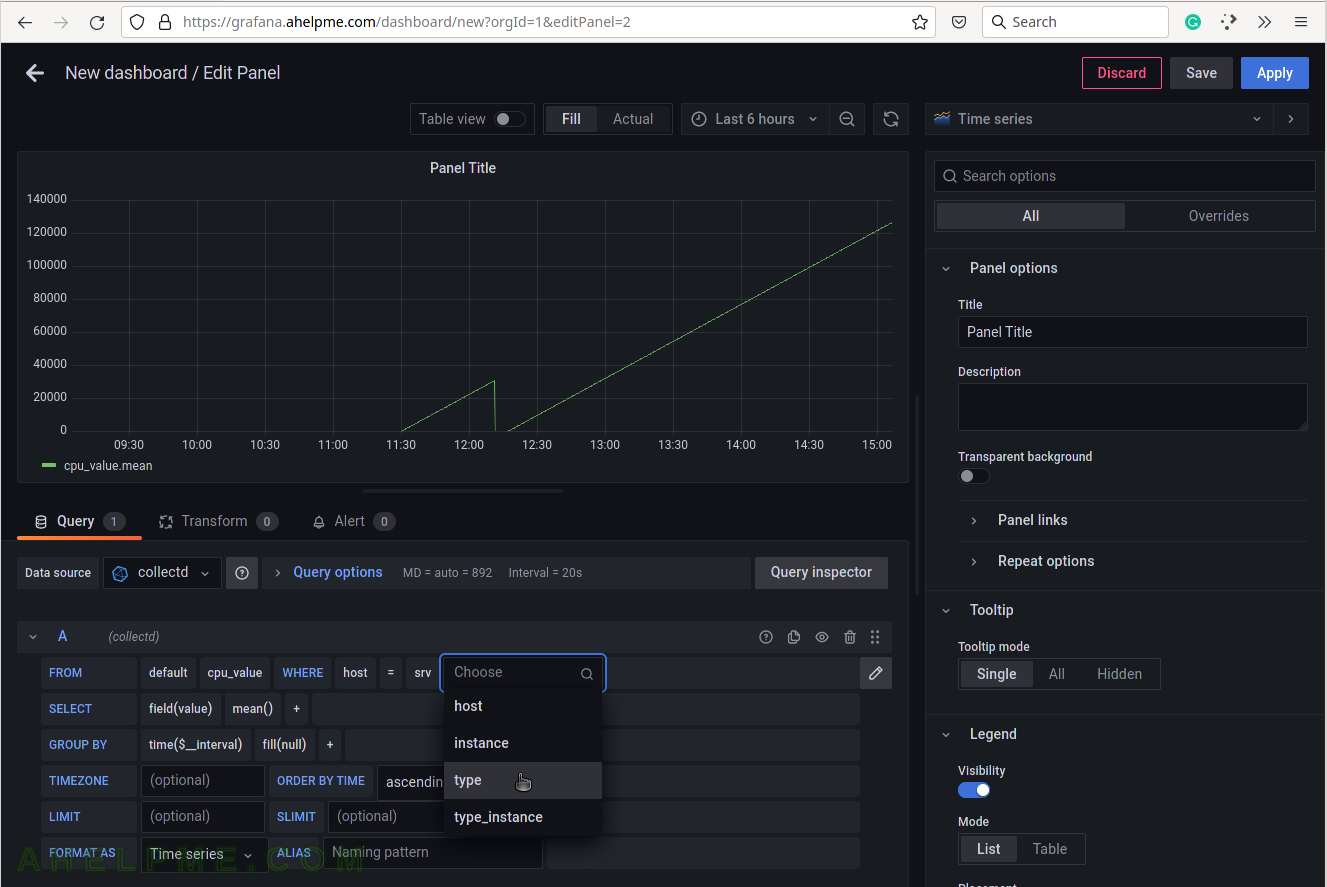
SCREENSHOT 7) Select the type of measurement.
Yet another measurement metadata.
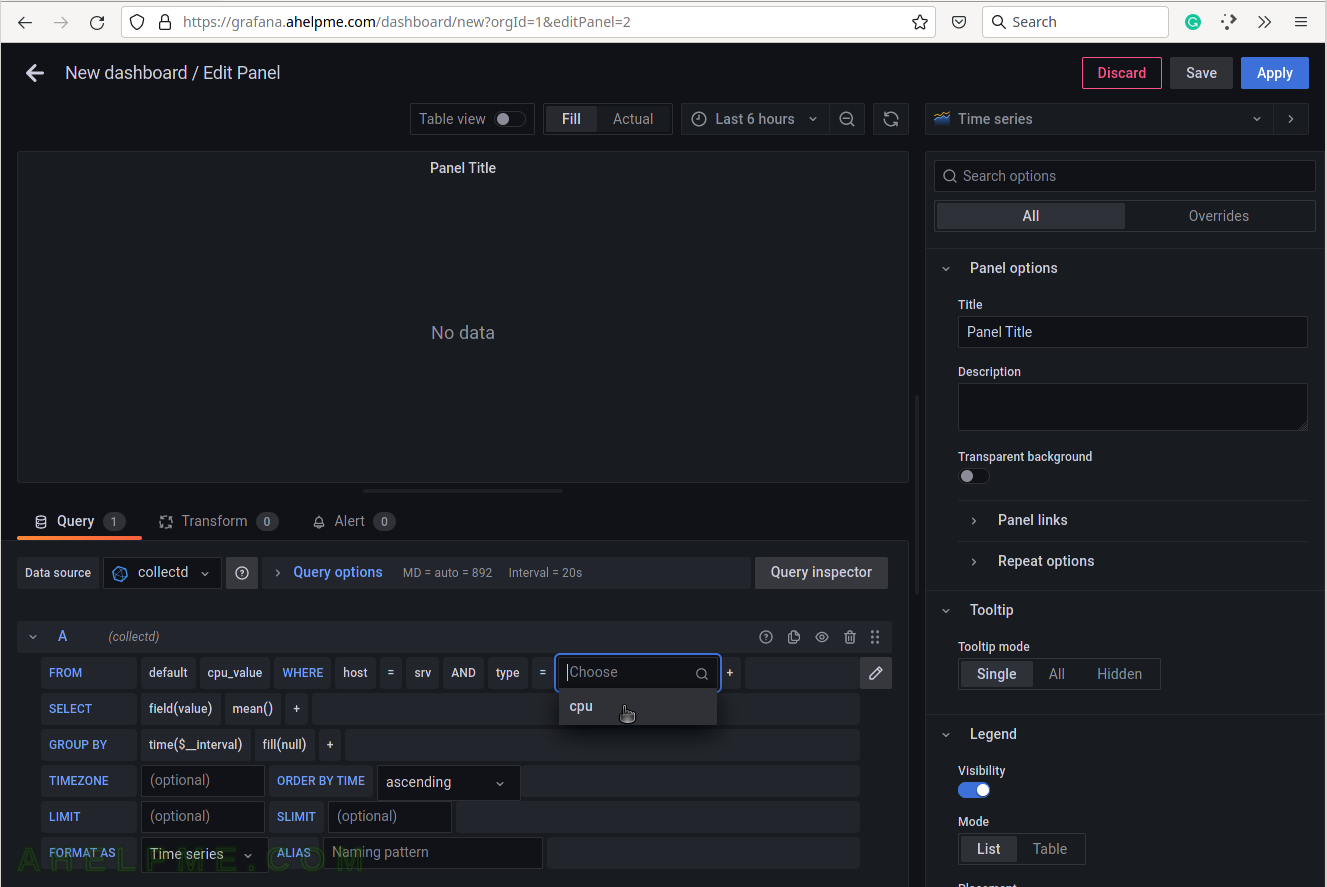
SCREENSHOT 8) Select cpu for the tag value.
There is only one value and it is the string “CPU”.
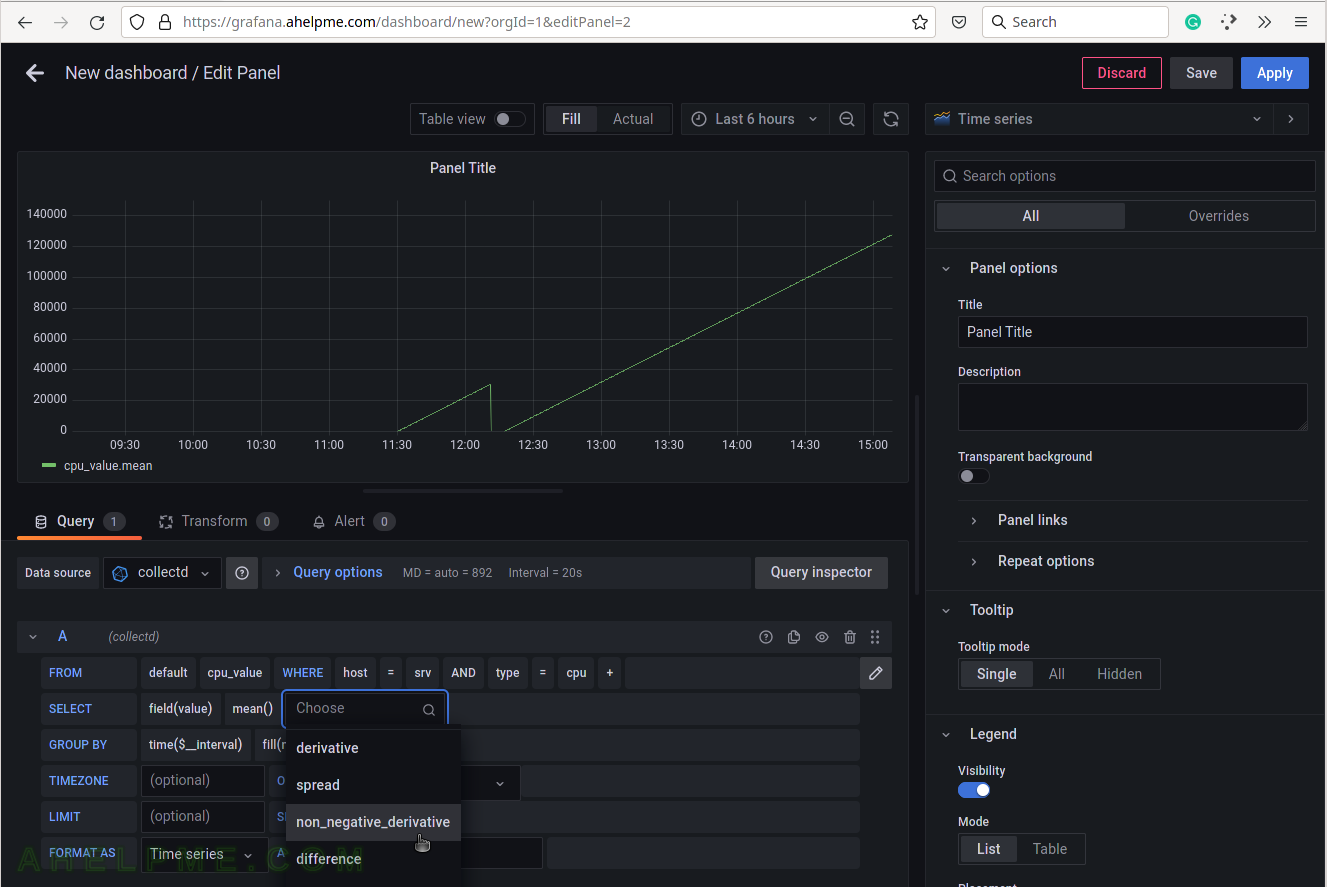
SCREENSHOT 9) Add the function, which will compute the meaningful value.
As explained above, the CPU measurement is a “derive” value and it should be transformed into something of value to the user. Using non_negative_derivative the CPU usage will be presented in percentages from 0 to 100. For example, what percentages of the CPU have been idle for a given time?