This is an updated version of the previous version of this topic – Monitor and analyze with Grafana, influxdb 1.8 and collectd under CentOS Stream 9, but this time for Ubuntu 22.04 LTS. The article describes how to build modern analytic and monitoring solutions for system and application performance metrics. A solution, which may host all the server’s metrics and a sophisticated application, allows easy analyses of the data and powerful graphs to visualize the data.
A brief introduction to the main three software used to build the proposed solution:
- Grafana – an analytics and a web visualization tool. It supports dashboards, charts, graphs, alerts, and many more.
- influxdb – a time series database. Bleeding fast reads and writes and optimized for time.
- collectd – a data collection daemon, which obtain metrics from the host it is started and sends the metrics to the database (i.e. influxdb). It has around 170 plugins to collect metrics.
What is the task of each tool:
- collectd – gathers metrics and statistics using its plugins every 10 seconds on the host it runs and then sends the data over UDP to the influxdb using a simple text-based protocol.
- influxdb – listens on an open UDP port for data coming from multiple collectd instances installed on many different devices. In this case, a Linux server running Ubuntu 22.04 LTS.
- Grafana – an analytics and a web visualization tool. A web application, which connects to the InfluxDB and visualizes the time series metrics in graphs organized in dashboards. Graphs for CPU, memory, network, storage usage, and many more.
- nginx to enable SSL and proxy in front of the Grafana.
The whole solution uses the Ubuntu 22.04 LTS server edition distro. Installing the Ubuntu 22.04 LTS is a mandatory step to proceed further with this article – Installation of base Ubuntu server 22.04 LTS
The UDP influxdb port should be open per IP basis and web port of the web server (nginx) is up to the purpose of the solution – it can be behind a VPN or openly accessible by Internet.
STEP 1) Install additional repositories for Grafana, InfluxDB and collectd.
collectd is part of the Ubuntu official repositories. Grafana and InfluxDB maintain their official repositories. Here is how to install them.
Add the InfluxDB repository by first, importing the key of the InfluxDB repository and add the URL of the repository in /etc/apt/sources.list.
myuser@srv:~$ sudo curl -sL https://repos.influxdata.com/influxdb.key | sudo apt-key add -
Warning: apt-key is deprecated. Manage keyring files in trusted.gpg.d instead (see apt-key(8)).
OK
echo 'deb https://repos.influxdata.com/debian stable main' > /etc/apt/sources.list.d/influxdata.list
Then, repeated the same procedure with the Grafana repository:
myuser@srv:~$ sudo curl -sL https://packages.grafana.com/gpg.key | sudo apt-key add -
Warning: apt-key is deprecated. Manage keyring files in trusted.gpg.d instead (see apt-key(8)).
OK
echo 'deb https://packages.grafana.com/oss/deb stable main' > /etc/apt/sources.list.d/grafana.list
Execute apt update to include the available file packages from all repositories including the ones:
apt update
STEP 2) Install, configure and run collectd.
Unforturenately, the collectd is not included in the official Ubuntu 22.04 LTS repository yet. To install the collectd daemon two files from the next Ubuntu 22.10 or Debian 12 (bookworm/sid), from which Ubuntu 22 is based. More on the topic – How to install collectd in Ubuntu 22.04 LTS and in general under Ubuntu.
curl -LOs http://mirrors.kernel.org/ubuntu/pool/universe/c/collectd/collectd_5.12.0-11_amd64.deb
curl -LOs http://mirrors.kernel.org/ubuntu/pool/universe/c/collectd/collectd-core_5.12.0-11_amd64.deb
apt install -y ./collectd_5.12.0-11_amd64.deb ./collectd-core_5.12.0-11_amd64.deb
By default, 14 plugins are loaded (the lines start without #) in the main configuration file /etc/collectd/collectd.conf.
.....
LoadPlugin battery
LoadPlugin cpu
LoadPlugin df
LoadPlugin disk
LoadPlugin entropy
LoadPlugin interface
LoadPlugin irq
LoadPlugin load
LoadPlugin memory
LoadPlugin processes
LoadPlugin rrdtool
LoadPlugin swap
LoadPlugin users
.....
To write the gathered data by the plugins above to the database InfluxDB, just uncomment the plugin network and configure the plugin as shown below:
.....
LoadPlugin network
.....
.....
<Plugin network>
      Server "127.0.0.1" "25826"
.....
.....
</Plugin>
.....
The network plugin will write the data using UDP and the protocol supported by the InfluxDB, which will be configured to listen on port 25826.
Enable and start the collectd daemon.
root@srv:~# systemctl enable collectd
Synchronizing state of collectd.service with SysV service script with /lib/systemd/systemd-sysv-install.
Executing: /lib/systemd/systemd-sysv-install enable collectd
root@srv:~# systemctl start collectd
root@srv:~# systemctl status collectd
● collectd.service - Statistics collection and monitoring daemon
     Loaded: loaded (/lib/systemd/system/collectd.service; enabled; vendor preset: enabled)
     Active: active (running) since Thu 2022-10-20 07:51:57 UTC; 3min 11s ago
       Docs: man:collectd(1)
             man:collectd.conf(5)
             https://collectd.org
   Main PID: 2382 (collectd)
      Tasks: 12 (limit: 4560)
     Memory: 40.8M
        CPU: 729ms
     CGroup: /system.slice/collectd.service
             └─2382 /usr/sbin/collectd

Oct 20 07:51:57 srv collectd[2382]: plugin_load: plugin "irq" successfully loaded.
Oct 20 07:51:57 srv collectd[2382]: plugin_load: plugin "load" successfully loaded.
Oct 20 07:51:57 srv collectd[2382]: plugin_load: plugin "memory" successfully loaded.
Oct 20 07:51:57 srv collectd[2382]: plugin_load: plugin "processes" successfully loaded.
Oct 20 07:51:57 srv collectd[2382]: plugin_load: plugin "rrdtool" successfully loaded.
Oct 20 07:51:57 srv collectd[2382]: plugin_load: plugin "swap" successfully loaded.
Oct 20 07:51:57 srv collectd[2382]: plugin_load: plugin "users" successfully loaded.
Oct 20 07:51:57 srv collectd[2382]: Systemd detected, trying to signal readiness.
Oct 20 07:51:57 srv systemd[1]: Started Statistics collection and monitoring daemon.
Oct 20 07:51:57 srv collectd[2382]: Initialization complete, entering read-loop.
STEP 3) Install, configure and start InfluxDB.
First, install InfluxDB – the time series database back-end for this monitoring solution:
apt install -y influxdb
It will install InfluxDB 1.8. The main configuration file is /etc/influxdb/influxdb.conf.
Enable the collectd configuration by uncommenting the following lines (in /etc/influxdb/influxdb.conf), only typesdb = “/usr/share/collectd/types.db” is with modified path to the type.db file.
.....
[[collectd]]
  enabled = true
  bind-address = ":25826"
  database = "collectd"
  typesdb = "/usr/share/collectd/types.db"
.....
The InfluxDB will listen on port 25826 for UDP packets. This is the simplest setup without any security. The port 25826 should be open in the firewall per IP for each server.
Now, start the service:
root@srv:~# systemctl enable influxdb
root@srv:~# systemctl start influxdb
root@srv:~# systemctl status influxdb
● influxdb.service - InfluxDB is an open-source, distributed, time series database
     Loaded: loaded (/lib/systemd/system/influxdb.service; enabled; vendor preset: enabled)
     Active: active (running) since Thu 2022-10-20 08:21:01 UTC; 3s ago
       Docs: https://docs.influxdata.com/influxdb/
    Process: 5894 ExecStart=/usr/lib/influxdb/scripts/influxd-systemd-start.sh (code=exited, status=0/SUCCESS)
   Main PID: 5895 (influxd)
      Tasks: 10 (limit: 4560)
     Memory: 9.2M
        CPU: 275ms
     CGroup: /system.slice/influxdb.service
             └─5895 /usr/bin/influxd -config /etc/influxdb/influxdb.conf

Oct 20 08:21:00 srv influxd-systemd-start.sh[5895]: ts=2022-10-20T08:21:00.542038Z lvl=info msg="Starting ret>
Oct 20 08:21:00 srv influxd-systemd-start.sh[5895]: ts=2022-10-20T08:21:00.542136Z lvl=info msg="Starting col>
Oct 20 08:21:00 srv influxd-systemd-start.sh[5895]: ts=2022-10-20T08:21:00.542238Z lvl=info msg="Loading type>
Oct 20 08:21:00 srv influxd-systemd-start.sh[5895]: ts=2022-10-20T08:21:00.542881Z lvl=info msg="Storing stat>
Oct 20 08:21:00 srv influxd-systemd-start.sh[5895]: ts=2022-10-20T08:21:00.546262Z lvl=info msg="Listening on>
Oct 20 08:21:00 srv influxd-systemd-start.sh[5895]: ts=2022-10-20T08:21:00.546593Z lvl=info msg="Listening fo>
Oct 20 08:21:00 srv influxd-systemd-start.sh[5895]: ts=2022-10-20T08:21:00.546632Z lvl=info msg="Sending usag>
Oct 20 08:21:01 srv influxd-systemd-start.sh[5895]: [httpd] 127.0.0.1 - - [20/Oct/2022:08:21:01 +0000] "GET />
Oct 20 08:21:01 srv influxd-systemd-start.sh[5894]: InfluxDB started
Oct 20 08:21:01 srv systemd[1]: Started InfluxDB is an open-source, distributed, time series database.
root@srv:~# systemctl restart collectd
And the InfluxDB is accepting the UDP packets sent from the collectd daemon. Then the data is saved in time series tables in database name “collectd“.
Create the admin user with all privileges and then enable basic authentication, at least. By default, the authentication is disabled, so use just the CLI tool to create a new user. Add ordinary user with the name collectd to have read access to the collectd database. The collectd user will be used to access the collectd database from Grafana.
root@srv:~# influx
Connected to http://localhost:8086 version 1.8.10
InfluxDB shell version: 1.8.10
> CREATE USER admin WITH PASSWORD 'eeFiN0ieng_ahcohseig' WITH ALL PRIVILEGES
> SHOW USERS
user  admin
----  -----
admin true
> CREATE USER collectd WITH PASSWORD 'oiQuahthoh+Gu1ohwiej'
> GRANT READ ON "collectd" TO "collectd"
> SHOW USERS
user     admin
----     -----
admin    true
collectd false
>
There is one user with username admin after the CREATE statement.
Then, change the auth-enabled in section “[http]” to true and three more options to true in the InfluxDB configuration file /etc/influxdb/influxdb.conf:
.....
[http]
.....
.....
  auth-enabled = true
.....
  pprof-enabled = true
.....
  pprof-auth-enabled = true
.....
  ping-auth-enabled = true
.....
.....
And restart the InfluxDB server:
systemctl restart influxdb
STEP 4) Install and configure the web server Nginx.
The Nginx web server is used as an HTTPS proxy in front of the Grafana front-end HTTP.
apt install -y nginx
Start the Nginx web server with the default configuration. Enable the Nginx service on boot:
root@srv:~# systemctl start nginx
root@srv:~# systemctl enable nginx
Synchronizing state of nginx.service with SysV service script with /lib/systemd/systemd-sysv-install.
Executing: /lib/systemd/systemd-sysv-install enable nginx
Add HTTP and HTTPS rules to accept incoming connections to the firewall. Do not forget to add the servers’ IPs and ports, which should report to InfluxDB. On remote servers, the collectd daemon will use UDP to send data to the InfluxDB on port 25826, which should be open for them. Replace 192.168.0.100 with the real IP.
Ubuntu uses ufw – Uncomplicated Firewall. The following commands enable the firewall and add rules for SSH, HTTP, HTTPS, and one for the IP 192.168.0.100 to access the InfluxDB as an example of how to open the port per IP basis.
root@srv:~# ufw status
Status: inactive
root@srv:~# ufw default allow outgoing
Default outgoing policy changed to 'allow'
(be sure to update your rules accordingly)
root@srv:~# ufw default deny incoming
Default incoming policy changed to 'deny'
(be sure to update your rules accordingly)
root@srv:~# ufw allow ssh
Rules updated
Rules updated (v6)
root@srv:~# ufw allow http
Rules updated
Rules updated (v6)
root@srv:~# ufw allow https
Rules updated
Rules updated (v6)
root@srv:~# ufw allow from 192.168.0.100 proto udp to any port 25826
Rules updated
root@srv:~# ufw enable
Command may disrupt existing ssh connections. Proceed with operation (y|n)? y
Firewall is active and enabled on system startup
root@srv:~# ufw status
Status: active

To                         Action      From
--                         ------      ----
22/tcp                     ALLOW       Anywhere
80/tcp                     ALLOW       Anywhere
443                        ALLOW       Anywhere
25826/udp                  ALLOW       192.168.0.100
22/tcp (v6)                ALLOW       Anywhere (v6)
80/tcp (v6)                ALLOW       Anywhere (v6)
443 (v6)                   ALLOW       Anywhere (v6)
Install certbot to issue letsencrypt certificate:
apt install -y certbot
Request a new certificate:
root@srv:~# certbot certonly --webroot -w /var/www/html -d grafana.ahelpme.com
Saving debug log to /var/log/letsencrypt/letsencrypt.log
Requesting a certificate for grafana.ahelpme.com

Successfully received certificate.
Certificate is saved at: /etc/letsencrypt/live/grafana.ahelpme.com/fullchain.pem
Key is saved at:         /etc/letsencrypt/live/grafana.ahelpme.com/privkey.pem
This certificate expires on 2023-01-20.
These files will be updated when the certificate renews.
Certbot has set up a scheduled task to automatically renew this certificate in the background.

- - - - - - - - - - - - - - - - - - - - - - - - - - - - - - - - - - - - - - - -
If you like Certbot, please consider supporting our work by:
 * Donating to ISRG / Let's Encrypt:   https://letsencrypt.org/donate
 * Donating to EFF:                    https://eff.org/donate-le
- - - - - - - - - - - - - - - - - - - - - - - - - - - - - - - - - - - - - - - -
Configure the Nginx server to proxy HTTPS requests to the Grafana web port. By default, Nginx loads all files in /etc/nginx/sites-enabled/ add a file /etc/nginx/sites-enabled/grafana.ahelpme.com.conf with the following content:
      server {
              listen          443 ssl http2;

              server_name     grafana.ahelpme.com;

              ssl_certificate  /etc/letsencrypt/live/grafana.ahelpme.com/fullchain.pem;
              ssl_certificate_key /etc/letsencrypt/live/grafana.ahelpme.com/privkey.pem;

              access_log      /var/log/nginx/grafana.ahelpme.com.log;
              error_log       /var/log/nginx/grafana.ahelpme.error.log warn;

              root /usr/share/nginx/html;

              location / {
                      proxy_buffer_size   128k;
                      proxy_buffers   4 256k;
                      proxy_busy_buffers_size   256k;
                      proxy_buffering off;
                      proxy_read_timeout 600;
                      proxy_send_timeout 600;
                      proxy_store off;
                      proxy_cache off;
                      proxy_redirect off;

                      proxy_pass http://127.0.0.1:3000;
                      proxy_set_header Host $host;
                      proxy_set_header X-Real-IP $remote_addr;
                      proxy_set_header X-Forwarded-For $proxy_add_x_forwarded_for;
              }
      }
Restart the Nginx to load the new configuration:
root@srv:~# systemctl restart nginx
root@srv:~# systemctl status nginx
● nginx.service - A high performance web server and a reverse proxy server
     Loaded: loaded (/lib/systemd/system/nginx.service; enabled; vendor preset: enabled)
     Active: active (running) since Thu 2022-10-20 09:23:44 UTC; 4s ago
       Docs: man:nginx(8)
    Process: 7903 ExecStartPre=/usr/sbin/nginx -t -q -g daemon on; master_process on; (code=exited, status=0/>
    Process: 7905 ExecStart=/usr/sbin/nginx -g daemon on; master_process on; (code=exited, status=0/SUCCESS)
   Main PID: 7906 (nginx)
      Tasks: 3 (limit: 4560)
     Memory: 4.0M
        CPU: 37ms
     CGroup: /system.slice/nginx.service
             ├─7906 "nginx: master process /usr/sbin/nginx -g daemon on; master_process on;"
             ├─7907 "nginx: worker process" "" "" "" "" "" "" "" "" "" "" "" "" "" "" "" "" "" "" "" "" "" "">
             └─7908 "nginx: worker process" "" "" "" "" "" "" "" "" "" "" "" "" "" "" "" "" "" "" "" "" "" "">

Oct 20 09:23:44 srv systemd[1]: Starting A high performance web server and a reverse proxy server...
Oct 20 09:23:44 srv systemd[1]: Started A high performance web server and a reverse proxy server.
STEP 5) Install and configure Grafana.
Now, install Grafana:
apt install -y grafana
The main configuration file is /etc/grafana/grafana.ini.
root@srv:~# ls -al /etc/grafana/
total 68
drwxr-xr-x   3 root root     4096 Oct 20 09:36 .
drwxr-xr-x 108 root root     4096 Oct 20 09:25 ..
-rw-r-----   1 root grafana 49588 Oct 20 09:25 grafana.ini
-rw-r-----   1 root grafana  2376 Oct 20 09:25 ldap.toml
drwxr-xr-x   8 root grafana  4096 Oct 20 09:25 provisioning
No additional configuration is required for now except for just one option in section “[server]”, the domain uncomment it and add the domain grafana.ahelpme.com:
.....
[server]
.....
.....
domain = grafana.ahelpme.com
.....
.....
Enable the service on boot and start it:
root@srv:~# systemctl daemon-reload
root@srv:~# systemctl enable grafana-server
Synchronizing state of grafana-server.service with SysV service script with /lib/systemd/systemd-sysv-install.
Executing: /lib/systemd/systemd-sysv-install enable grafana-server
Created symlink /etc/systemd/system/multi-user.target.wants/grafana-server.service → /lib/systemd/system/grafana-server.service.
root@srv:~# systemctl start grafana-server
root@srv:~# systemctl status grafana-server
● grafana-server.service - Grafana instance
     Loaded: loaded (/lib/systemd/system/grafana-server.service; enabled; vendor preset: enabled)
     Active: active (running) since Thu 2022-10-20 09:38:19 UTC; 5s ago
       Docs: http://docs.grafana.org
   Main PID: 8275 (grafana-server)
      Tasks: 6 (limit: 4560)
     Memory: 24.3M
        CPU: 1.065s
     CGroup: /system.slice/grafana-server.service
             └─8275 /usr/sbin/grafana-server --config=/etc/grafana/grafana.ini --pidfile=/run/grafana/grafana>

Oct 20 09:38:24 srv grafana-server[8275]: logger=migrator t=2022-10-20T09:38:24.083799611Z level=info msg="Ex>
Oct 20 09:38:24 srv grafana-server[8275]: logger=migrator t=2022-10-20T09:38:24.085697384Z level=info msg="Ex>
Oct 20 09:38:24 srv grafana-server[8275]: logger=migrator t=2022-10-20T09:38:24.087940708Z level=info msg="al>
Oct 20 09:38:24 srv grafana-server[8275]: logger=migrator t=2022-10-20T09:38:24.10246604Z level=info msg="Exe>
Oct 20 09:38:24 srv grafana-server[8275]: logger=migrator t=2022-10-20T09:38:24.112730575Z level=info msg="Ex>
Oct 20 09:38:24 srv grafana-server[8275]: logger=migrator t=2022-10-20T09:38:24.123586097Z level=info msg="Ex>
Oct 20 09:38:24 srv grafana-server[8275]: logger=migrator t=2022-10-20T09:38:24.133822596Z level=info msg="Ex>
Oct 20 09:38:24 srv grafana-server[8275]: logger=migrator t=2022-10-20T09:38:24.145445262Z level=info msg="Ex>
Oct 20 09:38:24 srv grafana-server[8275]: logger=migrator t=2022-10-20T09:38:24.155881308Z level=info msg="Ex>
Oct 20 09:38:24 srv grafana-server[8275]: logger=migrator t=2022-10-20T09:38:24.165980052Z level=info msg="Ex>
STEP 6) Load the Grafana web interface.
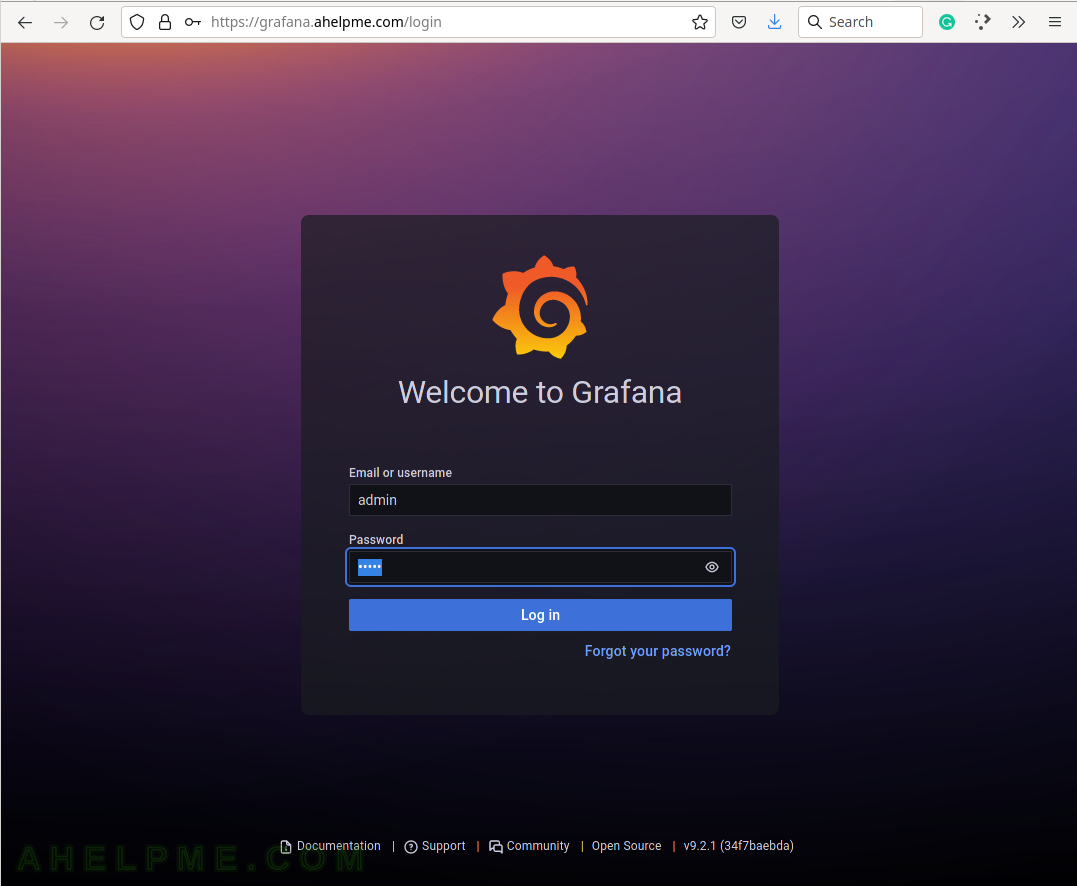
First, change the administrative user password, by opening the web browser and the URL: https://grafana.ahelpme.com and enter the username: admin and password: admin
The following screenshots show the Grafana look and feel and barely scratches what it can do.
SCREENSHOT 1) The first login in Grafana with admin/admin.
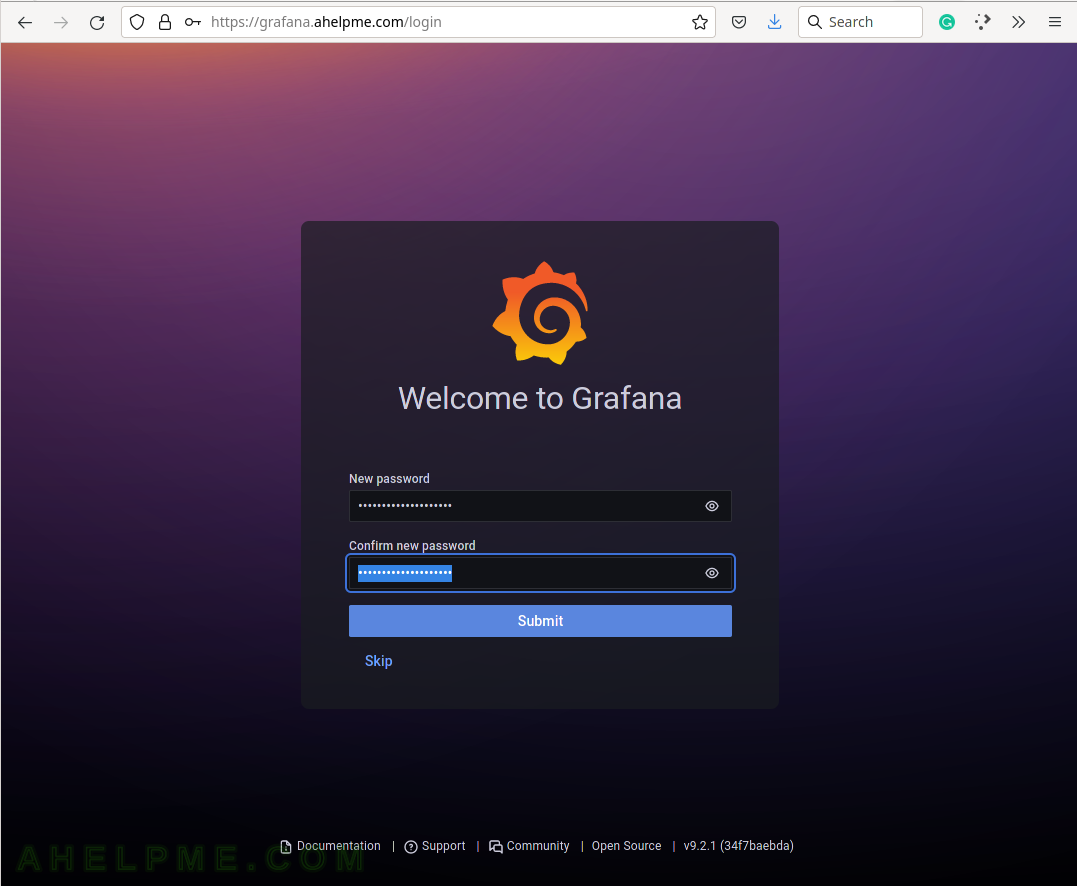
SCREENSHOT 2) On first login with the default password change it to new one.
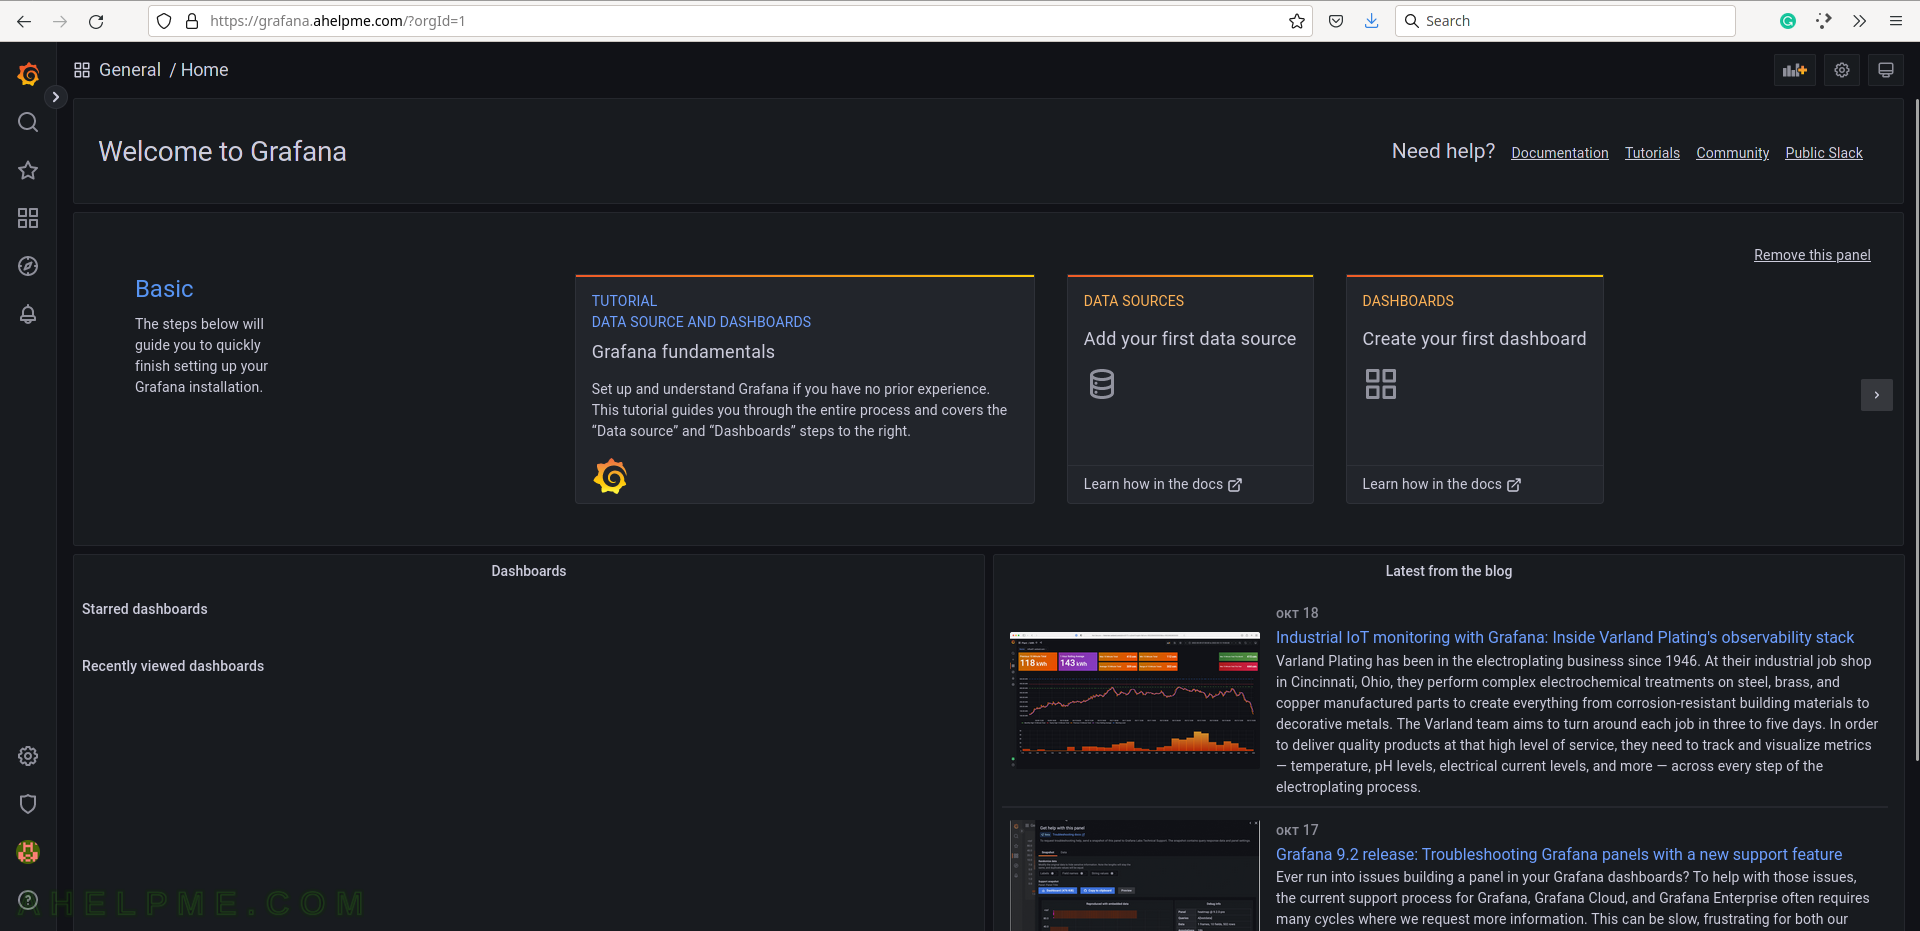
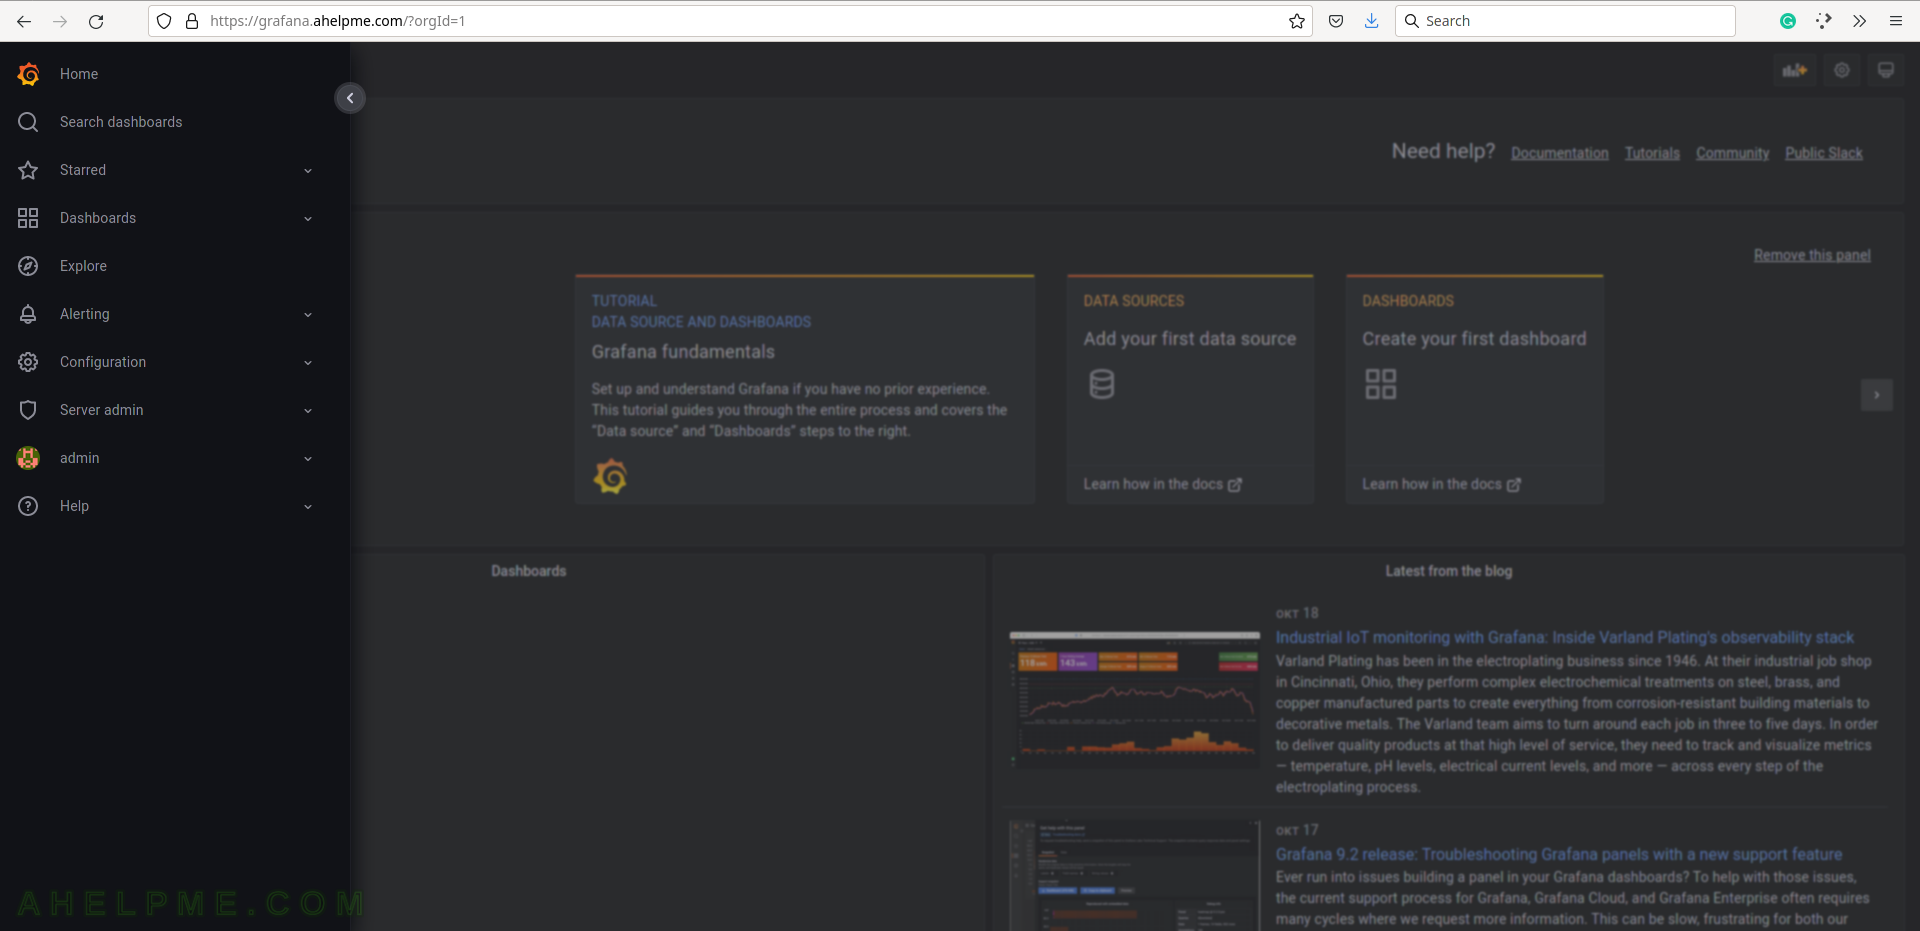
SCREENSHOT 3) The default home page of Grafana.
SCREENSHOT 4) Expand the main menu.
Multiple menus and sub-menus including Home, Search dashboards, Starred, Dashboards, Explore, Alerting, Configuration, Server admin, admin (the logged user) and Help.
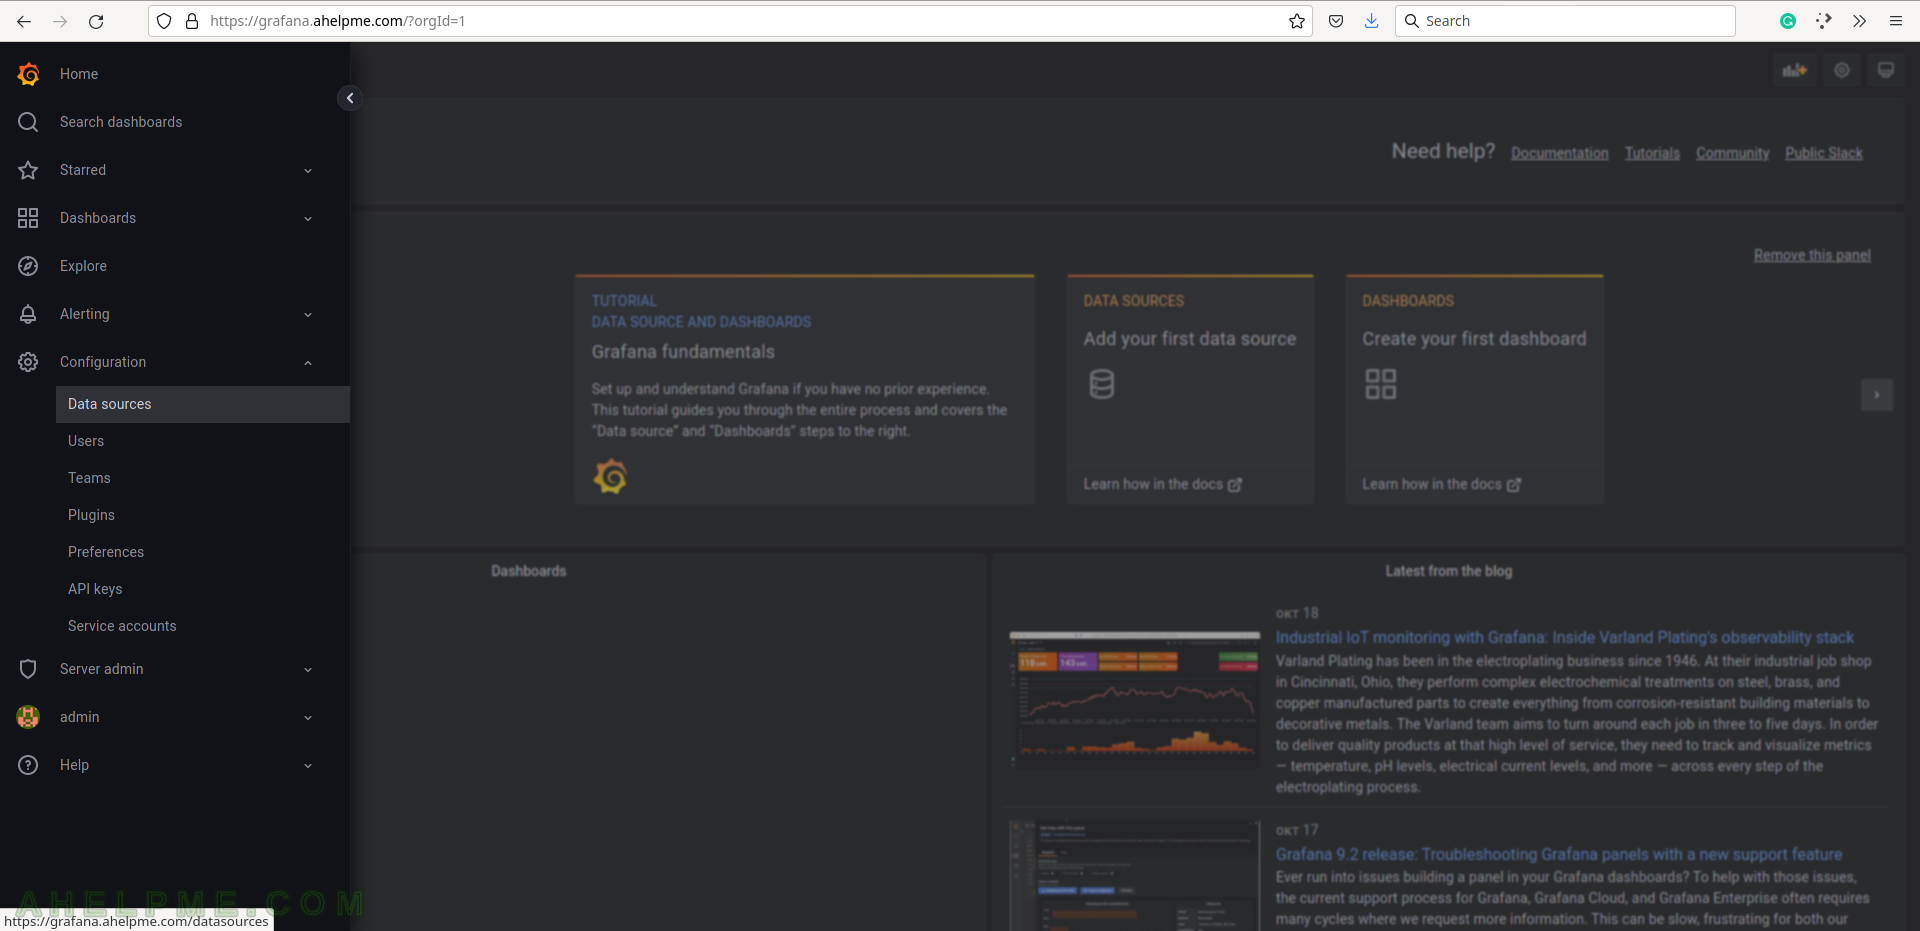
SCREENSHOT 5) Select the Configuration menu and then Data sources to add the database back-end.
Grafana supports multiple back-ends, where the data is stored. Configure a data sources to tell Grafana how to access the data.
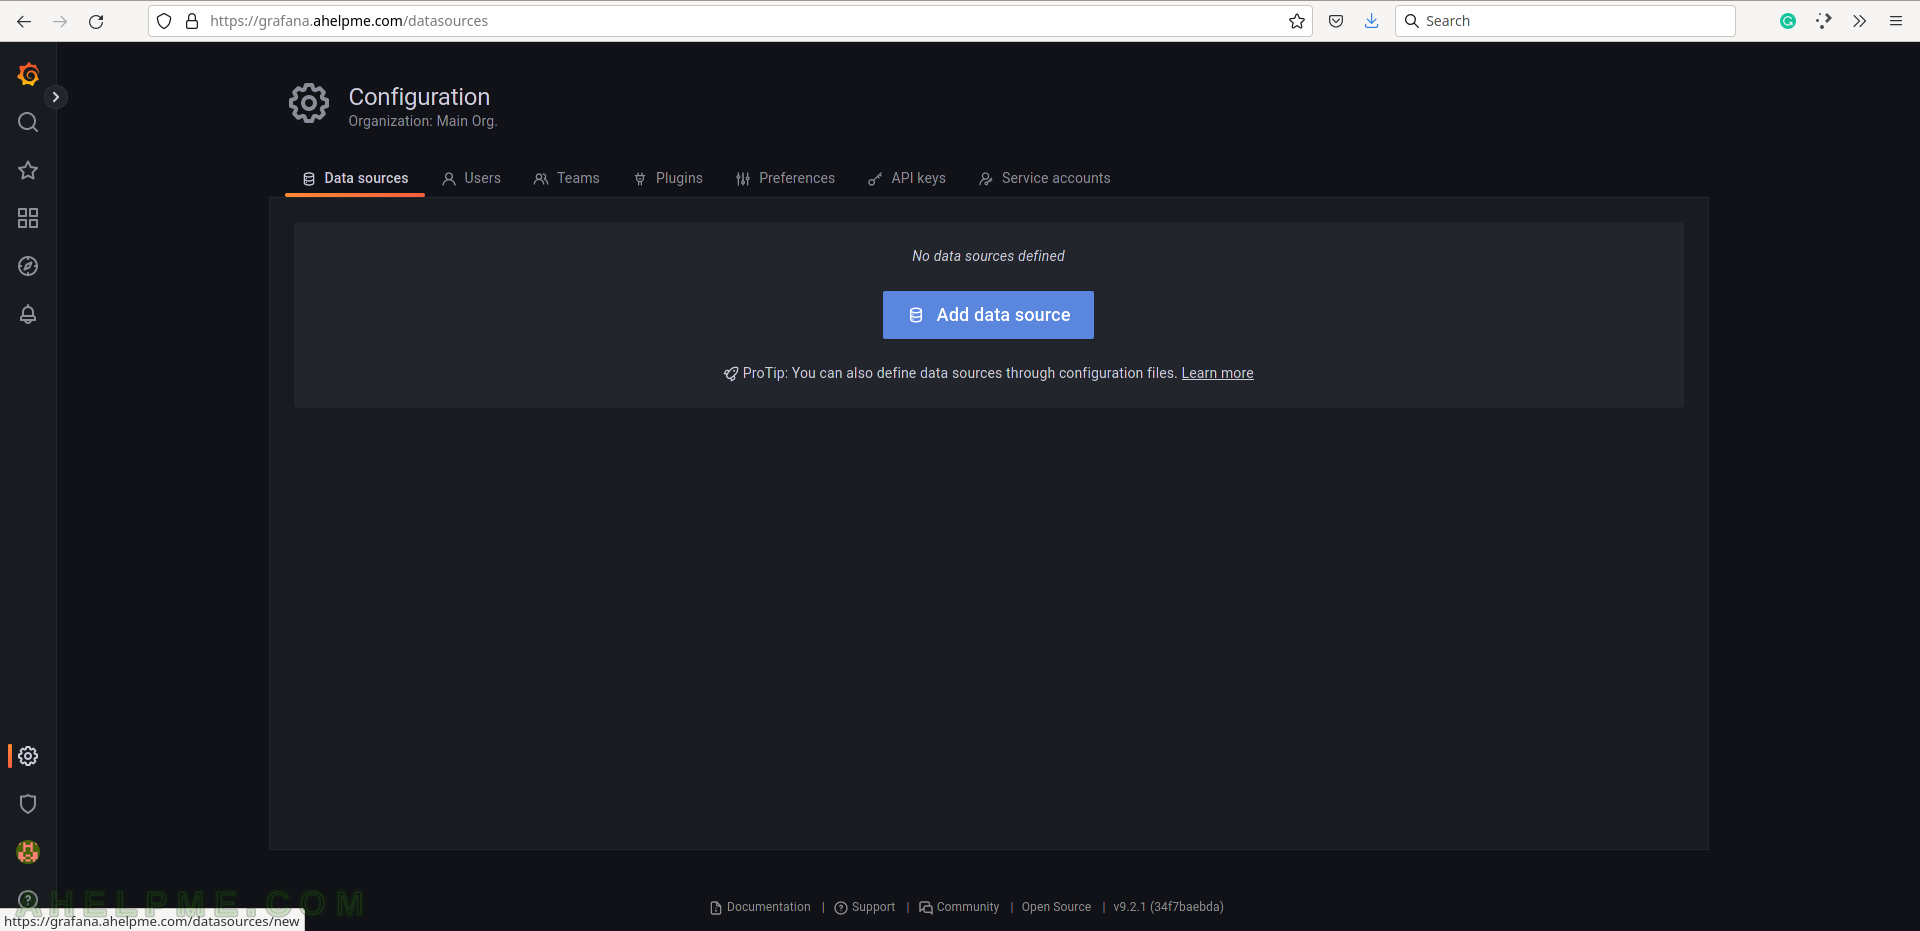
SCREENSHOT 6) To tell Grafana how to access the data use the data sources, which can access it.
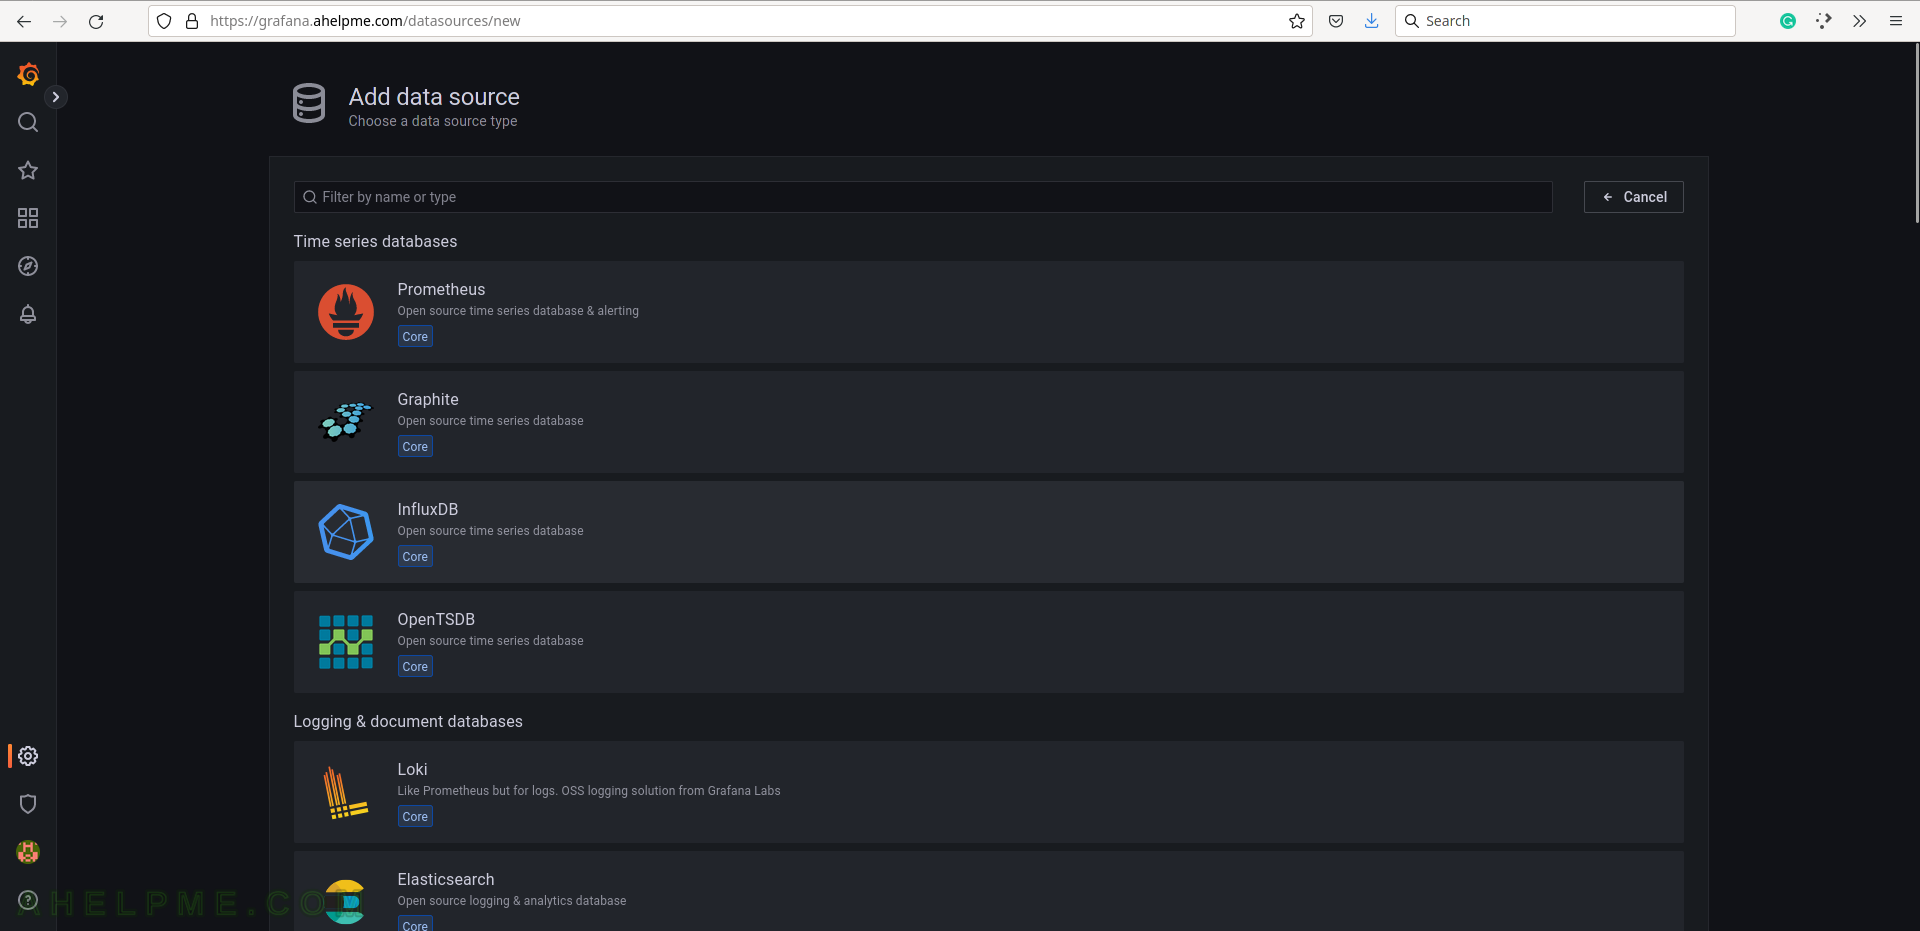
SCREENSHOT 7) Select the InfluxDB line to add and configure an InfluxDB data source.
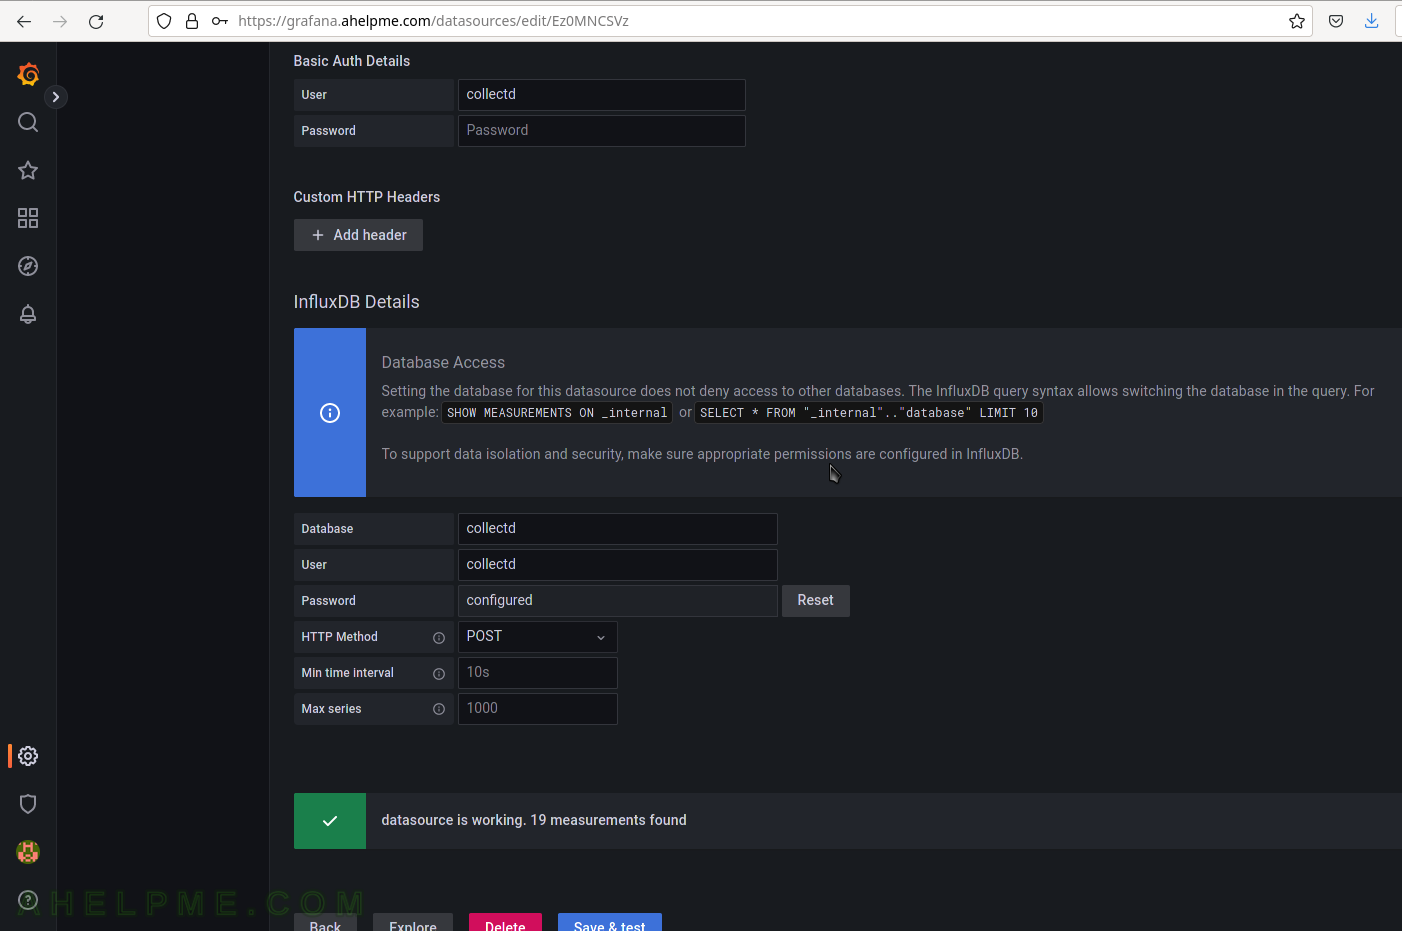
SCREENSHOT 8) Configure how Grafana can access the InfluxDB – URL, database name, and authentication.
Set the name of the source to be “collectd”, URL: http://127.0.0.1:8086 (this is the default local URL if it is remote add the IP of the remote InfluxDB server), and enable the “Basic auth” for basic authentication. Scroll down the page.

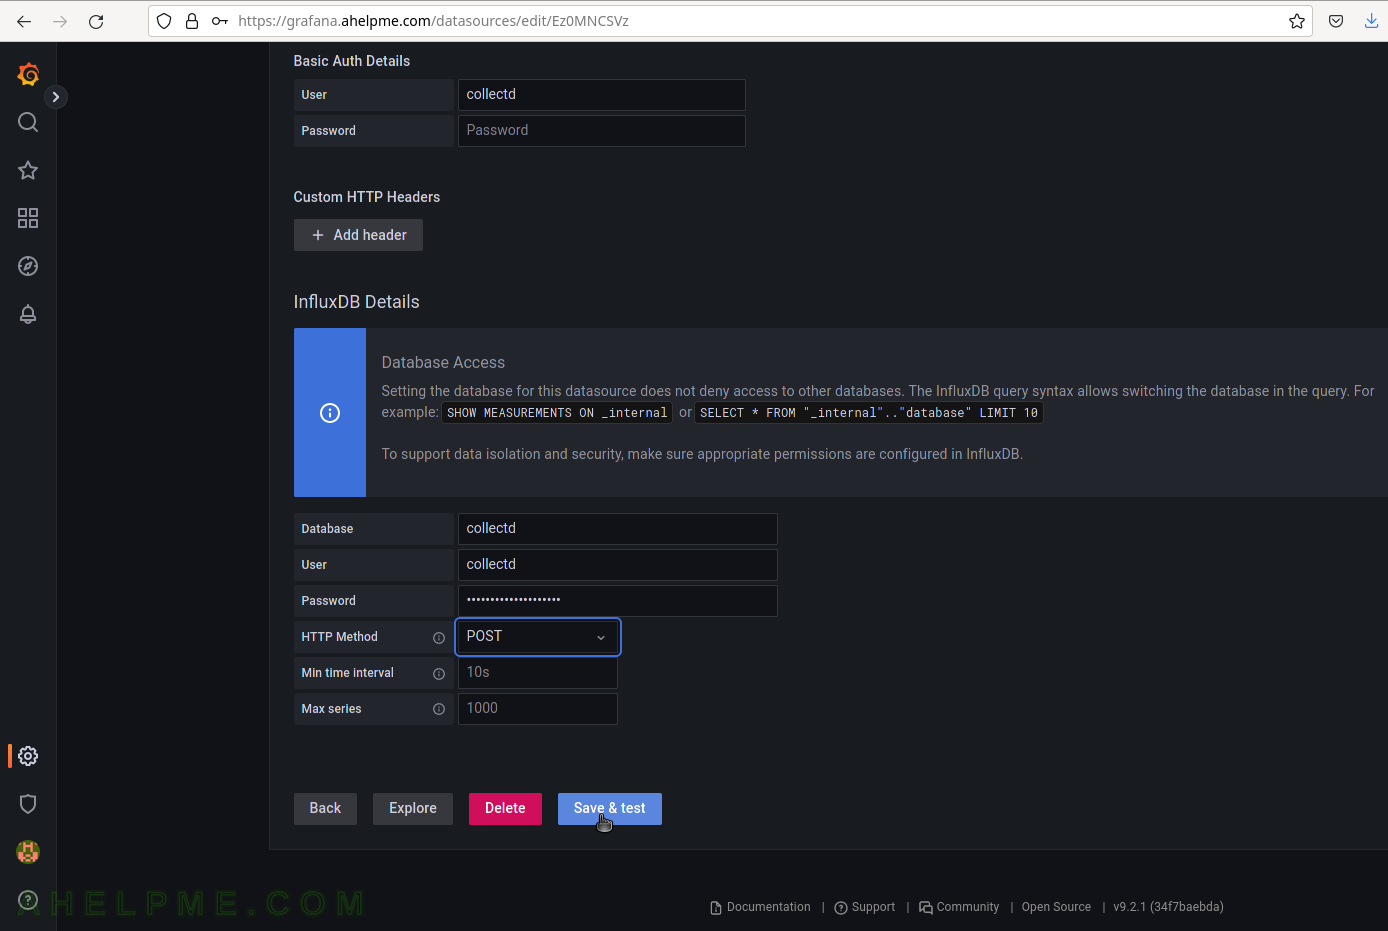
SCREENSHOT 9) Configure the username, password, and database name to access the InfluxDB server.
Fill both sections with the same username and password set during the installation phase above. For database name fill in “collectd” and change the HTTP Method to “POST”. Finally, click on the button “Save & test” to save the new Data source and test the connection to the database back-end.
SCREENSHOT 10) If the connection to the database is working a green note will be shown above the buttons.
The connection is working and a green note is shown – “datasource is working. 7 measurements found.”