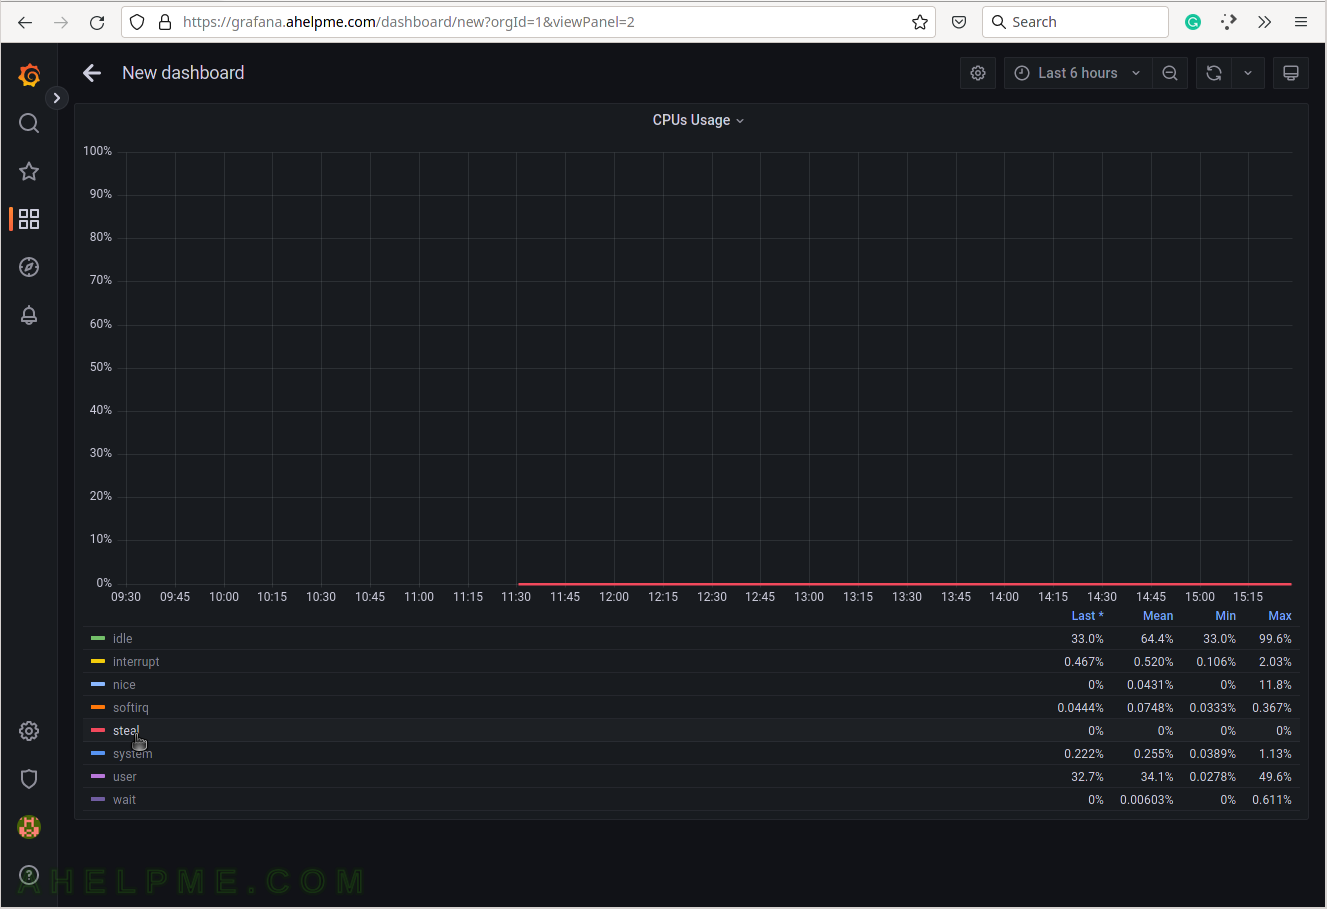
SCREENSHOT 30) By clicking on the steal in the legend all of the other CPU states are hidden and the steal graph line is scaled in the graph.
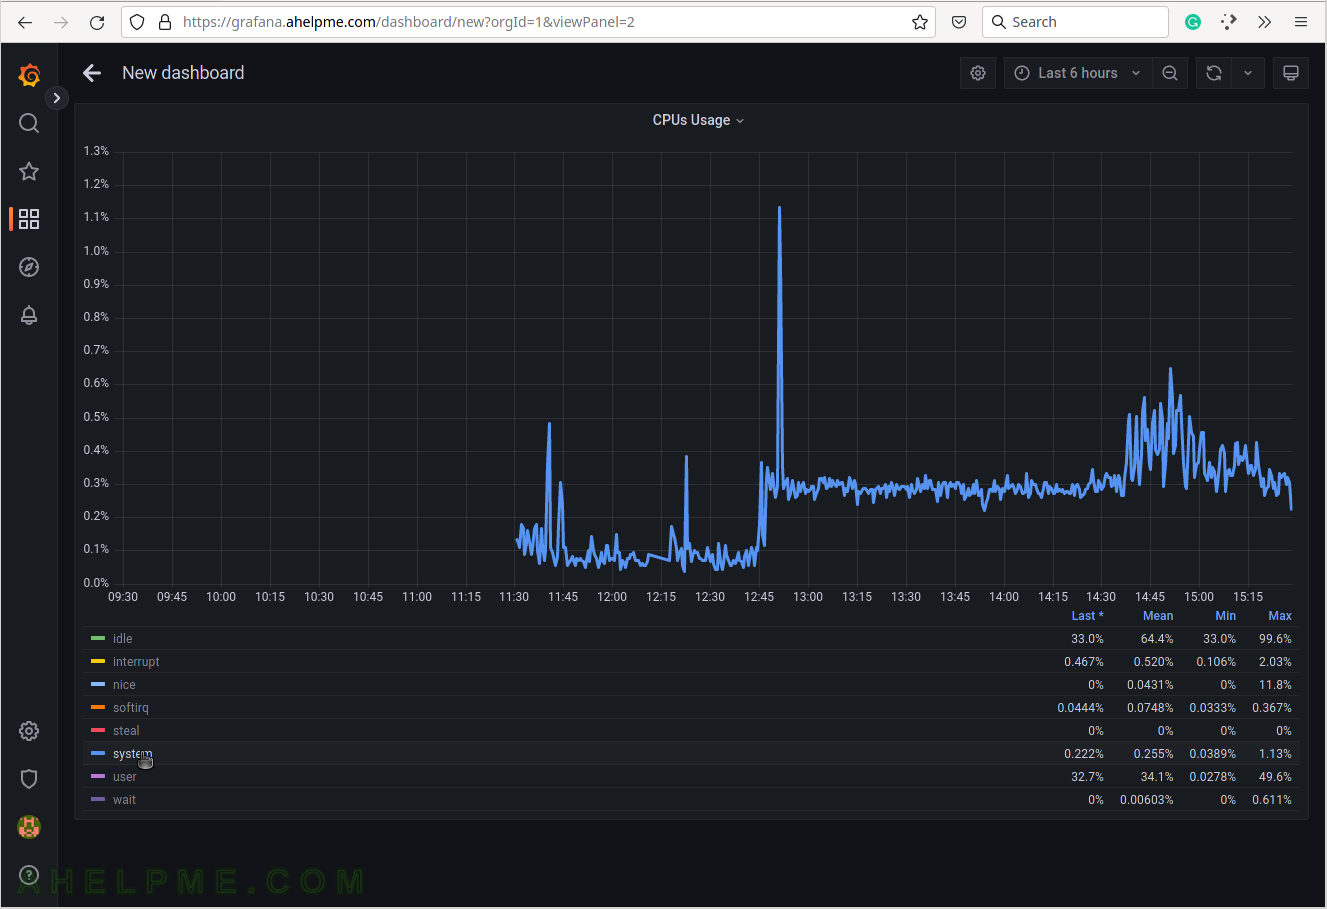
SCREENSHOT 31) By clicking on the system in the legend all of the other CPU states are hidden and the system graph line is scaled in the graph.
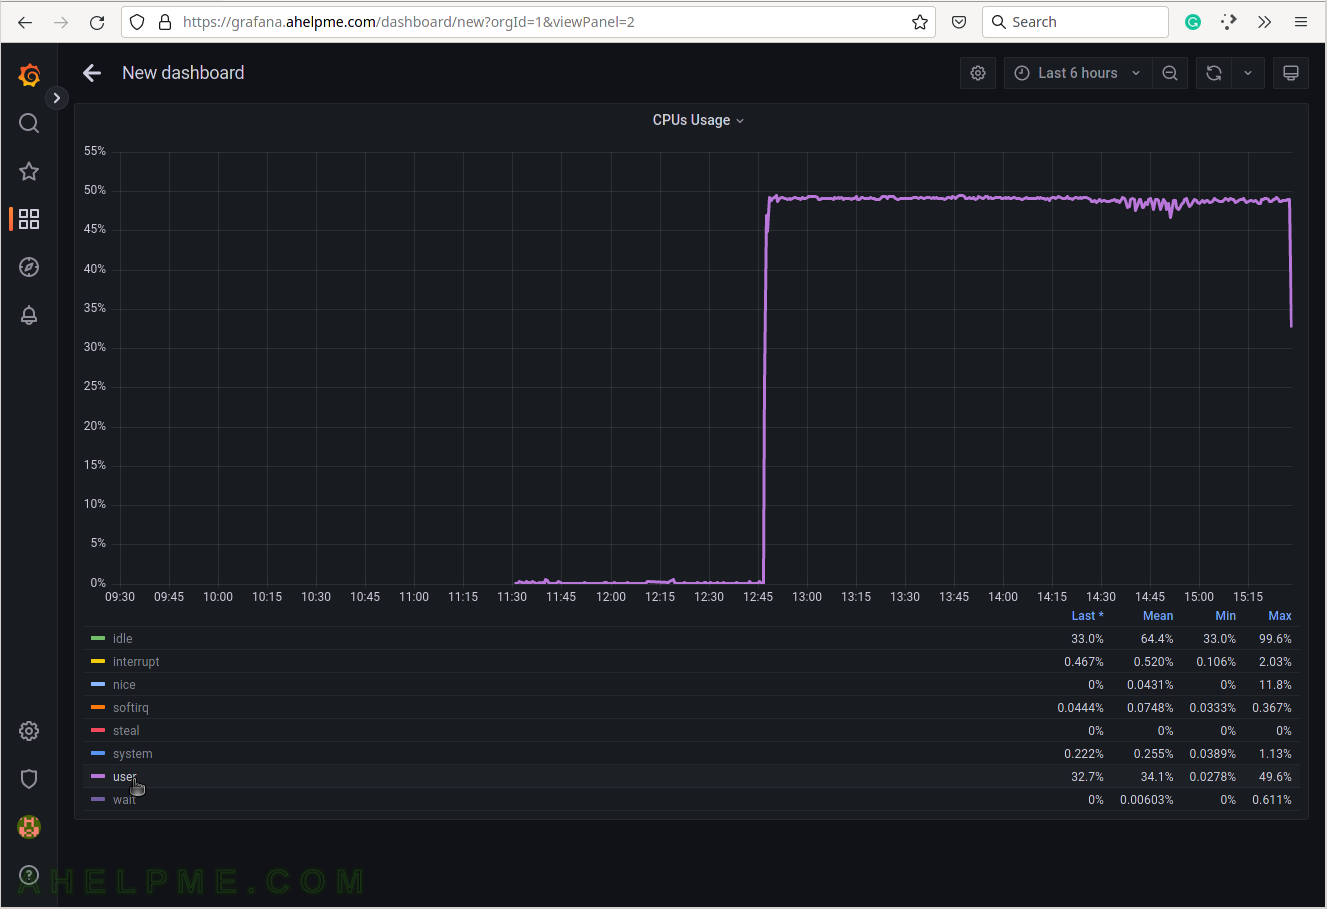
SCREENSHOT 32) By clicking on the user in the legend all of the other CPU states are hidden and the user graph line is scaled in the graph.
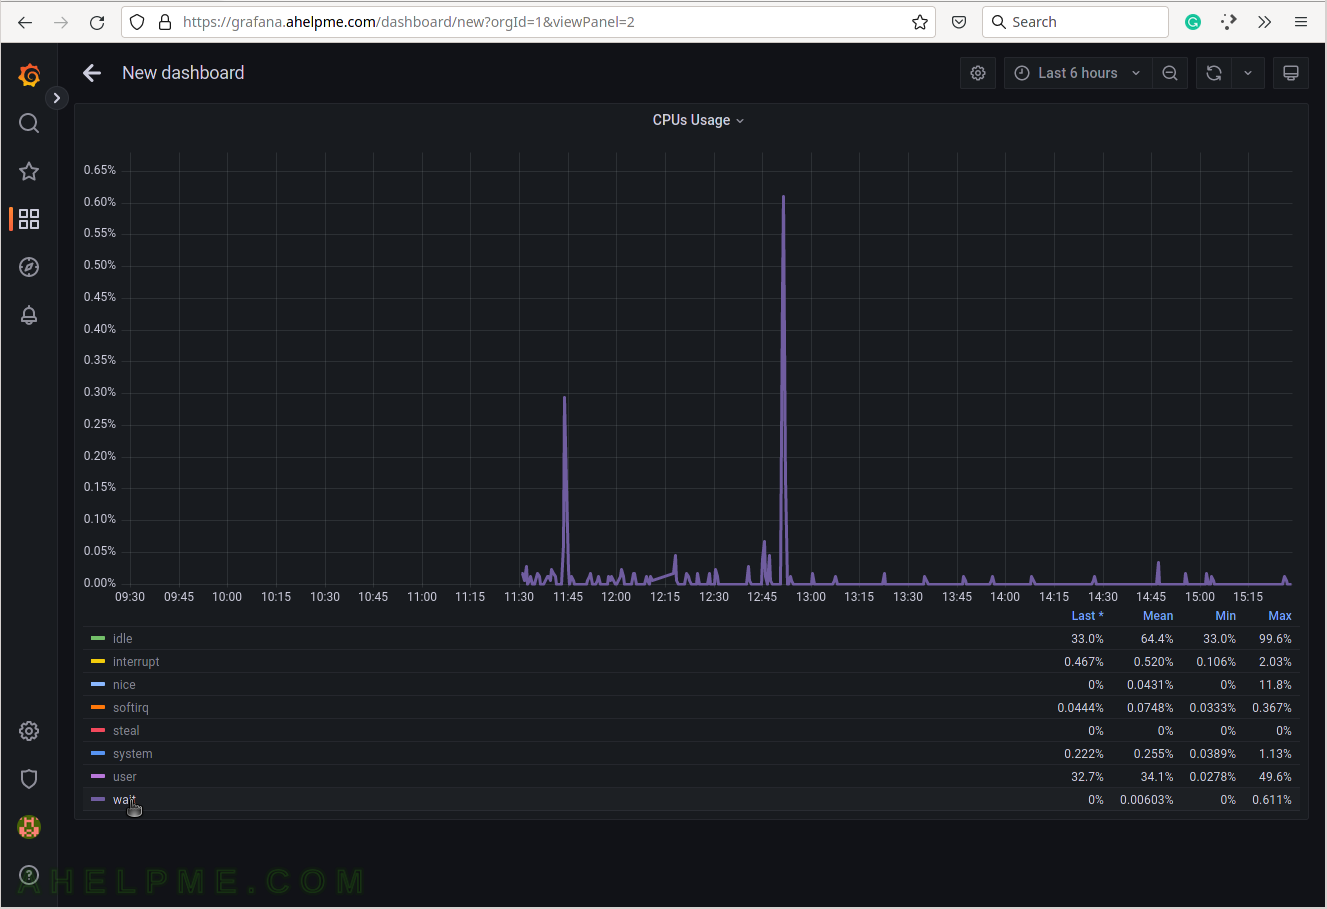
SCREENSHOT 33) By clicking on the wait in the legend all of the other CPU states are hidden and the wait graph line is scaled in the graph.
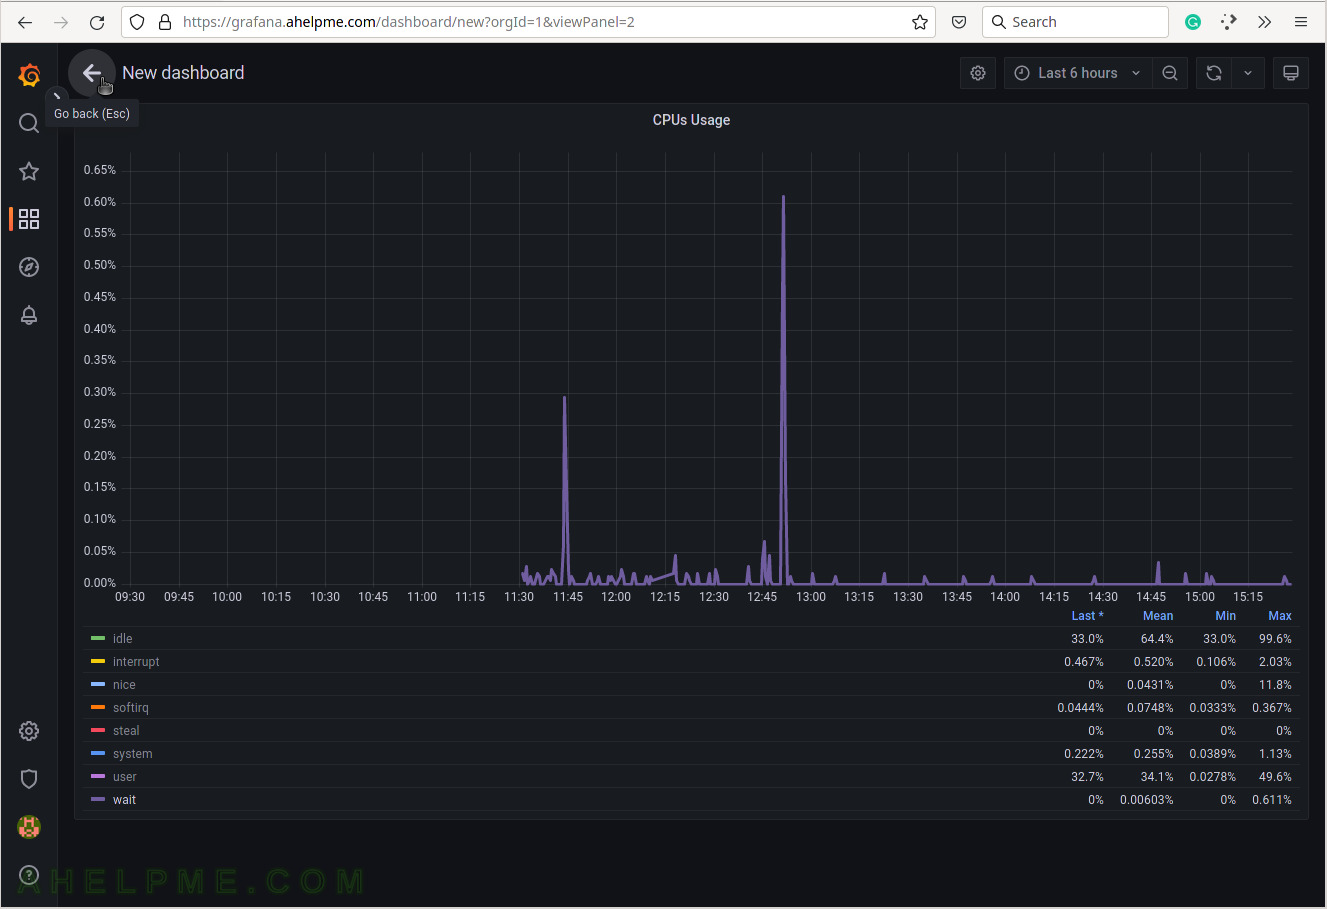
SCREENSHOT 34) Go back to the dashboard view to save the dashboard.
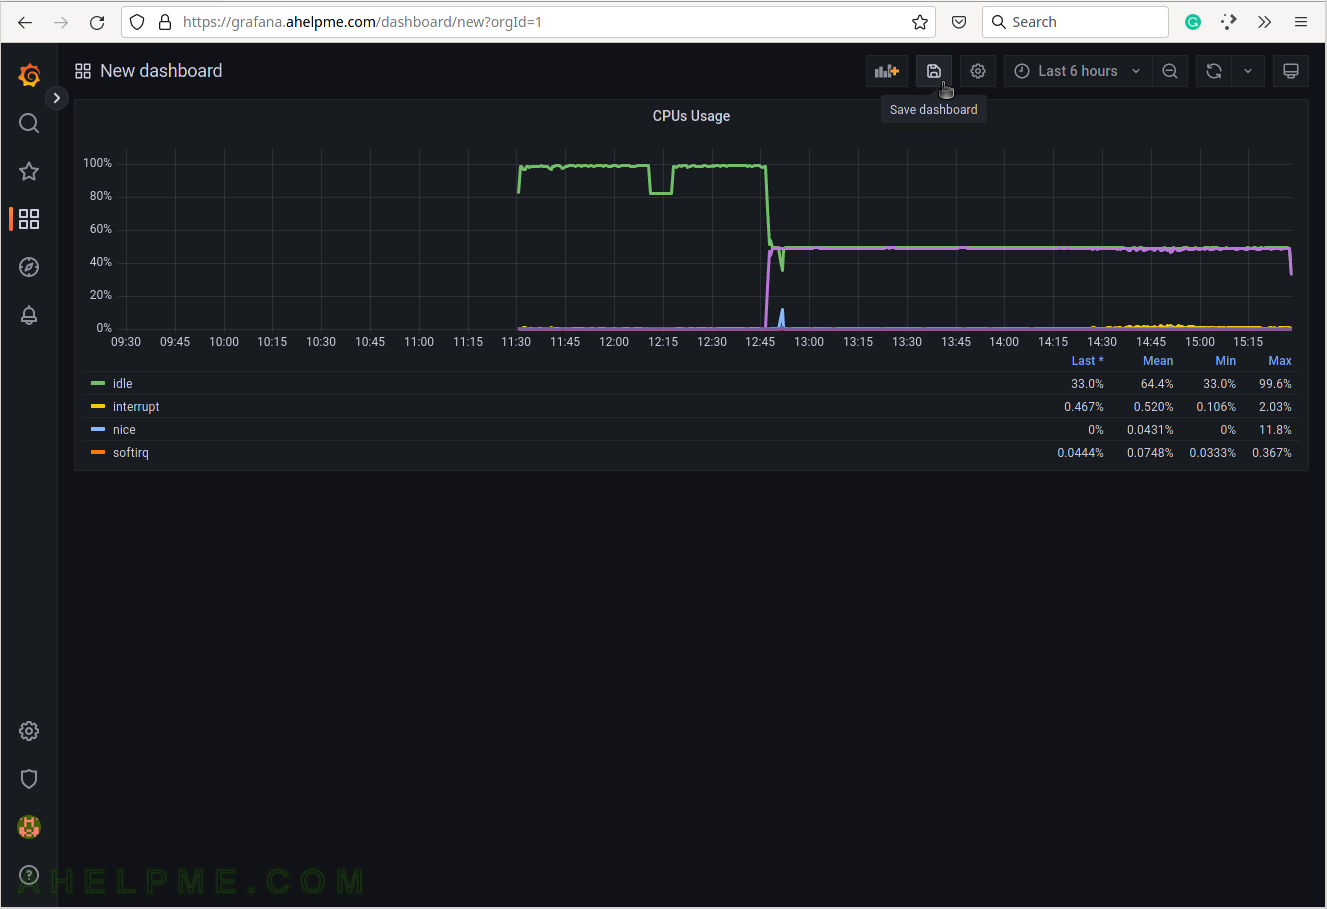
SCREENSHOT 35) Click on the right upper “Save dashboard” button to save the current dashboard.
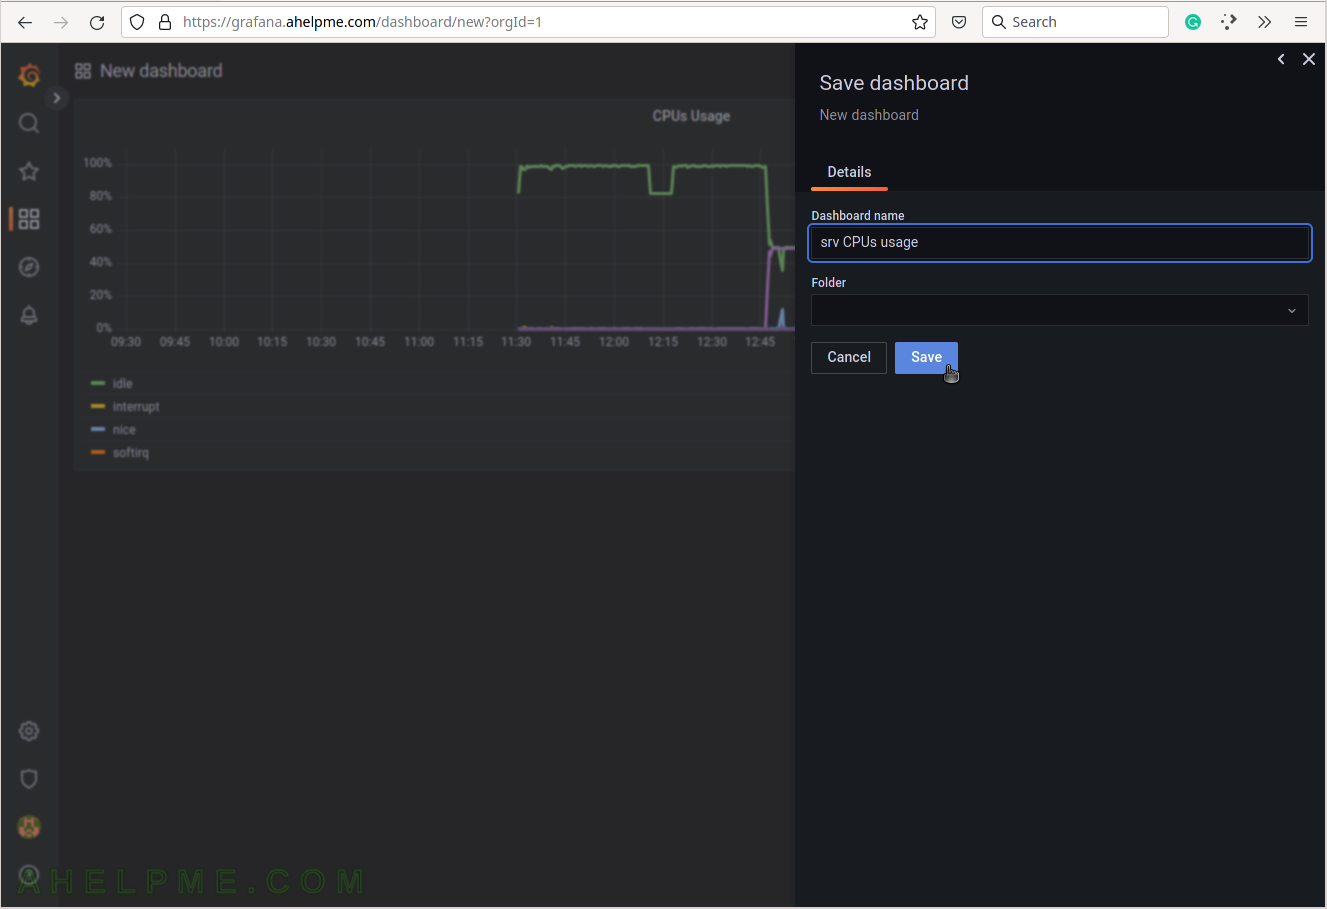
SCREENSHOT 36) Set the dashboard’s name and folder.
Click on “Save” to save all the graphs and the panel data of the newly created dashboard.
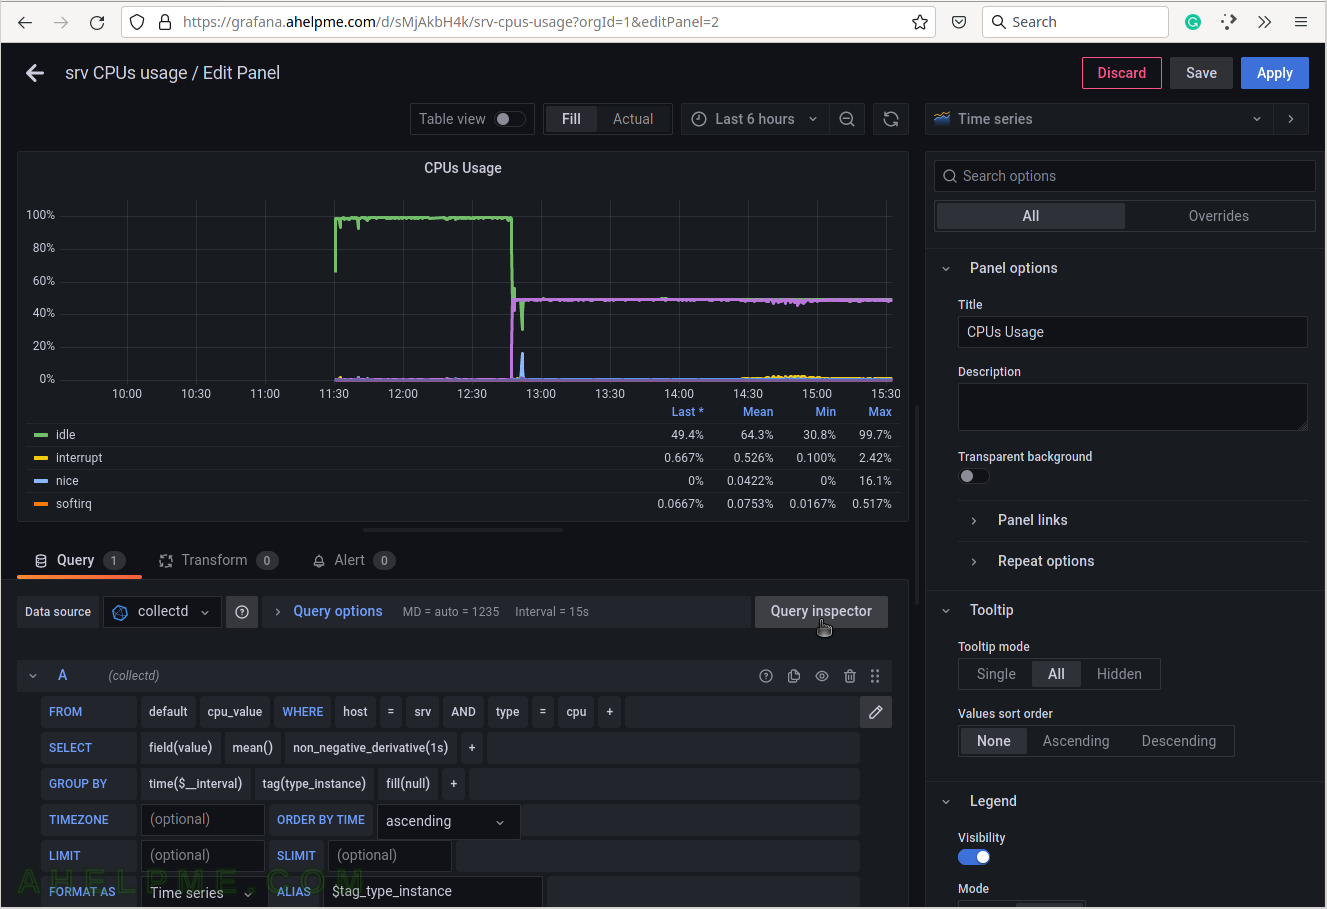
SCREENSHOT 37) Click on “Query Inspector” to see the values behind the graph and the query results or the real query sent to InfluxDB.
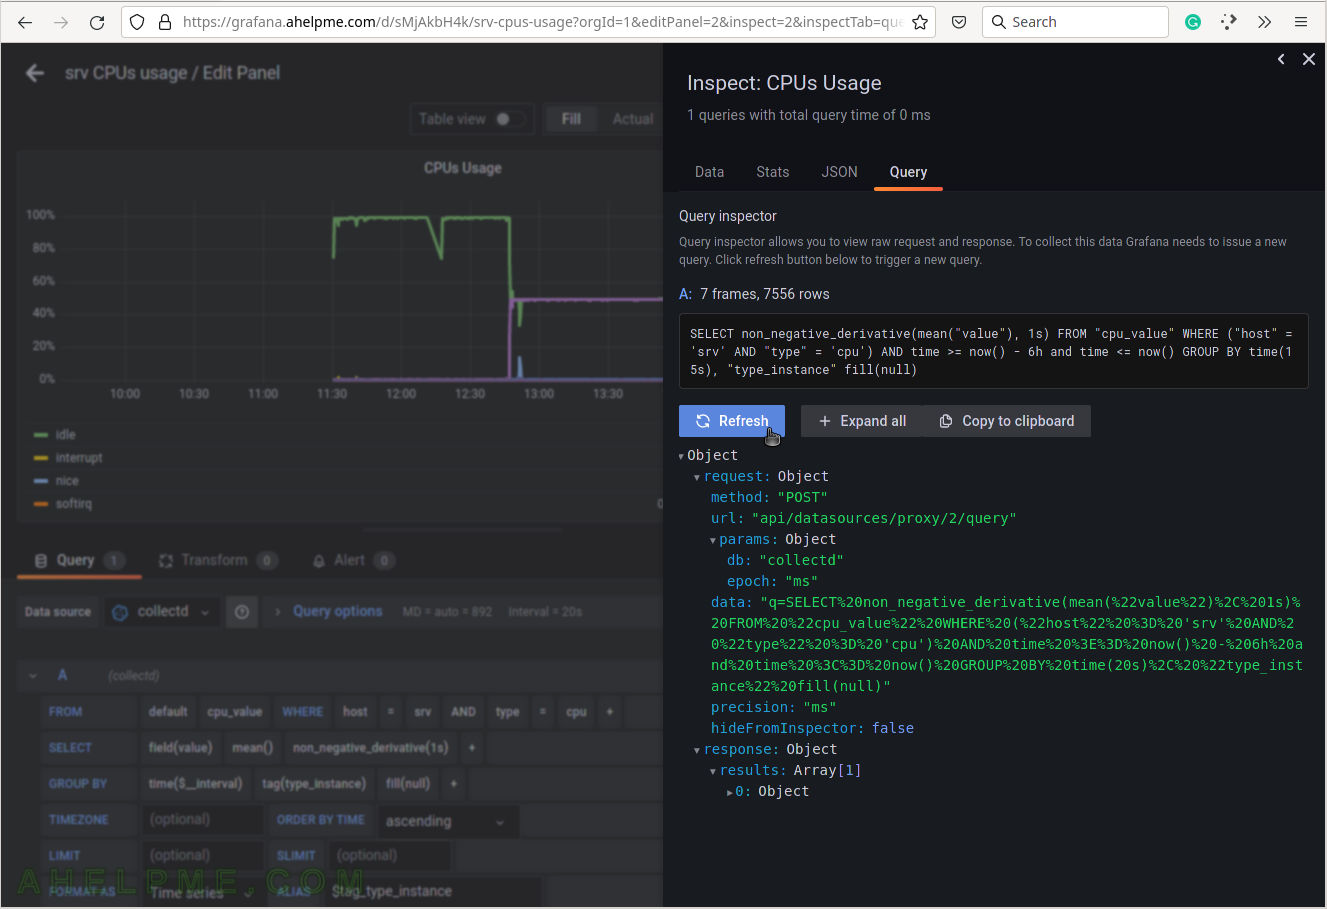
SCREENSHOT 38) The three queries in InfluxQL language, which are sent to the InfluxDB.
Some of the values are replaced with their real values such as “$__interval“, which is based on what time frame is selected – “Last 6 hours”.
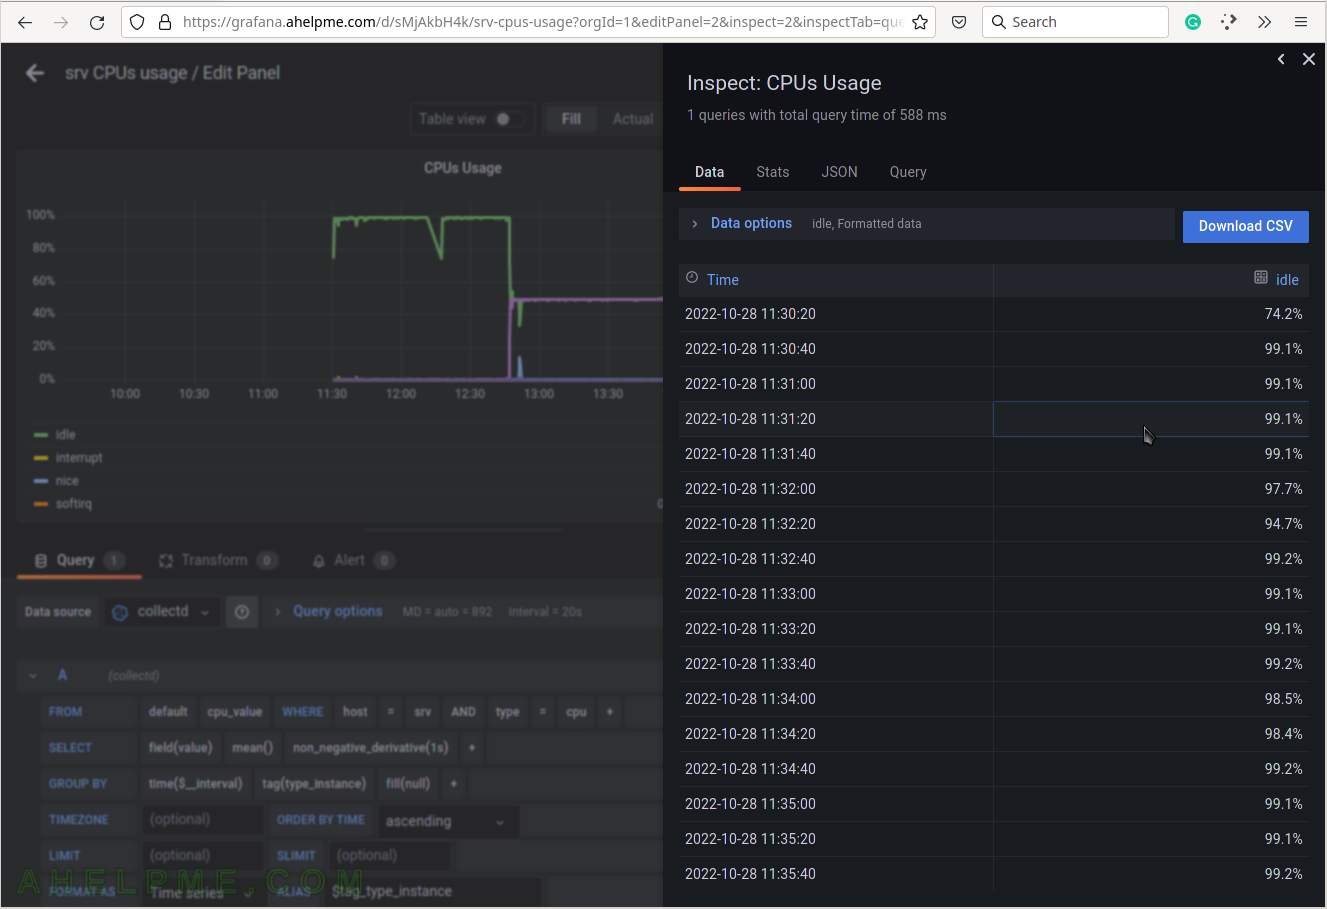
SCREENSHOT 39) The Data tab in Query Inspector shows real values from the queries in a table form.
Multiple values of the idle measurement are shown.