This article shows how to make a graph showing a Linux machine’s load average.
The Linux machine is using collectd to gather the load average and send it to the time series back-end – InfluxDB. Grafana is used to visualize the data stored in the time series back-end InfluxDB and organize the graphs in panels and dashboards. Check out the previous articles on the subject to install and configure such software to collect, store and visualize data – Monitor and analyze with Grafana, influxdb 1.8 and collectd under CentOS Stream 9 and Monitor and analyze with Grafana, influxdb 1.8 and collectd under Ubuntu 22.04 LTS.
The collectd daemon is used to gather data on the Linux system and to send it to the back-end InfluxDB.
Key knowledge for the load collectd plugin
- The collectd plugin Load official page – https://collectd.org/wiki/index.php/Plugin:Load
- The Load plugin options – https://collectd.org/documentation/manpages/collectd.conf.5.shtml#plugin_load
- to enable the load plugin, load the plugin with the load directive in /etc/collectd.conf
LoadPlugin load
- The Load plugin collects data every 10 seconds.
- load_longterm, load_midterm, load_shortterm – 3 gauge values are saved in the database.
- Gauge value – a metric, which value that can go up and down.
A GAUGE value is simply stored as-is. This is the right choice for values which may increase as well as decrease, such as temperatures or the amount of memory used.
- To cross check the value, the user can use the uptime command under Linux or /proc/loadavg
[root@srv ~]# uptime
 23:08:09 up 52 min,  2 users,  load average: 1.00, 0.77, 0.38
[root@srv ~]# cat /proc/loadavg
1.00 0.77 0.38 2/176 1900
The InfluxQL queries for the Linux load average 1,5,15
The queries are Grafana generated.
SELECT mean("value") FROM "load_longterm" WHERE ("host" = 'srv' AND "type" = 'load') AND time >= now() - 6h and time <= now() GROUP BY time(15s) fill(null);
SELECT mean("value") FROM "load_midterm" WHERE ("host" = 'srv' AND "type" = 'load') AND time >= now() - 6h and time <= now() GROUP BY time(15s) fill(null);
SELECT mean("value") FROM "load_shortterm" WHERE ("host" = 'srv' AND "type" = 'load') AND time >= now() - 6h and time <= now() GROUP BY time(15s) fill(null);
The mean function will compute the mean if there is more than one value in the database for every 15 minutes (this is the “group by” logic here). Probably the most accurate query may be to use the last() function instead of mean() and to group by time(1s). As mentioned above, the collectd interval is 10 seconds.
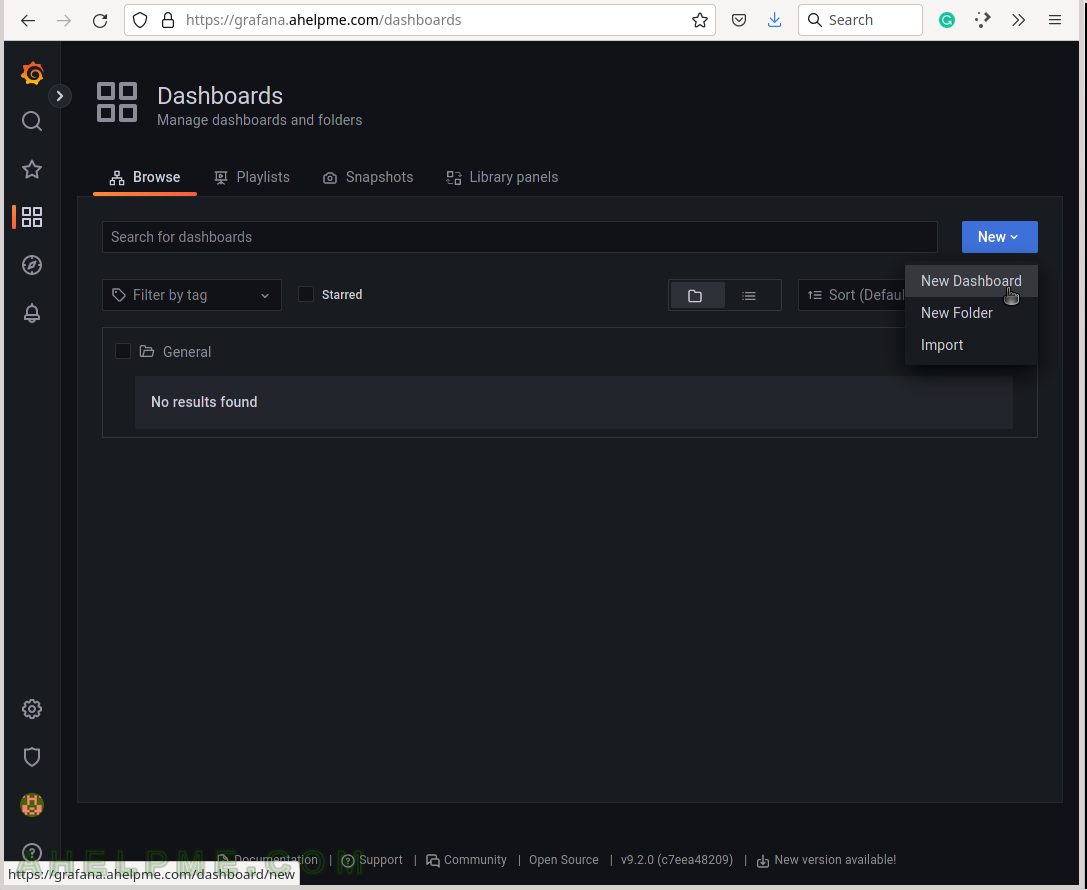
SCREENSHOT 1) Create a new dashboard, which will contain the load average graph.
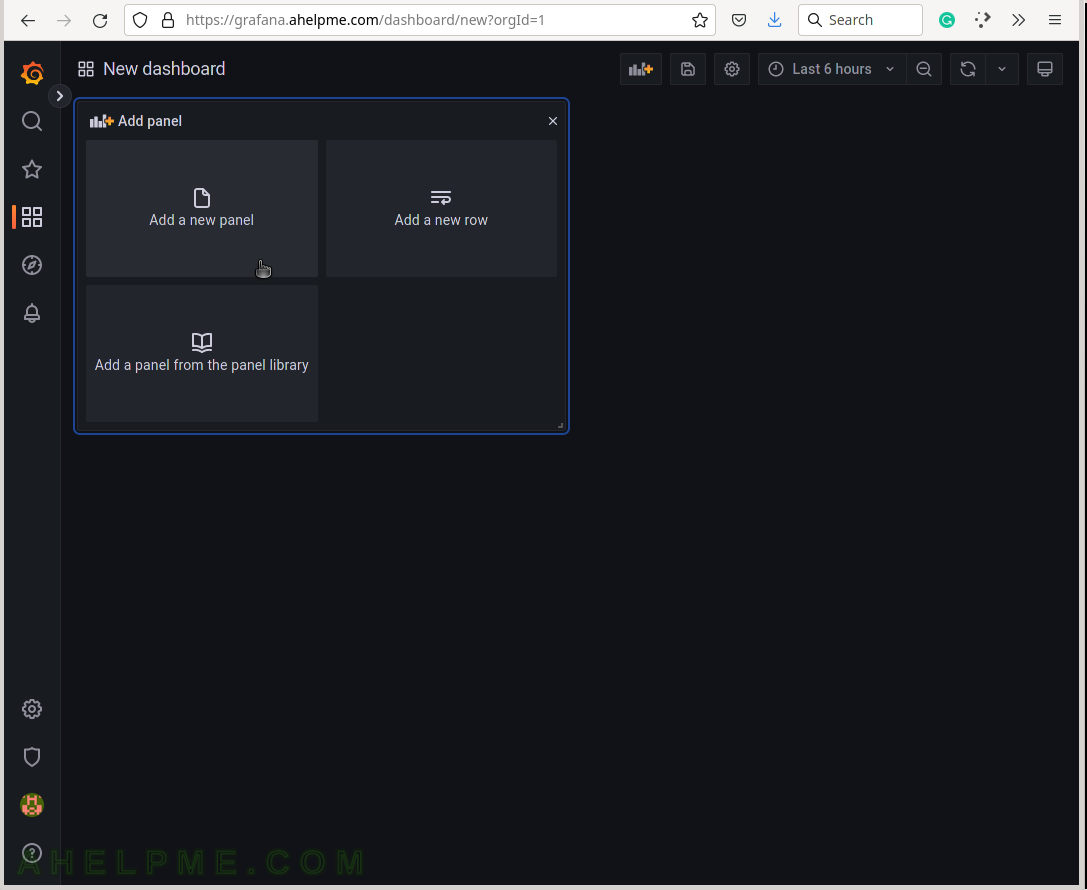
SCREENSHOT 2) Add a new panel in the new dashboard, which will contain the load average graph.
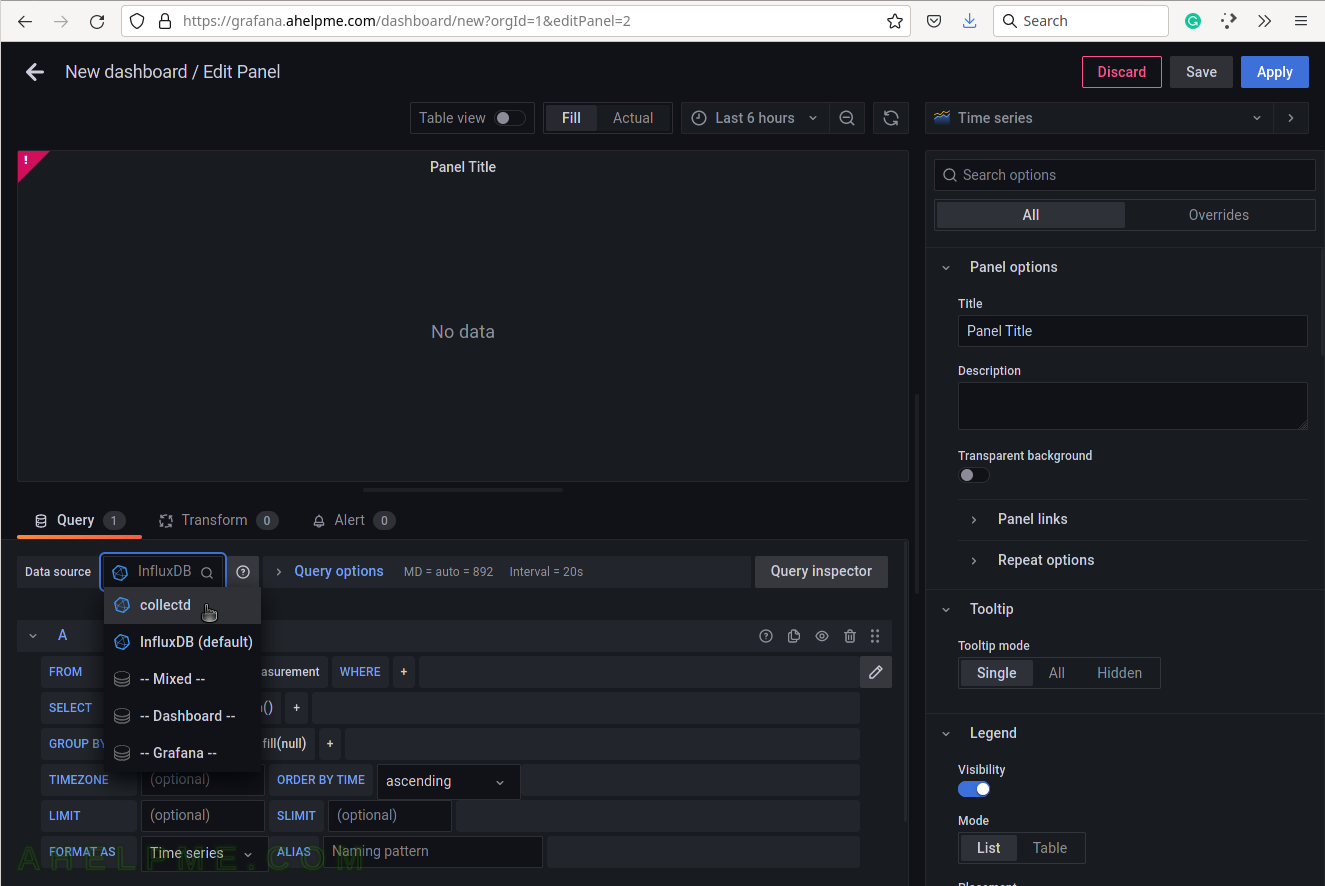
SCREENSHOT 3) Change the “Data Source” to the collectd (InfluxDB) database and ensure on the right top the graph type is “Time series”.
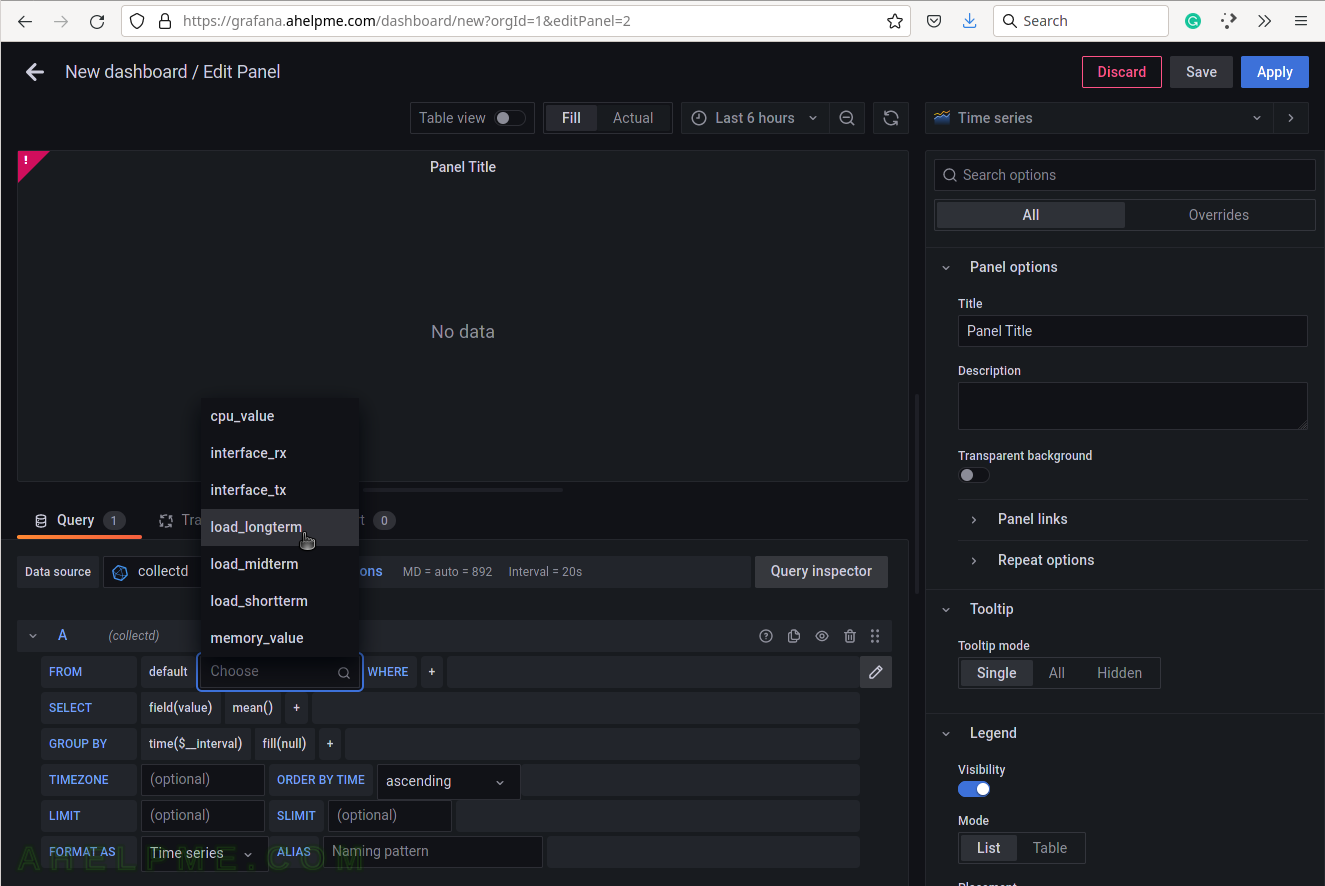
SCREENSHOT 4) Choose the load_longterm from the measurement drop-down list.
There are all measurements in the drop-down list in the database collectd.
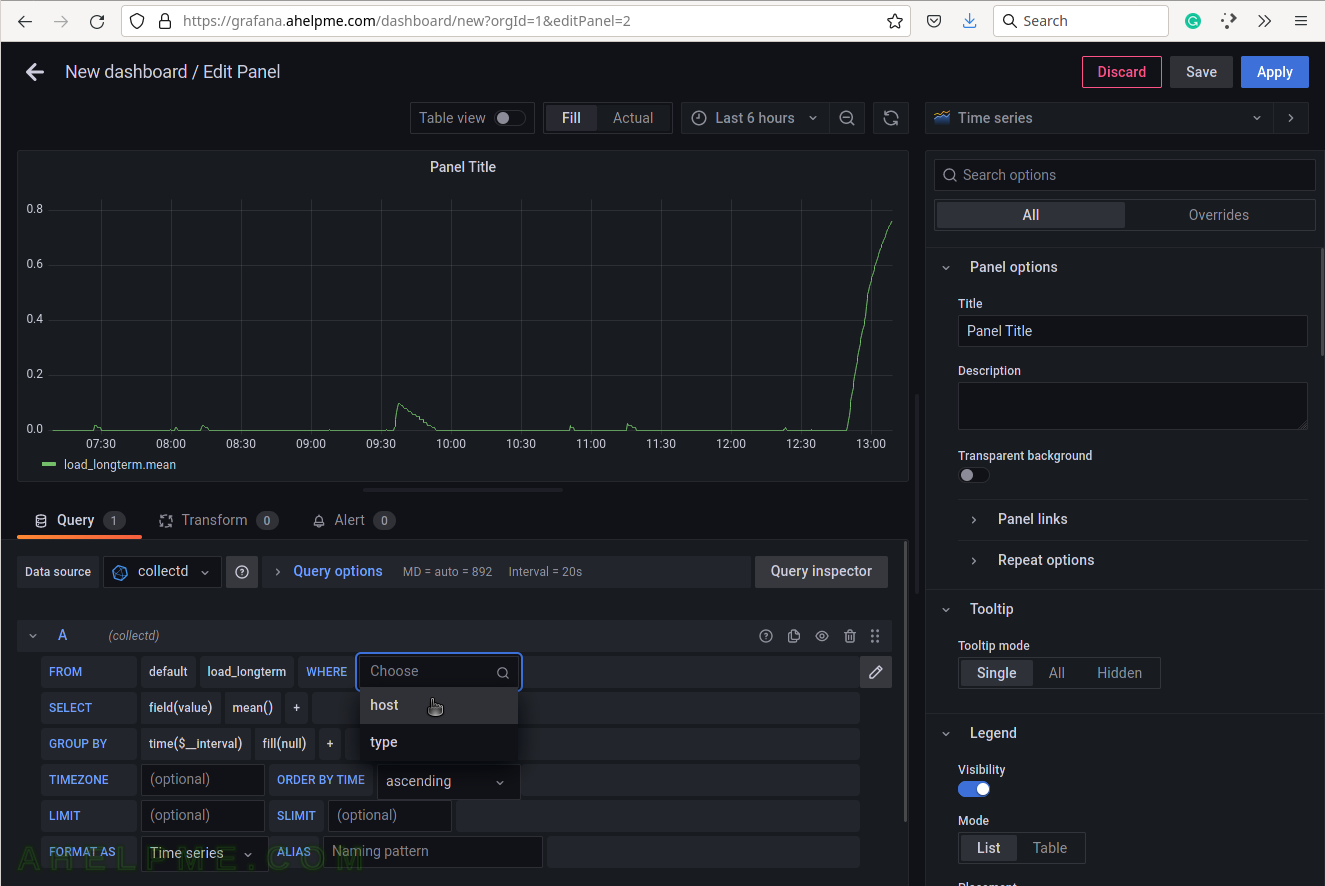
SCREENSHOT 5) Select the tag name “host” to limit the query for a selected hostname.
A tag is a key-value pair, which represents the metadata of a measurement record. For example, a measurement record consists of the actual measurement value and some metadata for it such as which did the measurement and where. The server hostname “srv” is the tag value and the tag key is the “host” name of the tag.
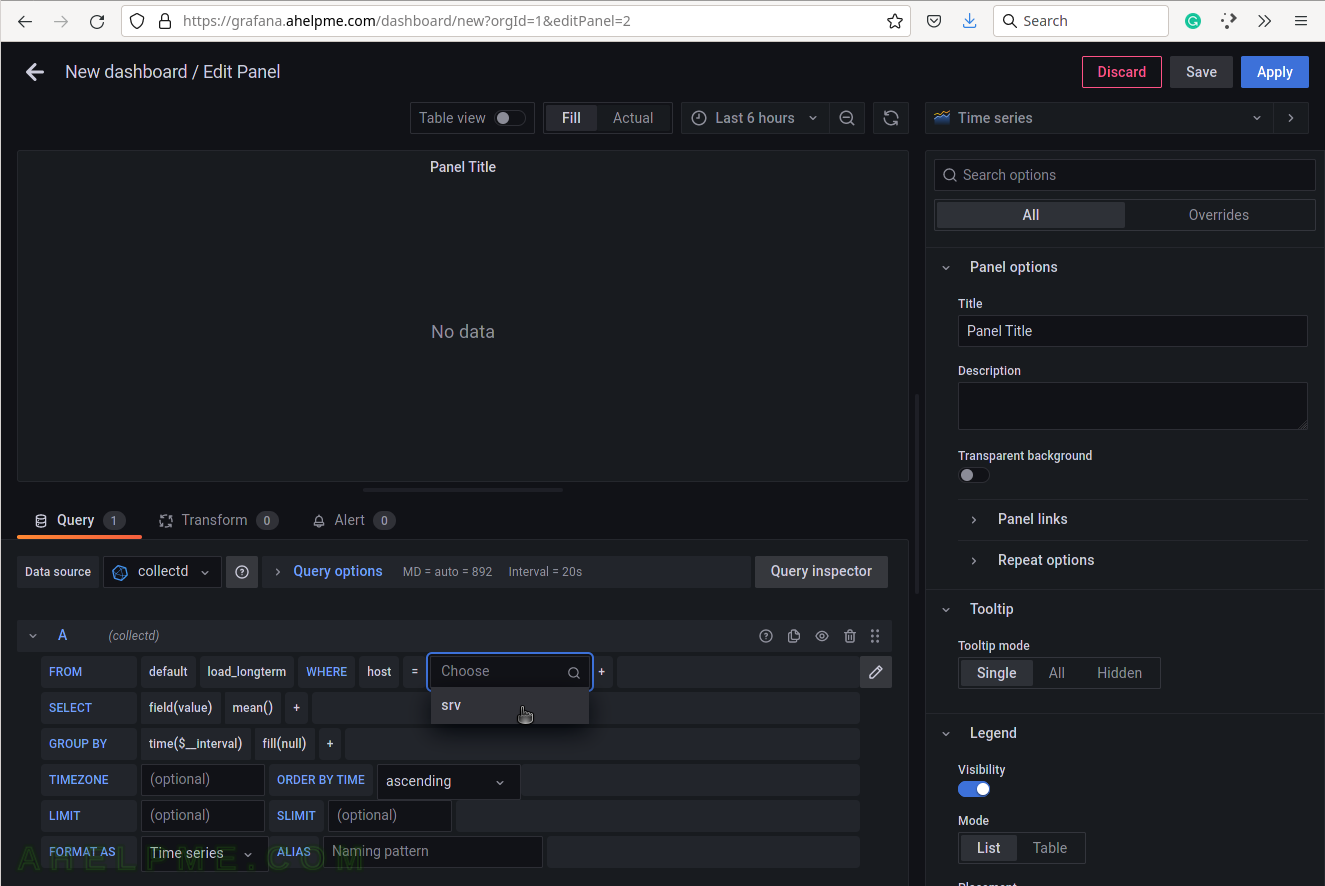
SCREENSHOT 6) Select the tag value “srv”.
This setup has only one server, so no other servers’ hostnames are shown.
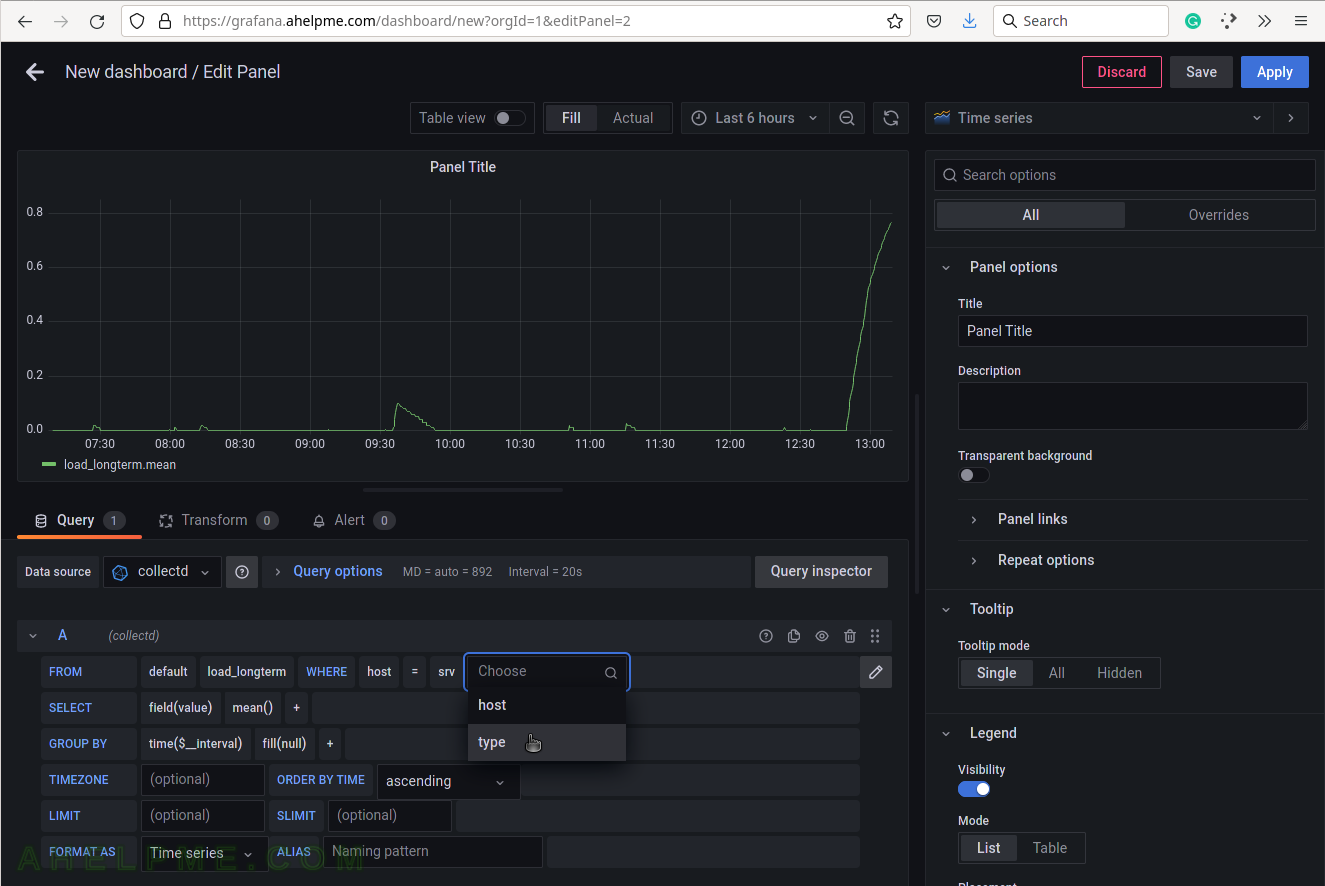
SCREENSHOT 7) Select the type of measurement.
Yet another measurement metadata.
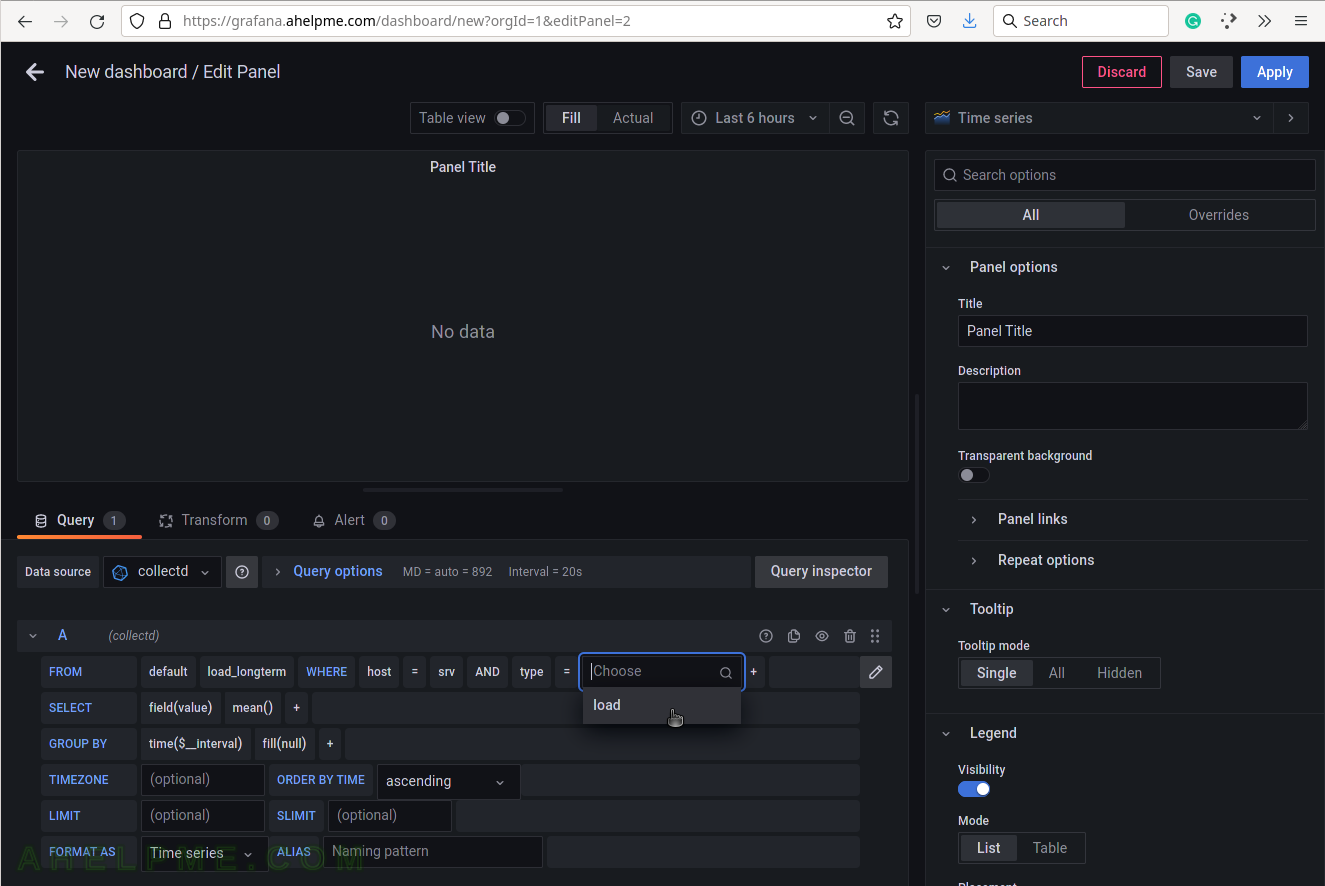
SCREENSHOT 8) Select load for the tag value.
There is only one value and it is the string “load”.
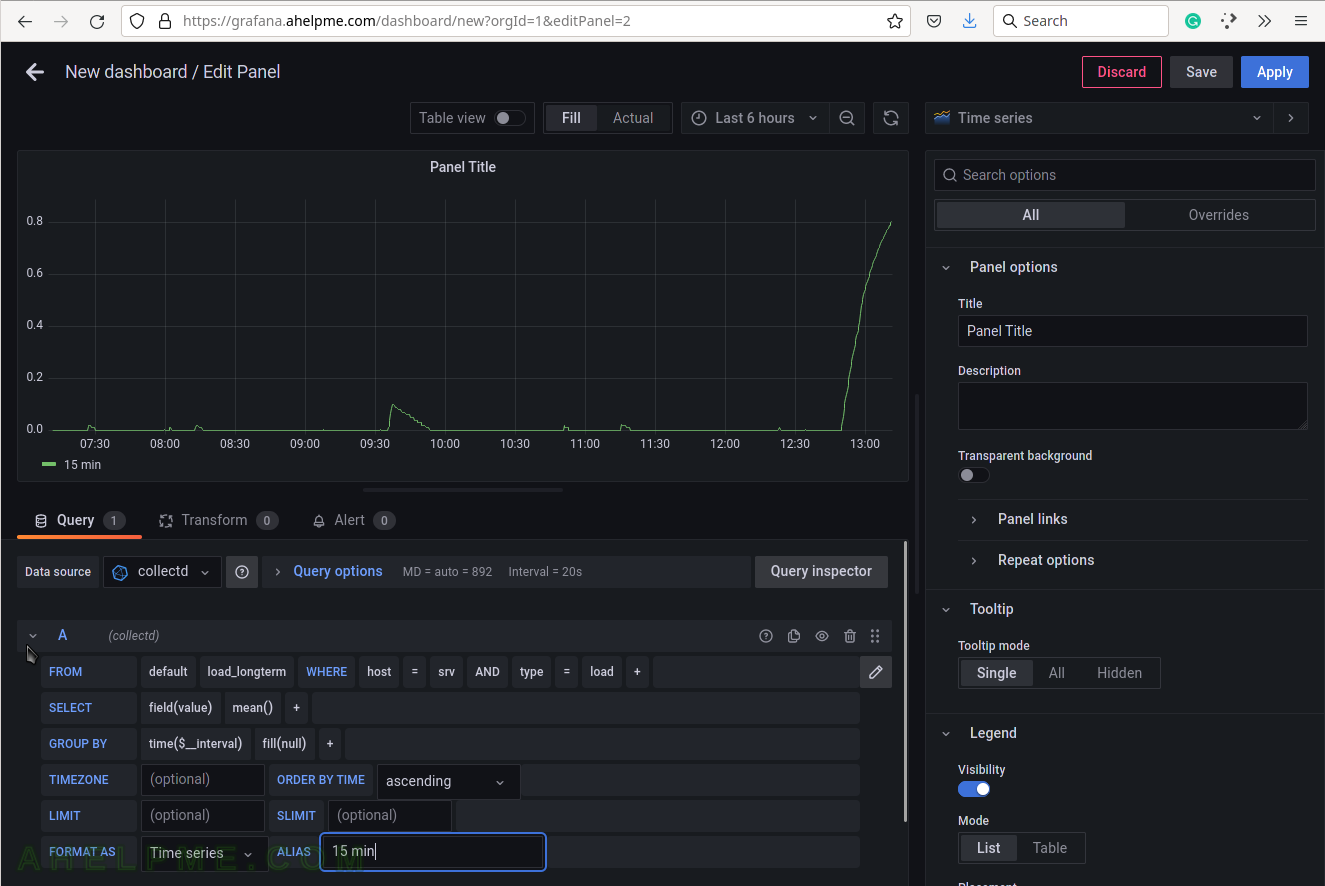
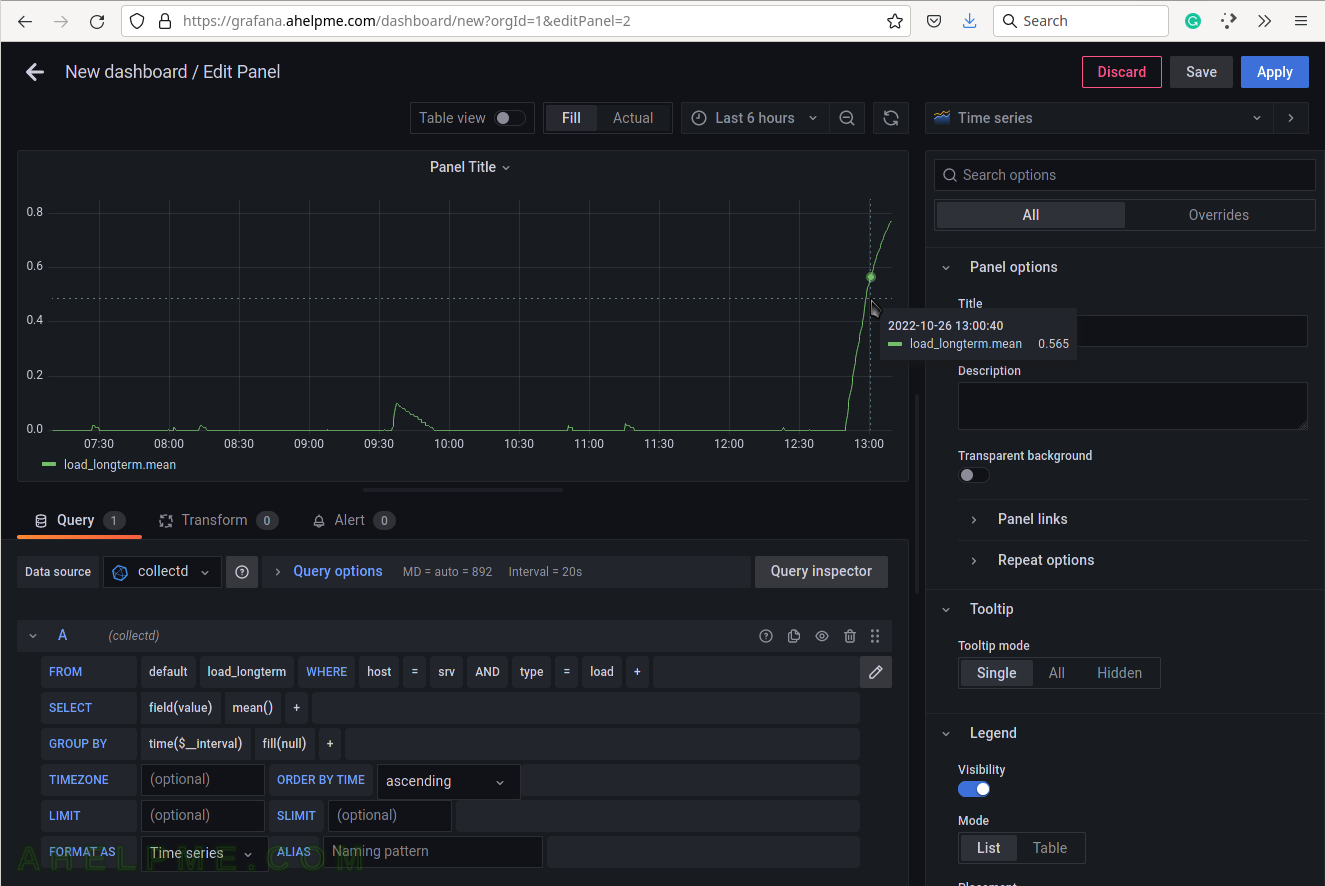
SCREENSHOT 9) The 15-minute load average query is ready.
The graph shows the behavior of the 15-minute load average for the last 6 hours. There is an important variable “$__interval“, which may be edited and set to the rate of the original data (if applicable, not for the load average) or left as is to be computed each time based on the selected time frame of the graph (6 hours for this example). There is a spike after 12:30. Hovering the mouse over the lines in the graph it will appear a tooltip with the values for the current time.
SCREENSHOT 10) Set an alias – a meaningful name for the measurement such as “15 min” for the 15-minute value of the load average.
Hide the query by clicking on the down key in front of the “A” (A for the first query).