This article describes how to build a modern analytic and monitoring solutions for system and application performance metrics. A solution, which may host all the server’s metrics and a sophisticated application, allows easy analyses of the data and powerful graphs to visualize the data.
A brief introduction to the main three software used to build the proposed solution:
- Grafana – an analytics and a web visualization tool. It supports dashboards, charts, graphs, alerts, and many more.
- influxdb – a time series database. Bleeding fast reads and writes and optimized for time.
- collectd – a data collection daemon, which obtain metrics from the host it is started and sends the metrics to the database (i.e. influxdb). It has around 170 plugins to collect metrics.
What is the task of each tool:
- collectd – gathers metrics and statistics using its plugins every 10 seconds on the host it runs and then sends the data over UDP to the influxdb using a simple text-based protocol.
- influxdb – listens on an open UDP port for data coming from multiple collectd instances installed on many different devices. In this case, a Linux server running CentOS Stream 9.
- Grafana – an analytics and a web visualization tool. A web application, which connects to the InfluxDB and visualizes the time series metrics in graphs organized in dashboards. Graphs for CPU, memory, network, storage usage, and many more.
- nginx to enable SSL and proxy in front of the Grafana.
The whole solution uses the CentOS Stream 9 Linux distro. Installing the CentOS Stream 9 is a mandatory step to proceed further with this article – Network installation of CentOS Stream 9 (20220606.0) – minimal server installation
The UDP influxdb port should be open per IP basis and web port of the web server (nginx) is up to the purpose of the solution – it can be behind a VPN or openly accessible by Internet.
STEP 1) Install additional repositories for Grafana, influxdb and collectd.
Install CentOS official EPEL and OpsTools repositories. EPEL provides additional packages to the base CentOS packages and OpsTools provides collectd and more collectd plugins than the ones included in the built-in repositories.
dnf install -y epel-release centos-release-opstools
Add the InfluxDB repository by creating a file in /etc/yum.repos.d/influxdb.repo
[influxdb]
name = InfluxDB Repository - RHEL $releasever
baseurl = https://repos.influxdata.com/centos/$releasever/$basearch/stable
enabled = 1
gpgcheck = 1
gpgkey = https://repos.influxdata.com/influxdb.key
Finally, add the Grafana repository in file /etc/yum.repos.d/grafana.repo
[grafana]
name=grafana
baseurl=https://packages.grafana.com/oss/rpm
repo_gpgcheck=1
enabled=1
gpgcheck=1
gpgkey=https://packages.grafana.com/gpg.key
sslverify=1
sslcacert=/etc/pki/tls/certs/ca-bundle.crt
STEP 2) Install collectd.
The installation of collectd proceeds the InfluxDB, because the type file is part of collectd installation.
dnf install -y collectd
By default, 5 plugins are loaded (the lines start without #):
.....
LoadPlugin syslog
LoadPlugin cpu
LoadPlugin interface
LoadPlugin load
LoadPlugin memory
.....
To write the gathered data by the plugins above to the database InfluxDB, just uncomment the plugin network and configure the plugin as shown below:
.....
LoadPlugin network
.....
.....
<Plugin network>
      Server "127.0.0.1" "25826"
.....
.....
</Plugin>
.....
The network plugin will write the data using UDP and the protocol supported by the InfluxDB, which will be configured to listen on port 25826.
Enable and start the collectd daemon.
[root@srv ~]# systemctl enable collectd
Created symlink /etc/systemd/system/multi-user.target.wants/collectd.service → /usr/lib/systemd/system/collectd.service.
[root@srv ~]# systemctl start collectd
[root@srv ~]# systemctl status collectd
● collectd.service - Collectd statistics daemon
     Loaded: loaded (/usr/lib/systemd/system/collectd.service; enabled; vendor preset: disabled)
     Active: active (running) since Tue 2022-10-17 08:17:59 UTC; 57s ago
       Docs: man:collectd(1)
             man:collectd.conf(5)
   Main PID: 11196 (collectd)
      Tasks: 11 (limit: 23042)
     Memory: 1.0M
        CPU: 14ms
     CGroup: /system.slice/collectd.service
             └─11196 /usr/sbin/collectd

Oct 17 08:17:59 srv systemd[1]: Starting Collectd statistics daemon...
Oct 17 08:17:59 srv collectd[11196]: plugin_load: plugin "syslog" successfully loaded.
Oct 17 08:17:59 srv collectd[11196]: plugin_load: plugin "cpu" successfully loaded.
Oct 17 08:17:59 srv collectd[11196]: plugin_load: plugin "interface" successfully loaded.
Oct 17 08:17:59 srv collectd[11196]: plugin_load: plugin "load" successfully loaded.
Oct 17 08:17:59 srv collectd[11196]: plugin_load: plugin "memory" successfully loaded.
Oct 17 08:17:59 srv collectd[11196]: plugin_load: plugin "network" successfully loaded.
Oct 17 08:17:59 srv collectd[11196]: Systemd detected, trying to signal readiness.
Oct 17 08:17:59 srv systemd[1]: Started Collectd statistics daemon.
Oct 17 08:17:59 srv collectd[11196]: Initialization complete, entering read-loop.
STEP 3) Install, configure and start InfluxDB.
First, install InfluxDB – the time series database back-end for this monitoring solution:
dnf install -y influxdb
It will install InfluxDB 1.8. The main configuration file is /etc/influxdb/influxdb.conf.
Enable the collectd configuration by uncommenting the following lines (in /etc/influxdb/influxdb.conf), only typesdb = “/usr/share/collectd/types.db” is with modified path to the type.db file.
.....
[[collectd]]
  enabled = true
  bind-address = ":25826"
  database = "collectd"
  typesdb = "/usr/share/collectd/types.db"
.....
The InfluxDB will listen on port 25826 for UDP packets. This is the simplest setup without any security. The port 25826 should be open in the firewall per IP for each server.
Now, start the service:
[root@srv ~]# systemctl start influxdb
[root@srv ~]# systemctl status influxdb
● influxdb.service - InfluxDB is an open-source, distributed, time series database
     Loaded: loaded (/usr/lib/systemd/system/influxdb.service; enabled; vendor preset: disabled)
    Drop-In: /run/systemd/system/service.d
             └─zzz-lxc-service.conf
     Active: active (running) since Sun 2022-10-16 16:39:02 UTC; 2s ago
       Docs: https://docs.influxdata.com/influxdb/
    Process: 932 ExecStart=/usr/lib/influxdb/scripts/influxd-systemd-start.sh (code=exited, status=0/SUCCESS)
   Main PID: 933 (influxd)
      Tasks: 18 (limit: 203034)
     Memory: 70.3M
        CPU: 112ms
     CGroup: /system.slice/influxdb.service
             └─933 /usr/bin/influxd -config /etc/influxdb/influxdb.conf

Oct 16 16:39:01 srv influxd-systemd-start.sh[933]: ts=2022-10-16T16:39:01.991849Z lvl=info msg="Starting HTTP service" log_id=0d_QSZml000 service=httpd authentication=false
Oct 16 16:39:01 srv influxd-systemd-start.sh[933]: ts=2022-10-16T16:39:01.991855Z lvl=info msg="opened HTTP access log" log_id=0d_QSZml000 service=httpd path=stderr
Oct 16 16:39:01 srv influxd-systemd-start.sh[933]: ts=2022-10-16T16:39:01.991901Z lvl=info msg="Storing statistics" log_id=0d_QSZml000 service=monitor db_instance=_internal db_rp=monitor interval=10s
Oct 16 16:39:01 srv influxd-systemd-start.sh[933]: ts=2022-10-16T16:39:01.992057Z lvl=info msg="Listening on HTTP" log_id=0d_QSZml000 service=httpd addr=[::]:8086 https=false
Oct 16 16:39:01 srv influxd-systemd-start.sh[933]: ts=2022-10-16T16:39:01.992076Z lvl=info msg="Starting retention policy enforcement service" log_id=0d_QSZml000 service=retention check_interval=30m
Oct 16 16:39:01 srv influxd-systemd-start.sh[933]: ts=2022-10-16T16:39:01.992109Z lvl=info msg="Listening for signals" log_id=0d_QSZml000
Oct 16 16:39:01 srv influxd-systemd-start.sh[933]: ts=2022-10-16T16:39:01.992145Z lvl=info msg="Sending usage statistics to usage.influxdata.com" log_id=0d_QSZml000
Oct 16 16:39:02 srv influxd-systemd-start.sh[933]: [httpd] ::1 - - [16/Oct/2022:16:39:02 +0000] "GET /health HTTP/1.1" 200 107 "-" "curl/7.76.1" 0af597bf-4d71-11ed-8001-00163e4f6164 127
Oct 16 16:39:02 srv influxd-systemd-start.sh[932]: InfluxDB started
Oct 16 16:39:02 srv systemd[1]: Started InfluxDB is an open-source, distributed, time series database.
And the InfluxDB is accepting the UDP packets sent from the collectd daemon. Then the data is saved in time series tables in database name “collectd“.
Create the admin user with all privilege and then enable basic authentication, at least. By default, the authentication is disabled, so using just the CLI tool to create a new user. Add ordinary user with the name collectd to have read access to the collectd database. The collectd user will be used to access the collectd database from Grafana.
[root@srv ~]# influx
Connected to http://localhost:8086 version 1.8.10
InfluxDB shell version: 1.8.10
> CREATE USER admin WITH PASSWORD 'eeFiN0ieng_ahcohseig' WITH ALL PRIVILEGES
> SHOW USERS
user  admin
----  -----
admin true
> CREATE USER collectd WITH PASSWORD 'oiQuahthoh+Gu1ohwiej'
> GRANT READ ON "collectd" TO "collectd"
> SHOW USERS
user     admin
----     -----
admin    true
collectd false
>
There is one user with username admin after the CREATE statement.
Then, change the auth-enabled in section “[http]” to true and three more options to true in the InfluxDB configuration file /etc/influxdb/influxdb.conf:
.....
[http]
.....
.....
  auth-enabled = true
.....
  pprof-enabled = true
.....
  pprof-auth-enabled = true
.....
  ping-auth-enabled = true
.....
.....
And restart the InfluxDB server:
systemctl restart influxdb
STEP 4) Install and configure the web server Nginx.
The Nginx web server is used as an HTTPS proxy in front of the Grafana front-end HTTP.
dnf install -y nginx
Start the Nginx web server with the default configuration. Enable the Nginx service on boot:
[root@srv ~]# systemctl start nginx
[root@srv ~]# systemctl enable nginx
Created symlink /etc/systemd/system/multi-user.target.wants/nginx.service → /usr/lib/systemd/system/nginx.service.
Add HTTP and HTTPS rules to accept incoming connections to the firewall. Do not forget to add the servers’ IPs and ports, which should report to InfluxDB. On remote servers, the collectd daemon will use UDP to send data to the InfluxDB on port 25826, which should be open for them. Replace 192.168.0.100 with the real IP.
[root@srv ~]# firewall-cmd --permanent --add-service=http
success
[root@srv ~]# firewall-cmd --permanent --add-service=https
success
[root@srv ~]# firewall-cmd --permanent --zone=public --add-rich-rule="rule family="ipv4" source address="192.168.0.100" port protocol="udp" port="25826" accept"
success
[root@srv ~]# firewall-cmd --reload
success
[root@srv ~]# firewall-cmd --list-all
public (active)
  target: default
  icmp-block-inversion: no
  interfaces: br0 eno1
  sources:
  services: cockpit dhcpv6-client http https ssh
  ports: 10022/tcp
  protocols:
  forward: yes
  masquerade: yes
  forward-ports:
  source-ports:
  icmp-blocks:
  rich rules:
Install certbot to issue letsencrypt certificate:
dnf install -y certbot
Request a new certificate:
[root@srv ~]# certbot certonly --webroot -w /usr/share/nginx/html/ -d grafana.ahelpme.com
Saving debug log to /var/log/letsencrypt/letsencrypt.log
Requesting a certificate for grafana.ahelpme.com

Successfully received certificate.
Certificate is saved at: /etc/letsencrypt/live/grafana.ahelpme.com/fullchain.pem
Key is saved at:         /etc/letsencrypt/live/grafana.ahelpme.com/privkey.pem
This certificate expires on 2023-01-14.
These files will be updated when the certificate renews.
Certbot has set up a scheduled task to automatically renew this certificate in the background.

- - - - - - - - - - - - - - - - - - - - - - - - - - - - - - - - - - - - - - - -
If you like Certbot, please consider supporting our work by:
 * Donating to ISRG / Let's Encrypt:   https://letsencrypt.org/donate
 * Donating to EFF:                    https://eff.org/donate-le
- - - - - - - - - - - - - - - - - - - - - - - - - - - - - - - - - - - - - - - -
Configure the Nginx server to proxy HTTPS requests to the Grafana web port. Add the following in the http {} sector in /etc/nginx/nginx.conf:
      server {
              listen          443 ssl http2;

              server_name     grafana.ahelpme.com;

              ssl_certificate  /etc/letsencrypt/live/grafana.ahelpme.com/fullchain.pem;
              ssl_certificate_key /etc/letsencrypt/live/grafana.ahelpme.com/privkey.pem;

              access_log      /var/log/nginx/grafana.ahelpme.com.log;
              error_log       /var/log/nginx/grafana.ahelpme.error.log warn;

              root /usr/share/nginx/html;

              location / {
                      proxy_buffer_size   128k;
                      proxy_buffers   4 256k;
                      proxy_busy_buffers_size   256k;
                      proxy_buffering off;
                      proxy_read_timeout 600;
                      proxy_send_timeout 600;
                      proxy_store off;
                      proxy_cache off;
                      proxy_redirect off;

                      proxy_pass http://127.0.0.1:3000;
                      proxy_set_header Host $host;
                      proxy_set_header X-Real-IP $remote_addr;
                      proxy_set_header X-Forwarded-For $proxy_add_x_forwarded_for;
              }
      }
Restart the Nginx to load the new configuration:
[root@srv ~]# systemctl restart nginx
[root@srv ~]# systemctl status nginx
● nginx.service - The nginx HTTP and reverse proxy server
     Loaded: loaded (/usr/lib/systemd/system/nginx.service; enabled; vendor preset: disabled)
    Drop-In: /usr/lib/systemd/system/nginx.service.d
             └─php-fpm.conf
     Active: active (running) since Mon 2022-10-17 02:41:20 CEST; 2min 59s ago
    Process: 12885 ExecStartPre=/usr/bin/rm -f /run/nginx.pid (code=exited, status=0/SUCCESS)
    Process: 12886 ExecStartPre=/usr/sbin/nginx -t (code=exited, status=0/SUCCESS)
    Process: 12887 ExecStart=/usr/sbin/nginx (code=exited, status=0/SUCCESS)
   Main PID: 12888 (nginx)
      Tasks: 9 (limit: 203034)
     Memory: 9.2M
        CPU: 34ms
     CGroup: /system.slice/nginx.service
             ├─12888 "nginx: master process /usr/sbin/nginx"
             ├─12889 "nginx: worker process"
             ├─12890 "nginx: worker process"
             ├─12891 "nginx: worker process"
             ├─12892 "nginx: worker process"
             ├─12893 "nginx: worker process"
             ├─12894 "nginx: worker process"
             ├─12895 "nginx: worker process"
             └─12896 "nginx: worker process"

Oct 17 02:41:20 srv systemd[1]: Starting The nginx HTTP and reverse proxy server...
Oct 17 02:41:20 srv nginx[12886]: nginx: the configuration file /etc/nginx/nginx.conf syntax is ok
STEP 5) Install and configure Grafana.
Now, to install Grafana successfully the user should allow DNF to use SHA1 to check the GPG key or an error will be returned:
[root@srv ~]# dnf install -y crypto-policies-scripts
Last metadata expiration check: 0:17:30 ago on Mon Oct 17 00:34:17 2022.
Dependencies resolved.
==============================================================================================================
 Package                          Architecture    Version                               Repository       Size
==============================================================================================================
Installing:
 crypto-policies-scripts          noarch          20220815-1.git0fbe86f.el9             baseos           93 k

Transaction Summary
==============================================================================================================
Install  1 Package

Total download size: 93 k
Installed size: 224 k
Downloading Packages:
crypto-policies-scripts-20220815-1.git0fbe86f.el9.noarch.rpm                  681 kB/s |  93 kB     00:00
--------------------------------------------------------------------------------------------------------------
Total                                                                         140 kB/s |  93 kB     00:00
Running transaction check
Transaction check succeeded.
Running transaction test
Transaction test succeeded.
Running transaction
  Preparing        :                                                                                      1/1
  Installing       : crypto-policies-scripts-20220815-1.git0fbe86f.el9.noarch                             1/1
  Running scriptlet: crypto-policies-scripts-20220815-1.git0fbe86f.el9.noarch                             1/1
  Verifying        : crypto-policies-scripts-20220815-1.git0fbe86f.el9.noarch                             1/1

Installed:
  crypto-policies-scripts-20220815-1.git0fbe86f.el9.noarch

Complete!
[root@srv ~]# update-crypto-policies --set DEFAULT:SHA1
Setting system policy to DEFAULT:SHA1
Note: System-wide crypto policies are applied on application start-up.
It is recommended to restart the system for the change of policies
to fully take place.
[root@srv ~]# dnf install -y grafana
Last metadata expiration check: 0:18:40 ago on Mon Oct 17 00:34:17 2022.
Dependencies resolved.
==============================================================================================================
 Package                                      Architecture   Version                  Repository         Size
==============================================================================================================
Installing:
 grafana                                      x86_64         9.2.0-1                  grafana            91 M
Installing dependencies:
 dejavu-sans-fonts                            noarch         2.37-18.el9              baseos            1.3 M
 fontconfig                                   x86_64         2.14.0-1.el9             appstream         297 k
 fonts-filesystem                             noarch         1:2.0.5-7.el9.1          baseos             10 k
 freetype                                     x86_64         2.10.4-9.el9             baseos            388 k
 graphite2                                    x86_64         1.3.14-9.el9             baseos             95 k
 harfbuzz                                     x86_64         2.7.4-8.el9              baseos            625 k
 langpacks-core-font-en                       noarch         3.0-16.el9               appstream          11 k
 libpng                                       x86_64         2:1.6.37-12.el9          baseos            117 k
 urw-base35-bookman-fonts                     noarch         20200910-6.el9           appstream         847 k
 urw-base35-c059-fonts                        noarch         20200910-6.el9           appstream         875 k
 urw-base35-d050000l-fonts                    noarch         20200910-6.el9           appstream          77 k
 urw-base35-fonts                             noarch         20200910-6.el9           appstream          11 k
 urw-base35-fonts-common                      noarch         20200910-6.el9           appstream          22 k
 urw-base35-gothic-fonts                      noarch         20200910-6.el9           appstream         643 k
 urw-base35-nimbus-mono-ps-fonts              noarch         20200910-6.el9           appstream         796 k
 urw-base35-nimbus-roman-fonts                noarch         20200910-6.el9           appstream         856 k
 urw-base35-nimbus-sans-fonts                 noarch         20200910-6.el9           appstream         1.3 M
 urw-base35-p052-fonts                        noarch         20200910-6.el9           appstream         974 k
 urw-base35-standard-symbols-ps-fonts         noarch         20200910-6.el9           appstream          42 k
 urw-base35-z003-fonts                        noarch         20200910-6.el9           appstream         276 k
 xml-common                                   noarch         0.6.3-58.el9             appstream          32 k

Transaction Summary
==============================================================================================================
Install  22 Packages

Total download size: 101 M
Installed size: 327 M
Downloading Packages:
(1/22): fonts-filesystem-2.0.5-7.el9.1.noarch.rpm                             149 kB/s |  10 kB     00:00
.....
.....
(22/22): grafana-9.2.0-1.x86_64.rpm                                            48 MB/s |  91 MB     00:01
--------------------------------------------------------------------------------------------------------------
Total                                                                          27 MB/s | 101 MB     00:03
grafana                                                                        20 kB/s | 1.7 kB     00:00
Importing GPG key 0x24098CB6:
 Userid     : "Grafana <info@grafana.com>"
 Fingerprint: 4E40 DDF6 D76E 284A 4A67 80E4 8C8C 34C5 2409 8CB6
 From       : https://packages.grafana.com/gpg.key
Key imported successfully
Running transaction check
Transaction check succeeded.
Running transaction test
Transaction test succeeded.
Running transaction
  Preparing        :                                                                                      1/1
  Installing       : fonts-filesystem-1:2.0.5-7.el9.1.noarch                                             1/22
.....
.....
  xml-common-0.6.3-58.el9.noarch

Complete!
[root@srv ~]# ls -al /etc/grafana/
total 68
drwxr-xr-x.  3 root root     4096 Oct 17 00:53 .
drwxr-xr-x. 70 root root     4096 Oct 17 00:53 ..
-rw-r-----.  1 root grafana 49506 Oct 17 00:53 grafana.ini
-rw-r-----.  1 root grafana  2376 Oct 17 00:53 ldap.toml
drwxr-xr-x.  8 root grafana  4096 Oct 17 00:53 provisioning
The main configuration file is /etc/grafana/grafana.ini. No additional configuration is required for now except for just one option in section “[server]”, the domain uncomment it and add the domain grafana.ahelpme.com:
.....
[server]
.....
.....
domain = grafana.ahelpme.com
.....
.....
Enable the service on boot and start it:
[root@srv ~]# systemctl daemon-reload
[root@srv ~]# systemctl enable grafana-server
Synchronizing state of grafana-server.service with SysV service script with /usr/lib/systemd/systemd-sysv-install.
Executing: /usr/lib/systemd/systemd-sysv-install enable grafana-server
Created symlink /etc/systemd/system/multi-user.target.wants/grafana-server.service → /usr/lib/systemd/system/grafana-server.service.
[root@srv ~]# systemctl start grafana-server
[root@srv ~]# systemctl status grafana-server
● grafana-server.service - Grafana instance
     Loaded: loaded (/usr/lib/systemd/system/grafana-server.service; enabled; vendor preset: disabled)
    Drop-In: /run/systemd/system/service.d
             └─zzz-lxc-service.conf
     Active: active (running) since Mon 2022-10-17 01:06:38 UTC; 5s ago
       Docs: http://docs.grafana.org
   Main PID: 4184 (grafana-server)
      Tasks: 17 (limit: 203034)
     Memory: 48.5M
        CPU: 759ms
     CGroup: /system.slice/grafana-server.service
             └─4184 /usr/sbin/grafana-server --config=/etc/grafana/grafana.ini --pidfile=/var/run/grafana/grafana-server.pid --packaging=rpm cfg:default.paths.logs=/var/log/grafana cfg:default.paths.data=/var/lib/grafana cfg:default.paths.plugins=/var/lib/grafana/plugins cfg:default.paths.provisioning=/etc/grafana/provisioning

Oct 17 01:06:38 srv grafana-server[4184]: logger=infra.usagestats.collector t=2022-10-17T01:06:38.60482092Z level=info msg="registering usage stat providers" usageStatsProvidersLen=2
Oct 17 01:06:38 srv grafana-server[4184]: logger=server t=2022-10-17T01:06:38.604996029Z level=info msg="Writing PID file" path=/var/run/grafana/grafana-server.pid pid=4184
Oct 17 01:06:38 srv grafana-server[4184]: logger=provisioning.alerting t=2022-10-17T01:06:38.605623305Z level=info msg="starting to provision alerting"
Oct 17 01:06:38 srv grafana-server[4184]: logger=provisioning.alerting t=2022-10-17T01:06:38.60566092Z level=info msg="finished to provision alerting"
Oct 17 01:06:38 srv grafana-server[4184]: logger=grafanaStorageLogger t=2022-10-17T01:06:38.605812478Z level=info msg="storage starting"
Oct 17 01:06:38 srv systemd[1]: Started Grafana instance.
Oct 17 01:06:38 srv grafana-server[4184]: logger=ngalert t=2022-10-17T01:06:38.607070728Z level=info msg="warming cache for startup"
Oct 17 01:06:38 srv grafana-server[4184]: logger=http.server t=2022-10-17T01:06:38.608968063Z level=info msg="HTTP Server Listen" address=[::]:3000 protocol=http subUrl= socket=
Oct 17 01:06:38 srv grafana-server[4184]: logger=ticker t=2022-10-17T01:06:38.937842666Z level=info msg=starting first_tick=2022-10-17T01:06:40Z
Oct 17 01:06:38 srv grafana-server[4184]: logger=ngalert.multiorg.alertmanager t=2022-10-17T01:06:38.937861565Z level=info msg="starting MultiOrg Alertmanager"
Enable SELinux rule to allow the Web server (Nginx) to make outer network connections with:
setsebool -P httpd_can_network_connect 1
STEP 6) Load the Grafana web interface.
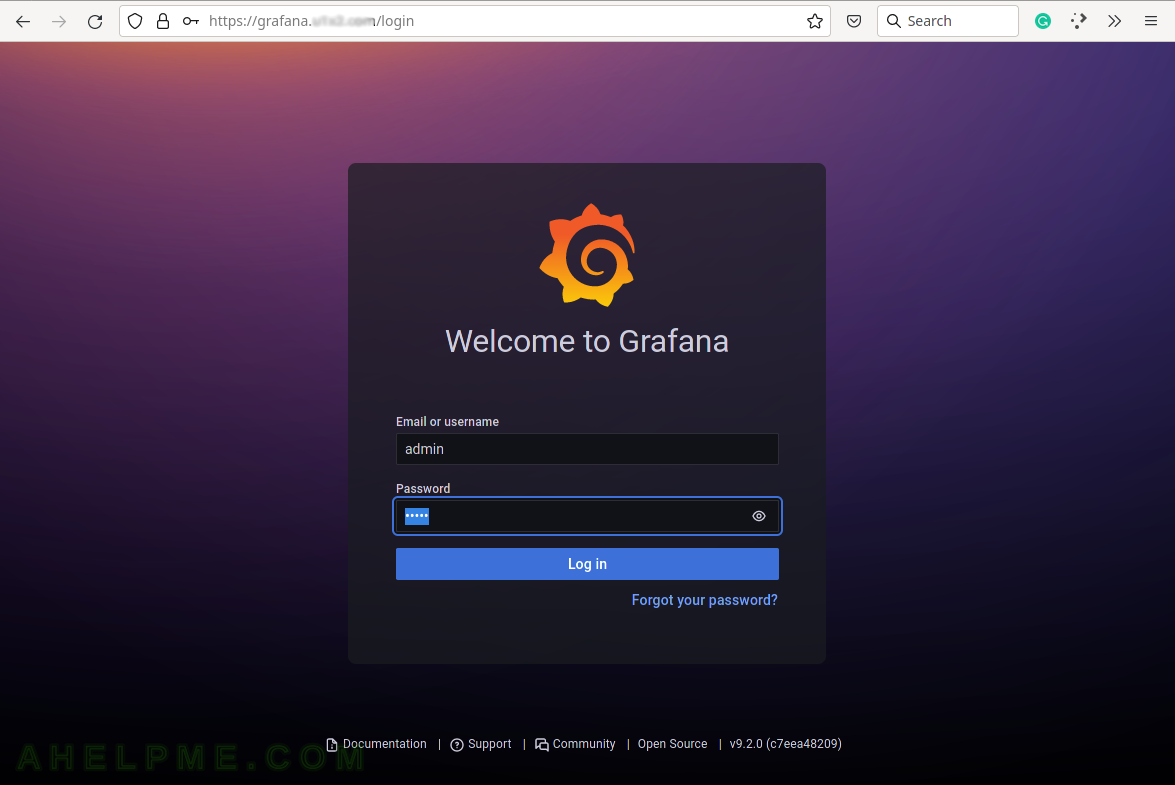
First, change the administrative user password, by opening the web browser and the URL: https://grafana.ahelpme.com and enter the username: admin and password: admin
The following screenshots show the Grafana look and feel and barely scratches what it can do.
SCREENSHOT 1) The first login in Grafana with admin/admin.
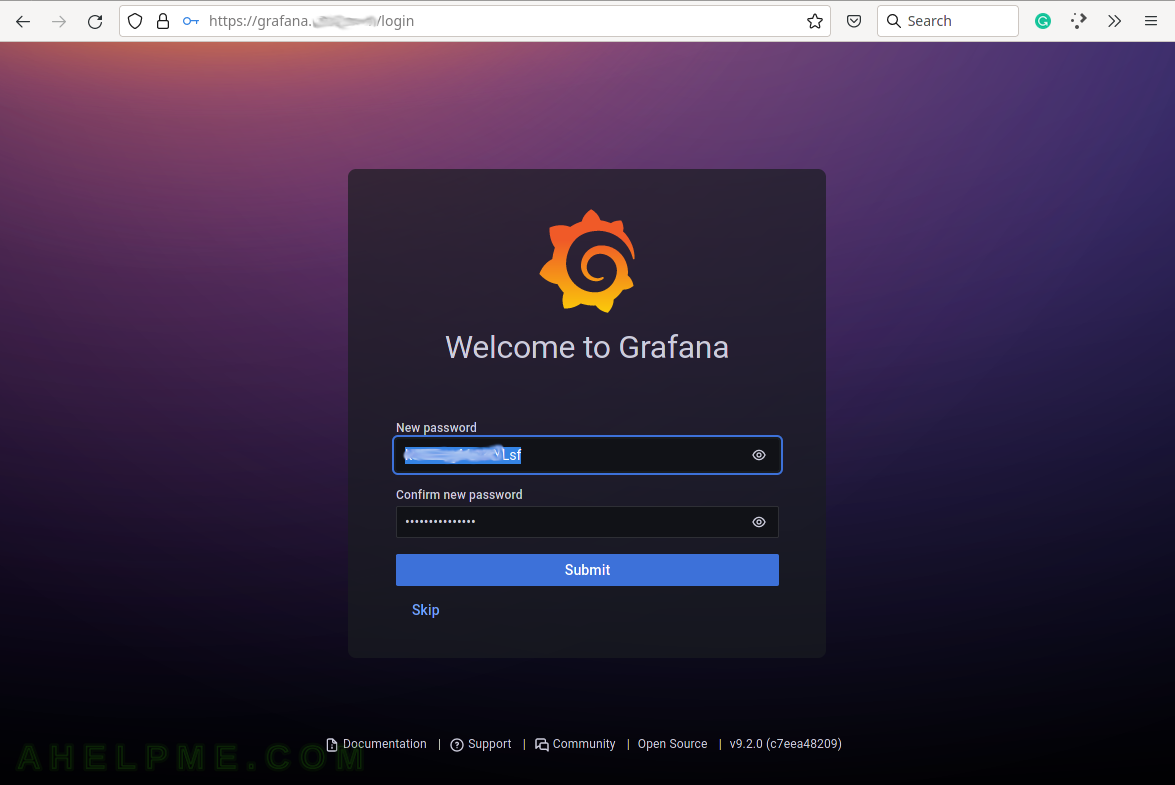
SCREENSHOT 2) On first login with the default password change it to new one.
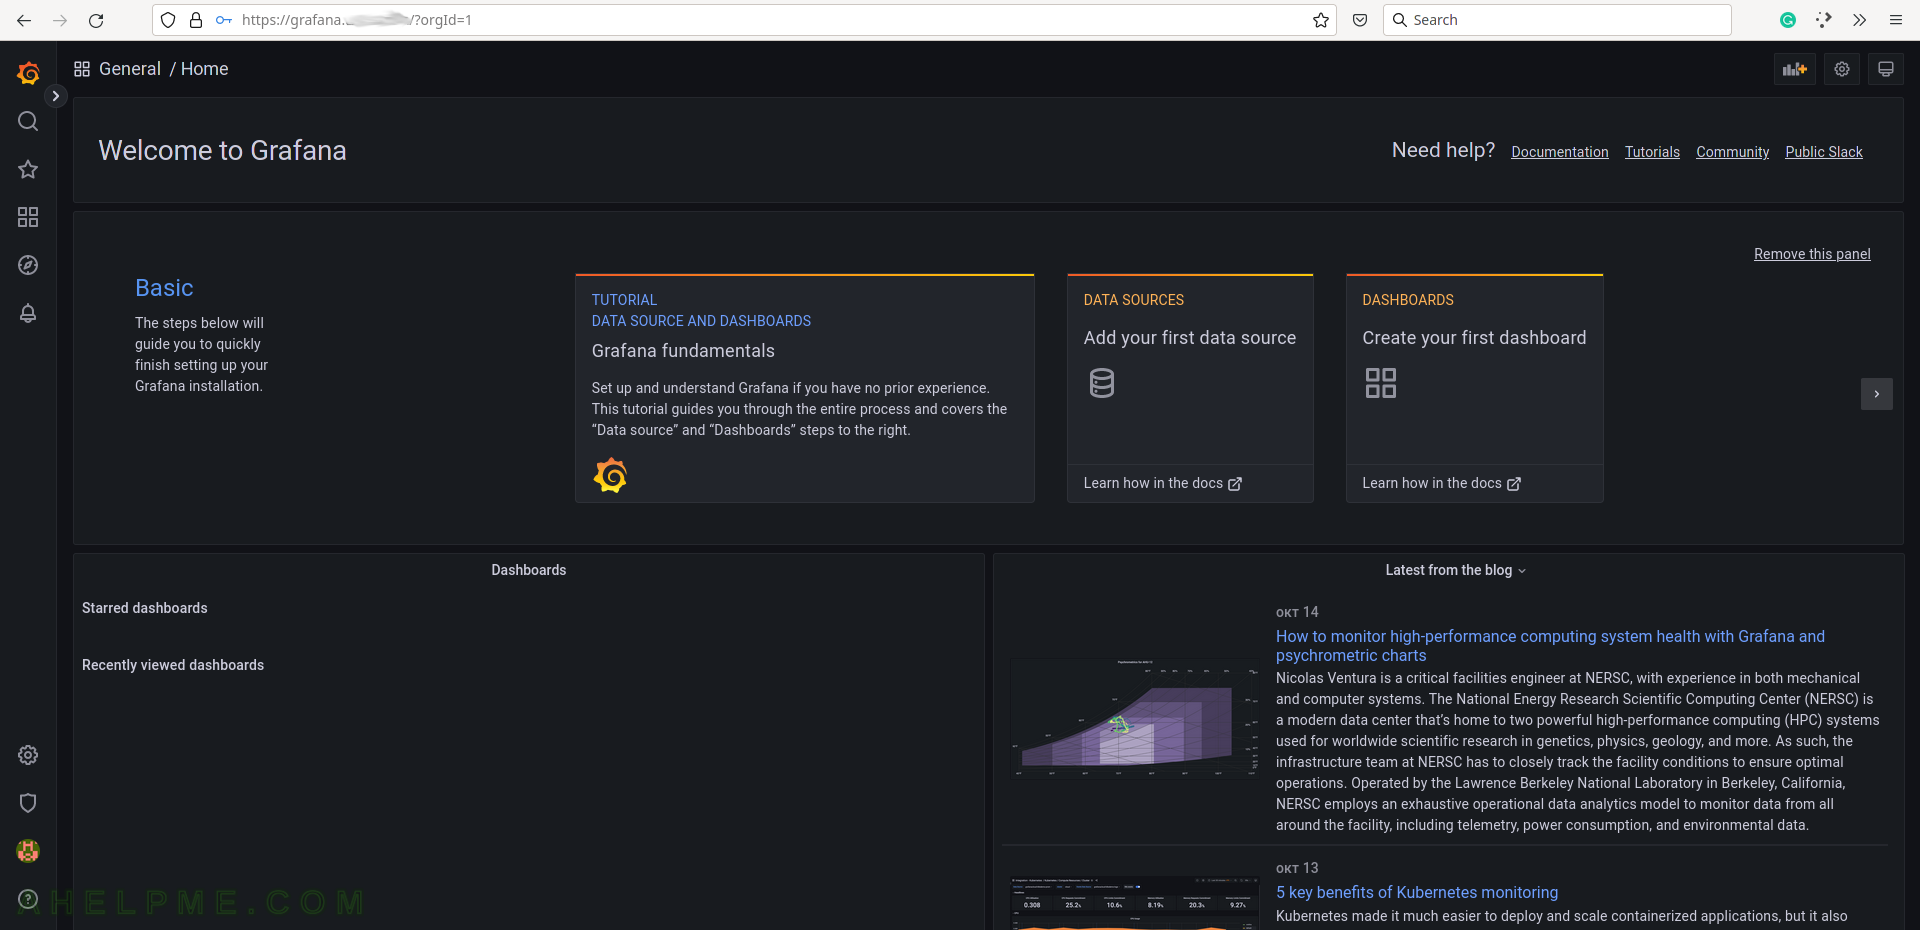
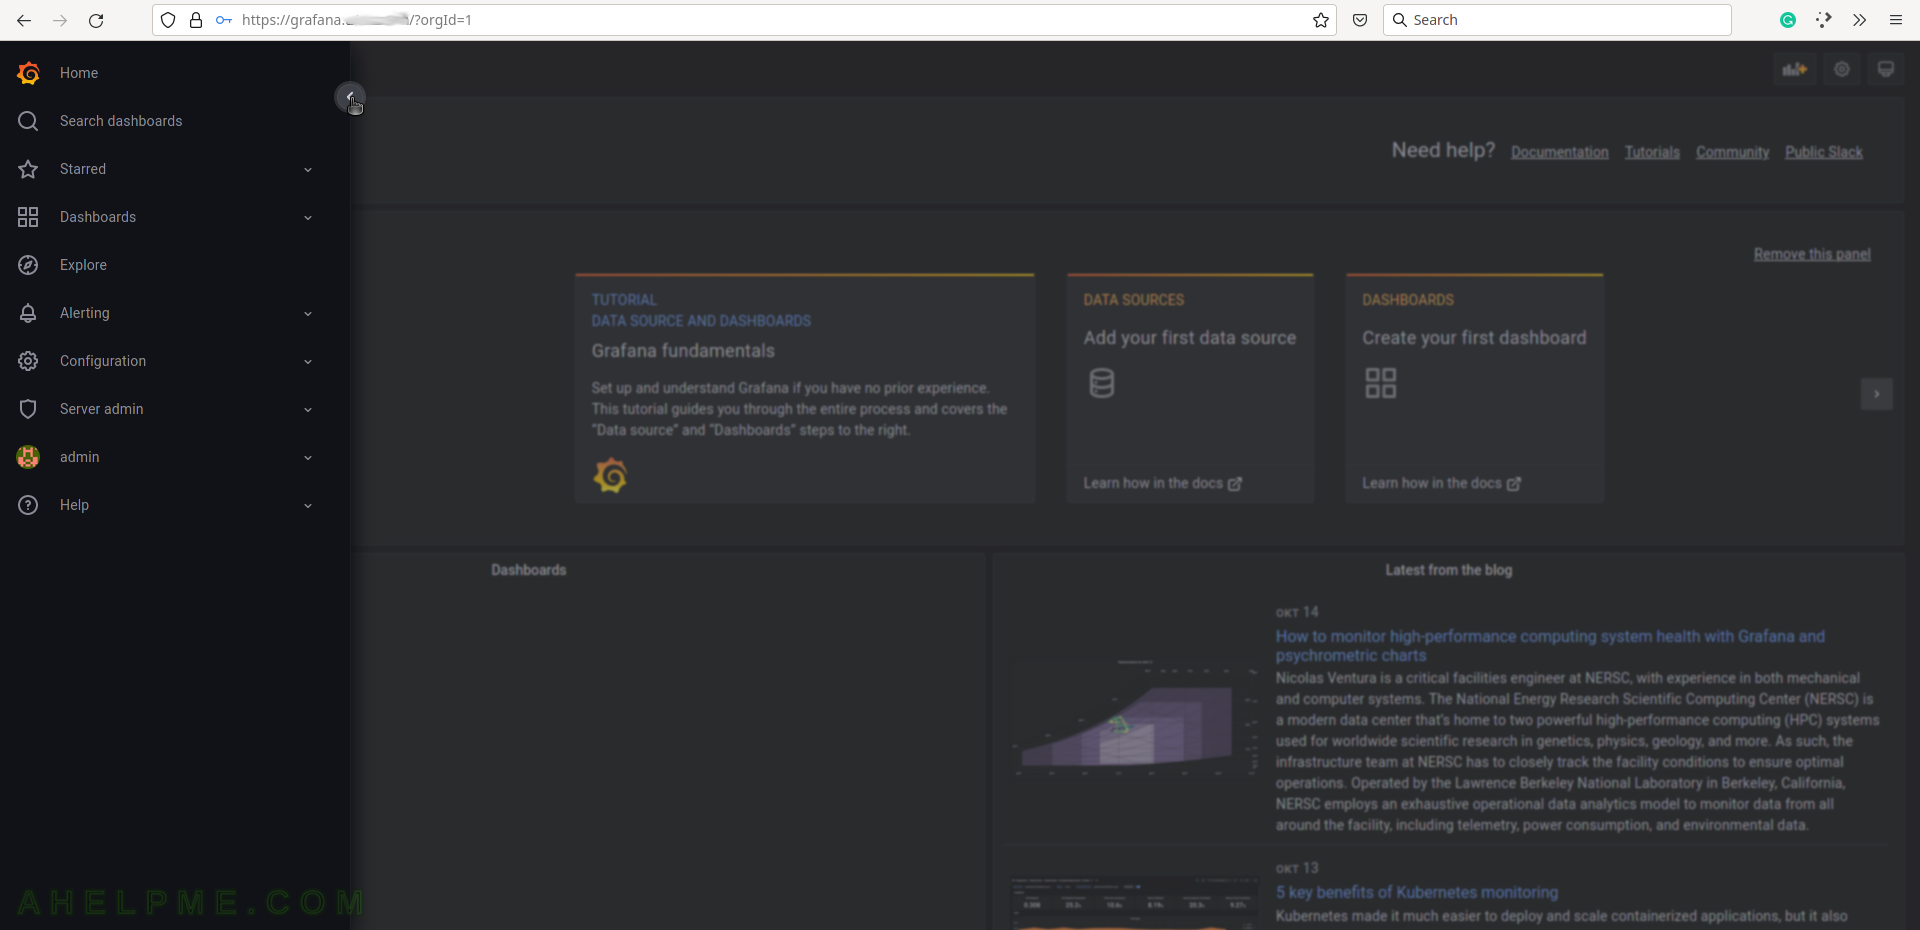
SCREENSHOT 3) The default home page of Grafana.
SCREENSHOT 4) Expand the main menu.
Multiple menus and sub-menus including Home, Search dashboards, Starred, Dashboards, Explore, Alerting, Configuration, Server admin, admin (the logged user) and Help.
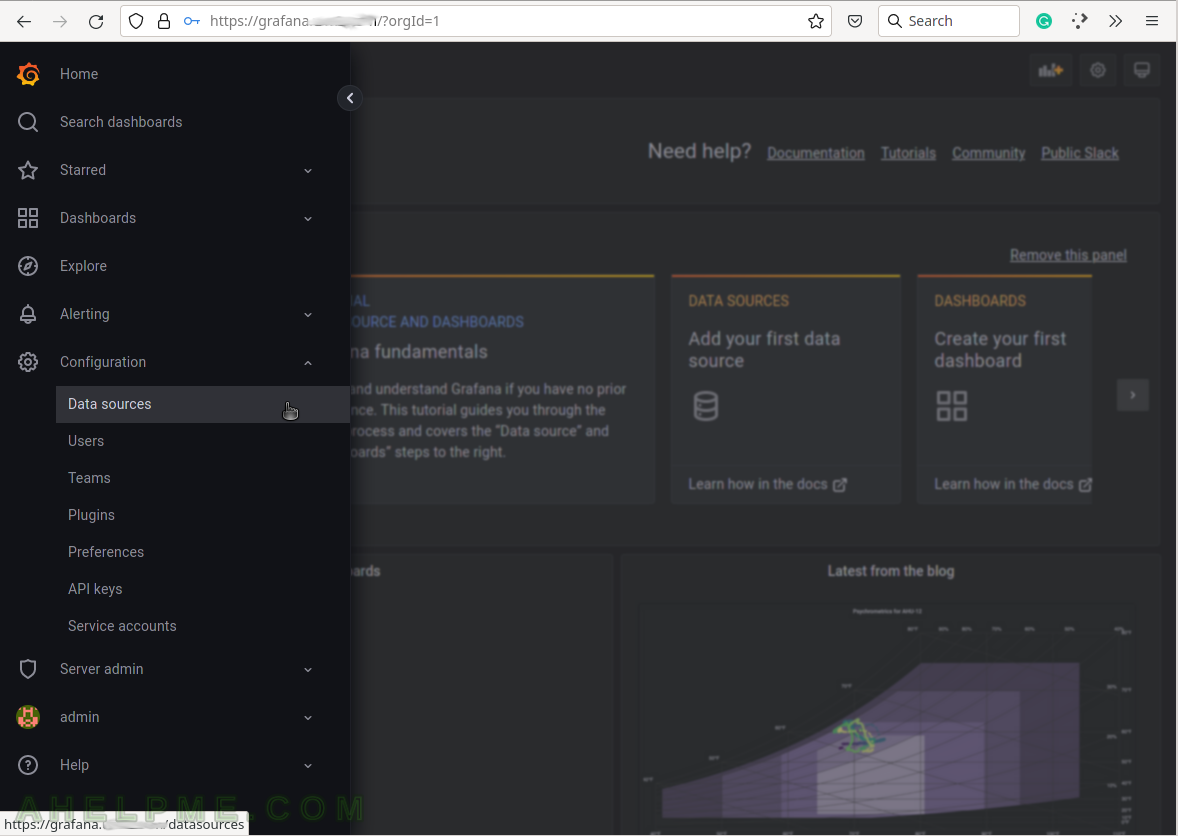
SCREENSHOT 5) Select the Configuration menu and then Data sources to add the database back-end.
Grafana supports multiple back-ends, where the data is stored. Configure a data sources to tell Grafana how to access the data.
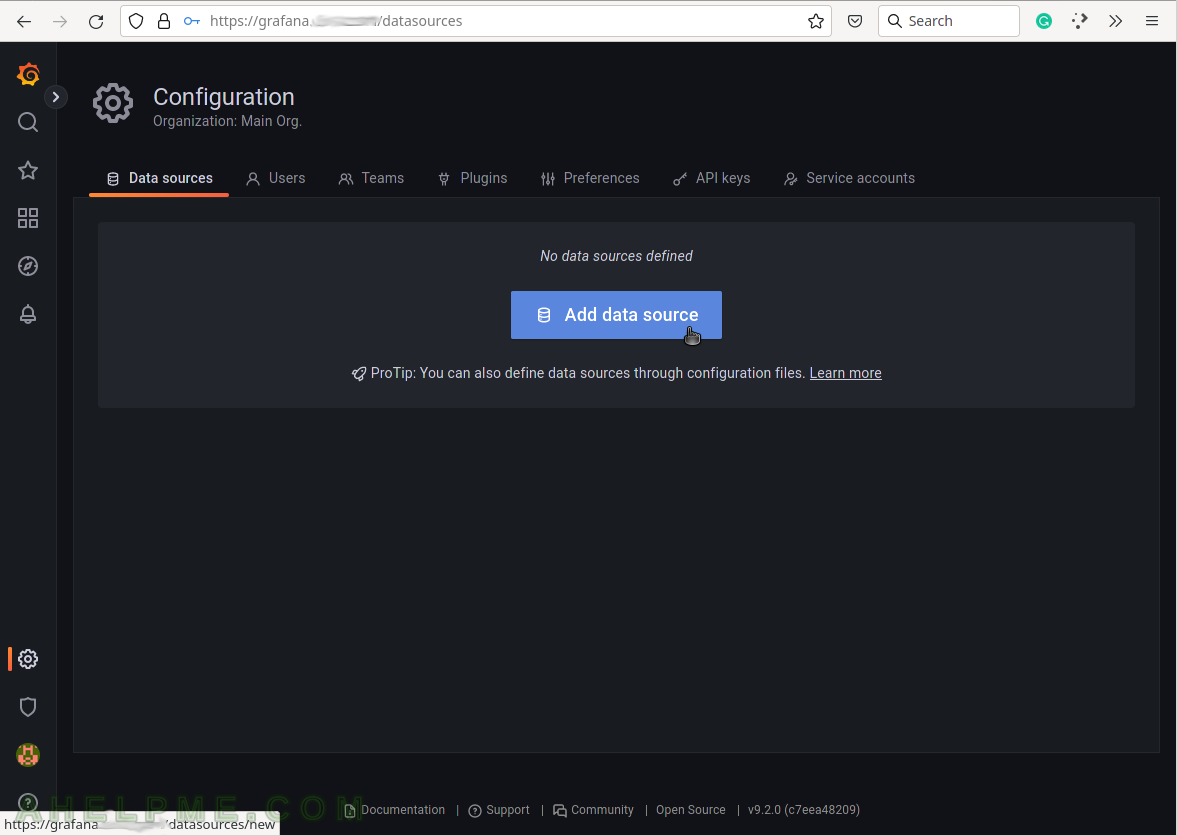
SCREENSHOT 6) To tell Grafana how to access the data use the data sources, which can access it.
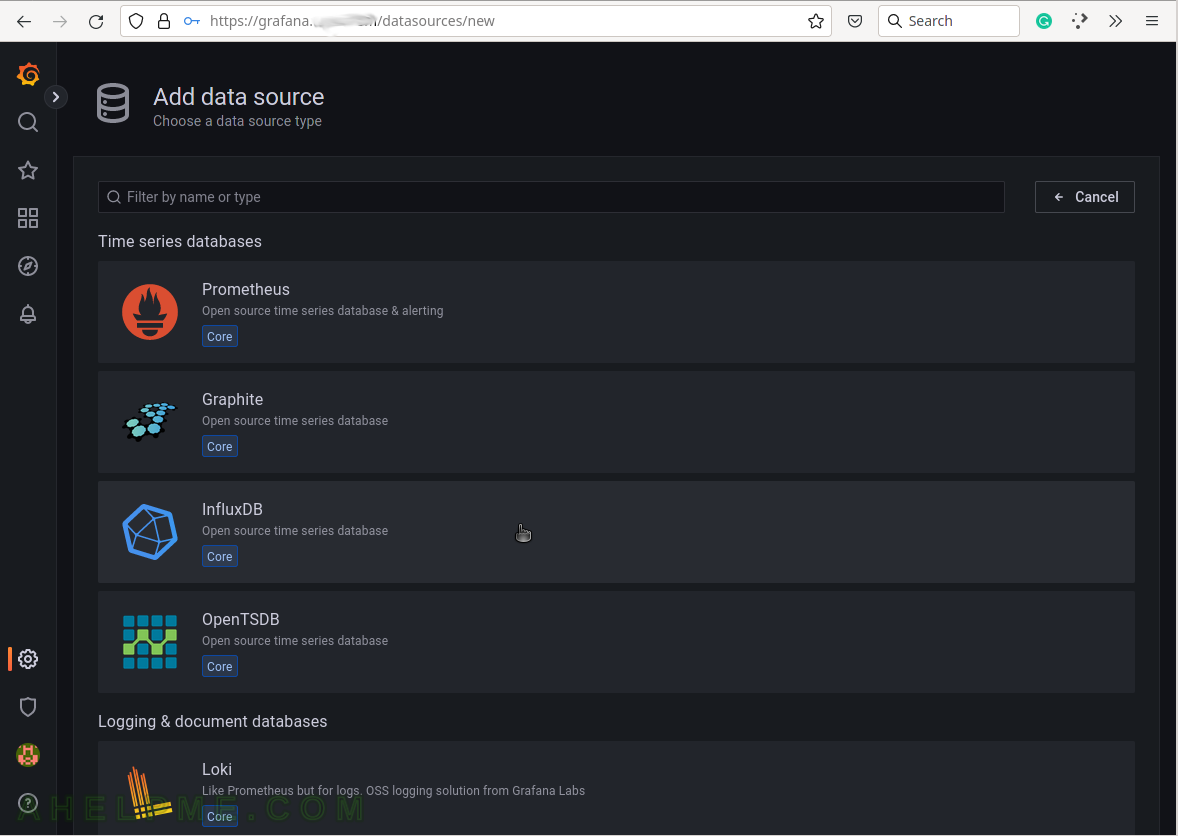
SCREENSHOT 7) Select the InfluxDB line to add and configure an InfluxDB data source.
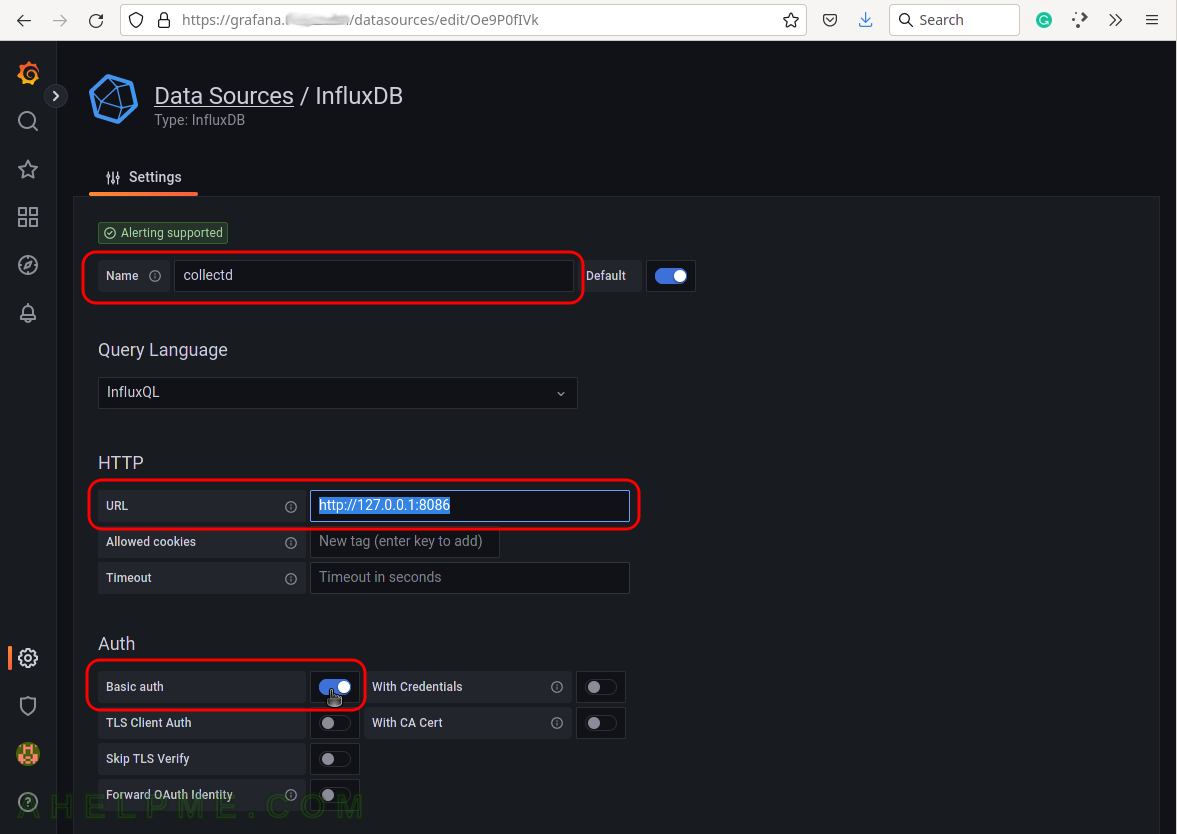
SCREENSHOT 8) Configure how Grafana can access the InfluxDB – URL, database name and authentication.
Set the name of the source to be “collectd“, URL: http://127.0.0.1:8086 (this is the default local URL, if it is remote add the IP of the remote InfluxDB server), and enable the “Basic auth” for basic authentication. Scroll down the page.
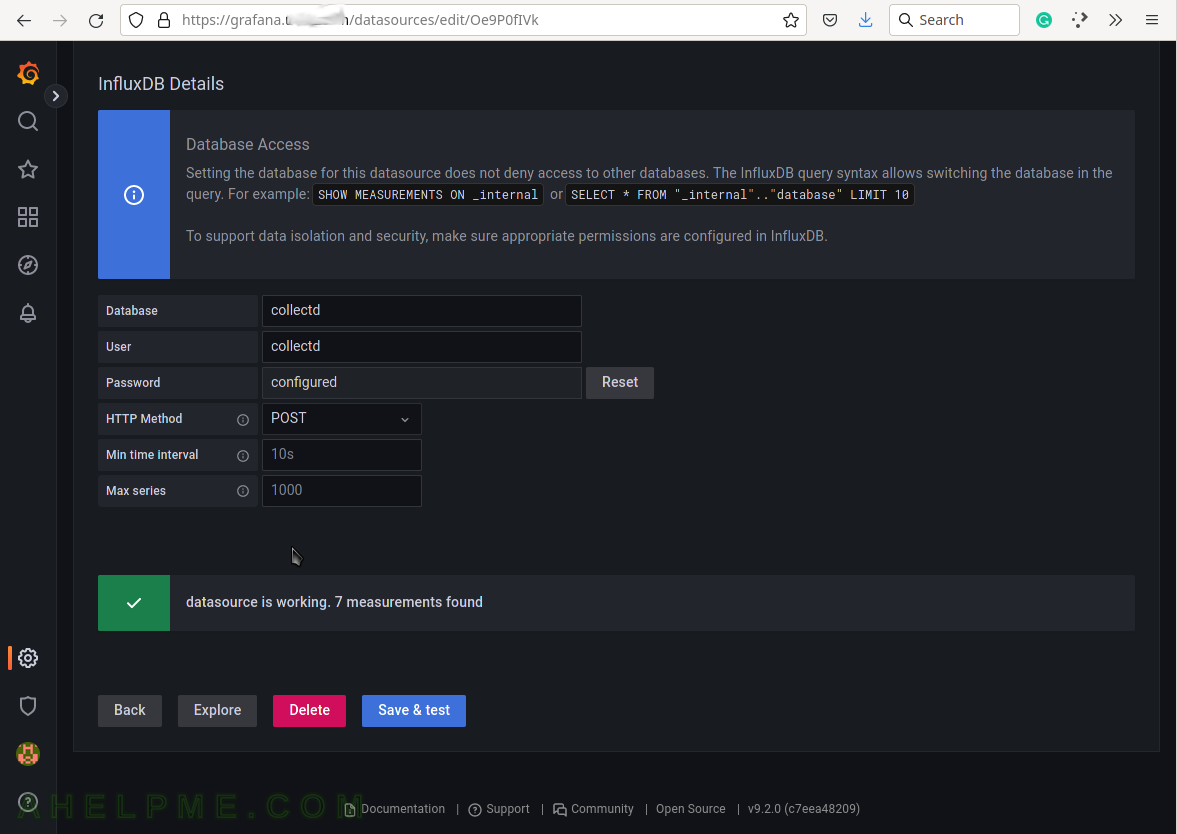
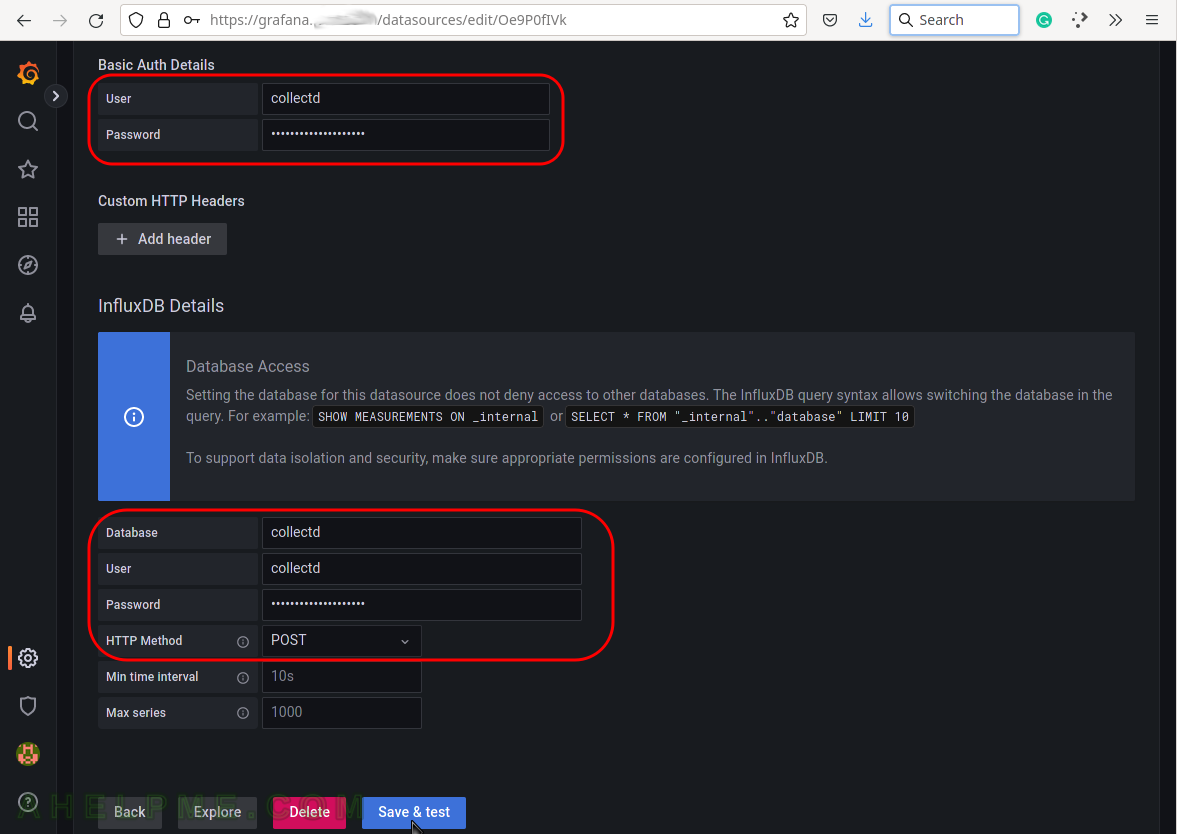
SCREENSHOT 9) Configure the username, password, and database name to access the InfluxDB server.
Fill both sections with the same username and password set during the installation phase above. For database, name fill in “collectd” and change the HTTP Method to “POST“. Finally, click on the button “Save & test” to save the new Data source and test the connection to the database back-end.
SCREENSHOT 10) If the connection to the database is working a green note will be shown above the buttons.
The connection is working and a green note is shown – “datasource is working. 7 measurements found.”