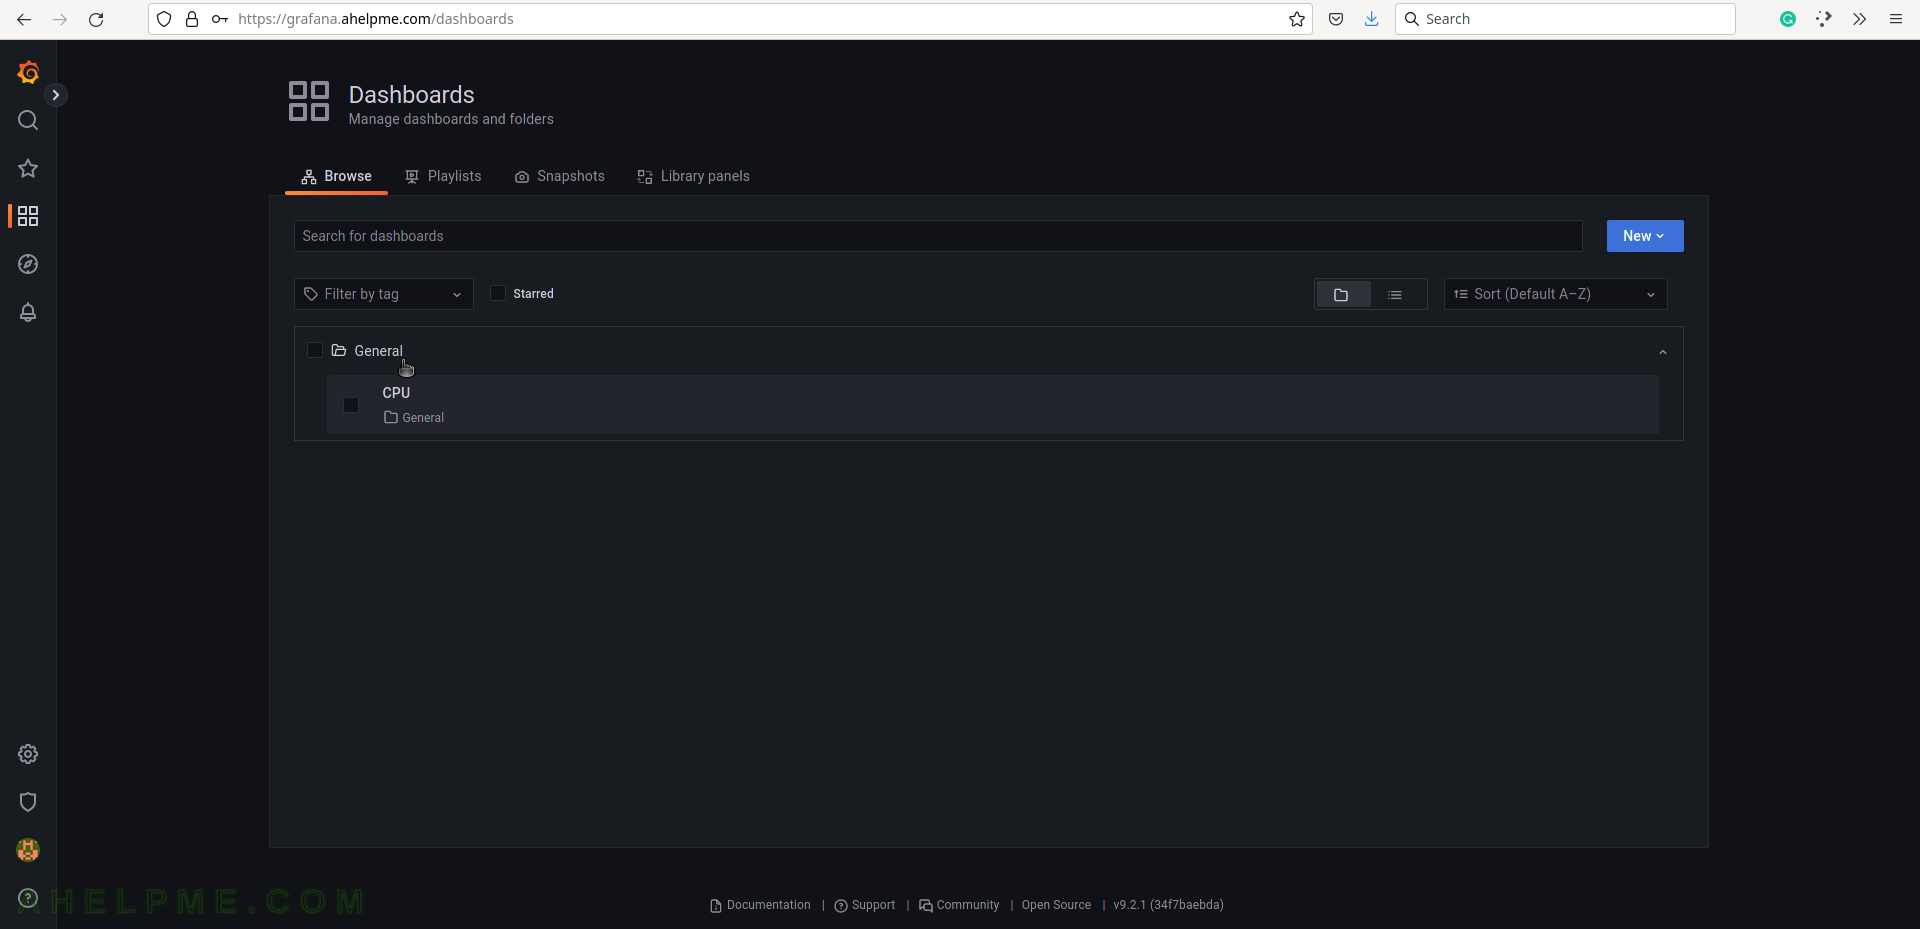
SCREENSHOT 21) Add a new panel, which may contain charts, graphs, tables, counters, lines of data, and more.
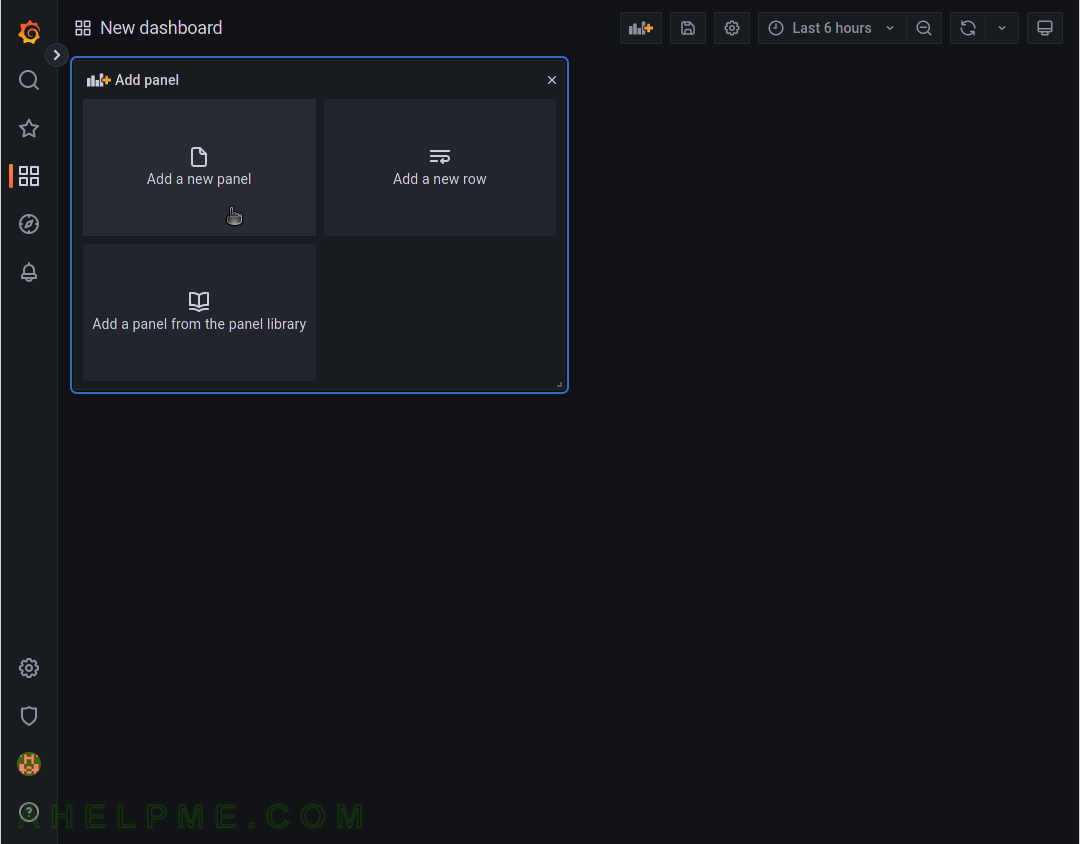
SCREENSHOT 22) A new panel in the new dashboard with CPU idle percentage of a server.
Click on the button “Apply” to apply the changes in the current dashboard and return to the main page of the dashboard.
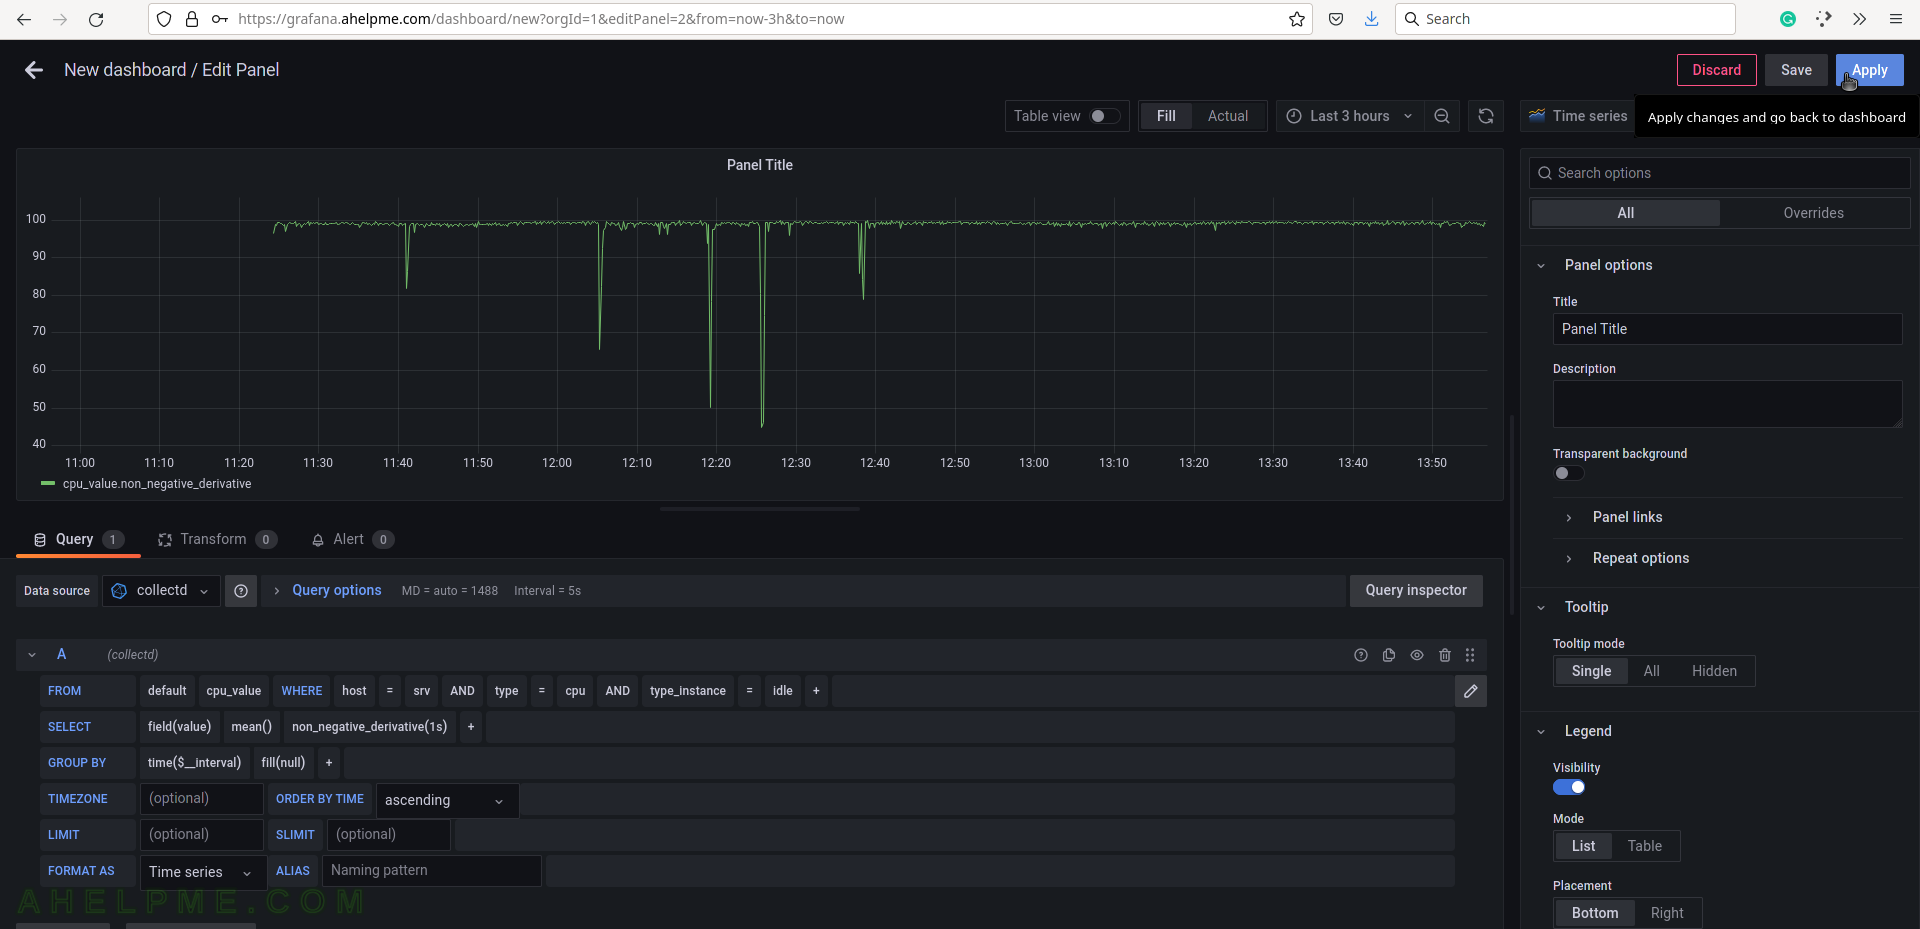
SCREENSHOT 23) Save all modifications in the current dashboard and the new dashboard.
Click on the right bottom corner “diskette” button.
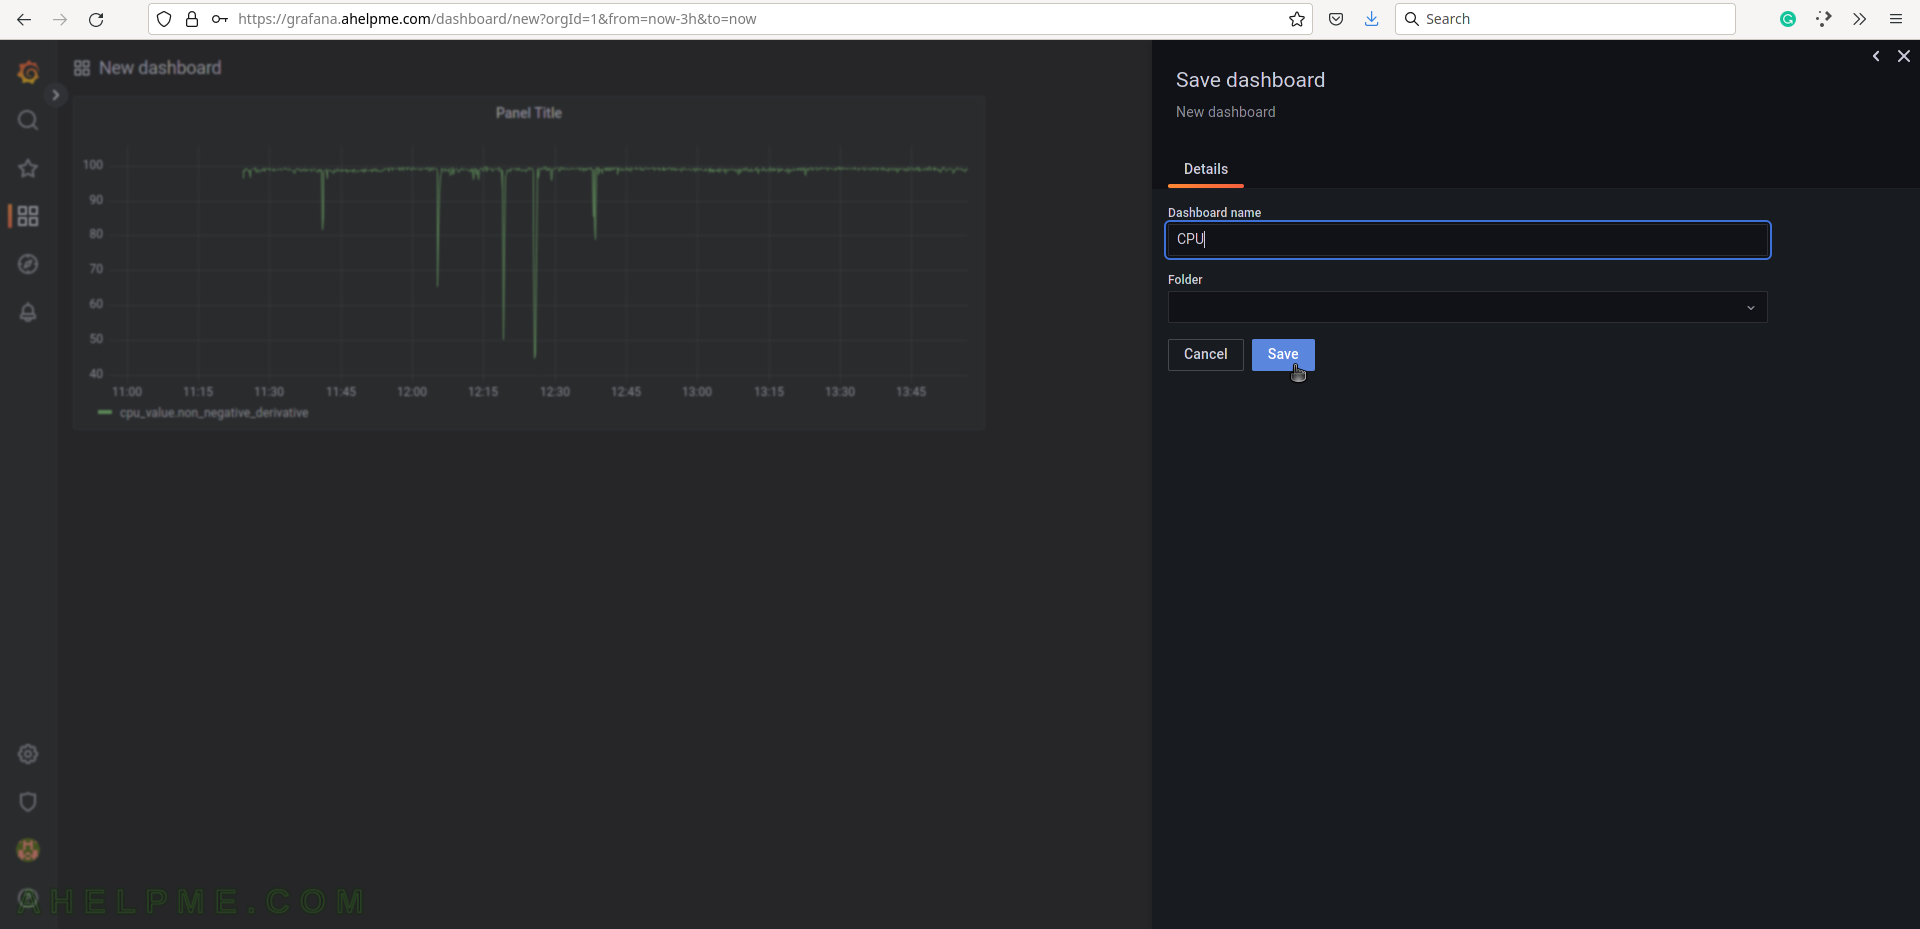
SCREENSHOT 24) Saving a new dashboard will trigger an additional window with details and the dashboard name.
Set the dashboard’s name to CPU and click on the button “Save”.
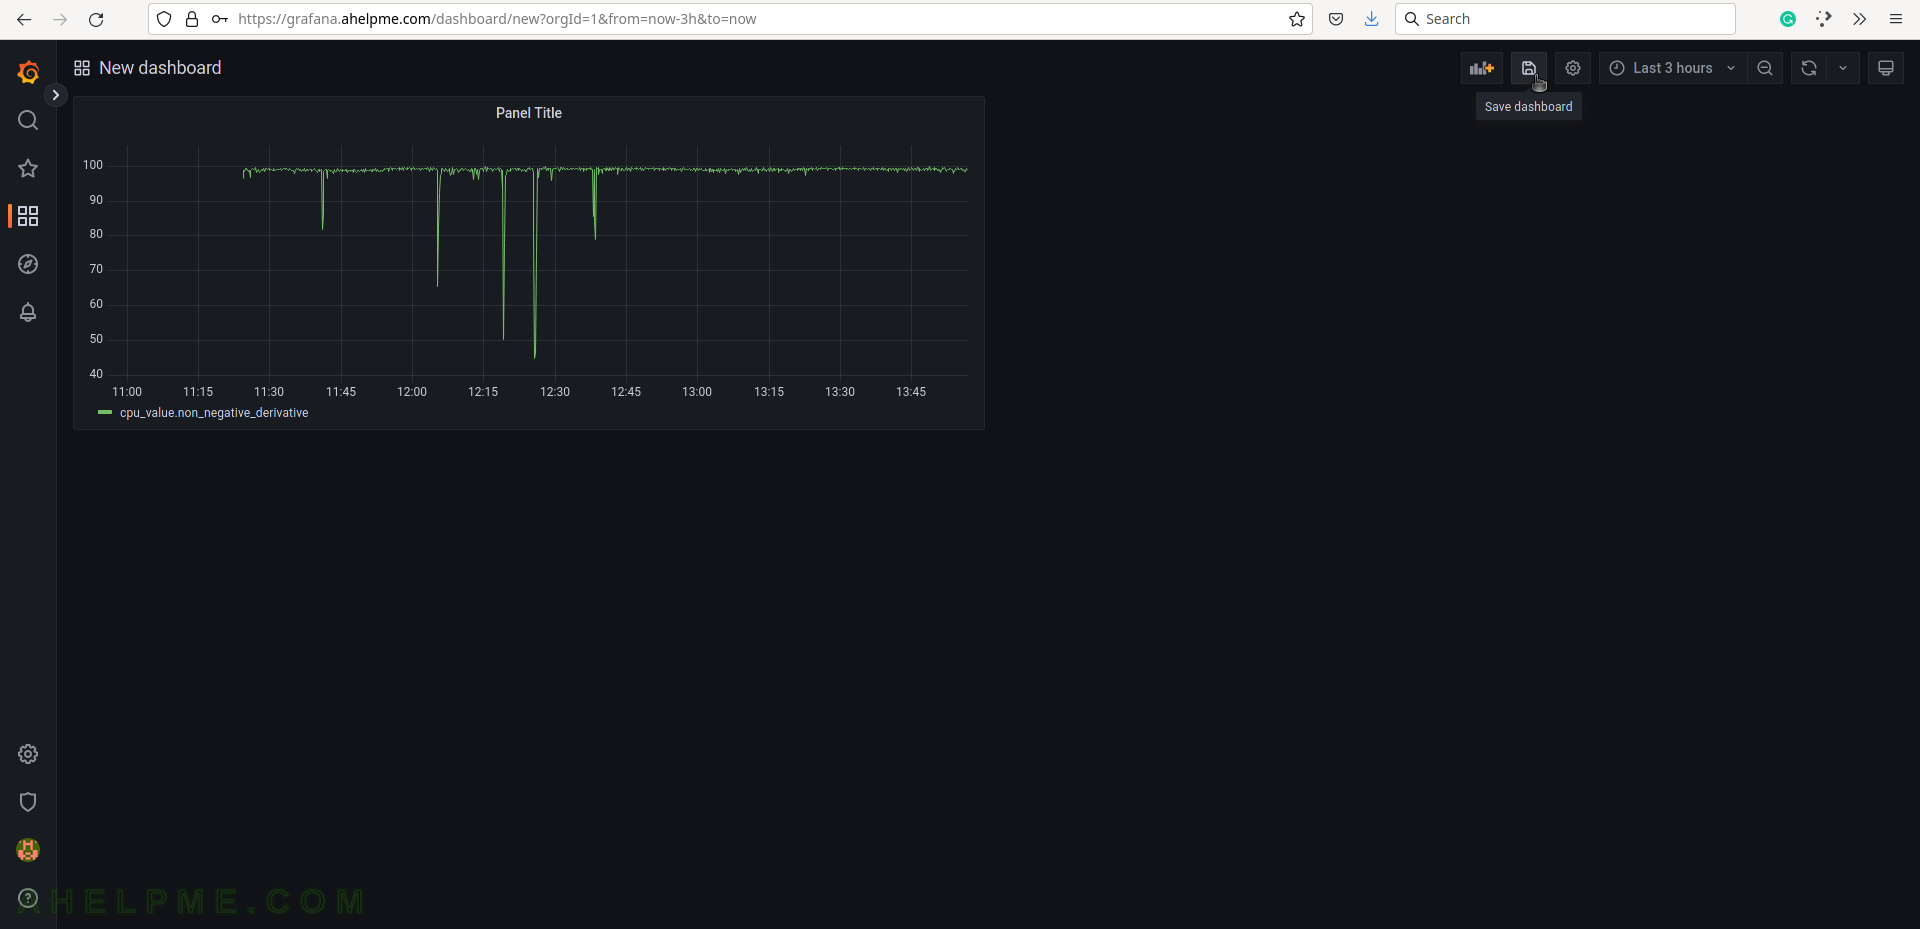
SCREENSHOT 25) The new dashboard CPU is under the folder General.