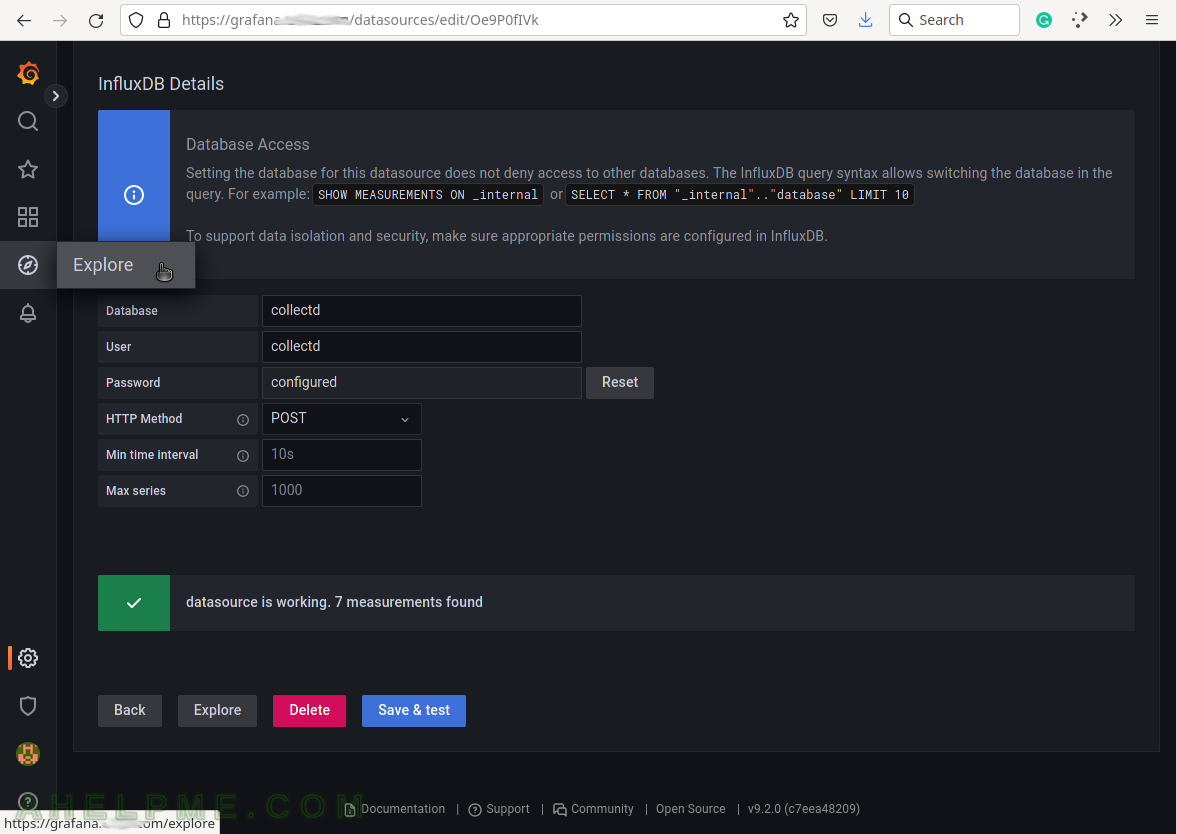
SCREENSHOT 11) Click on Explore to make queries to the InfluxDB and to visualize the results.
Explore menu is just for testing purposes of different queries.
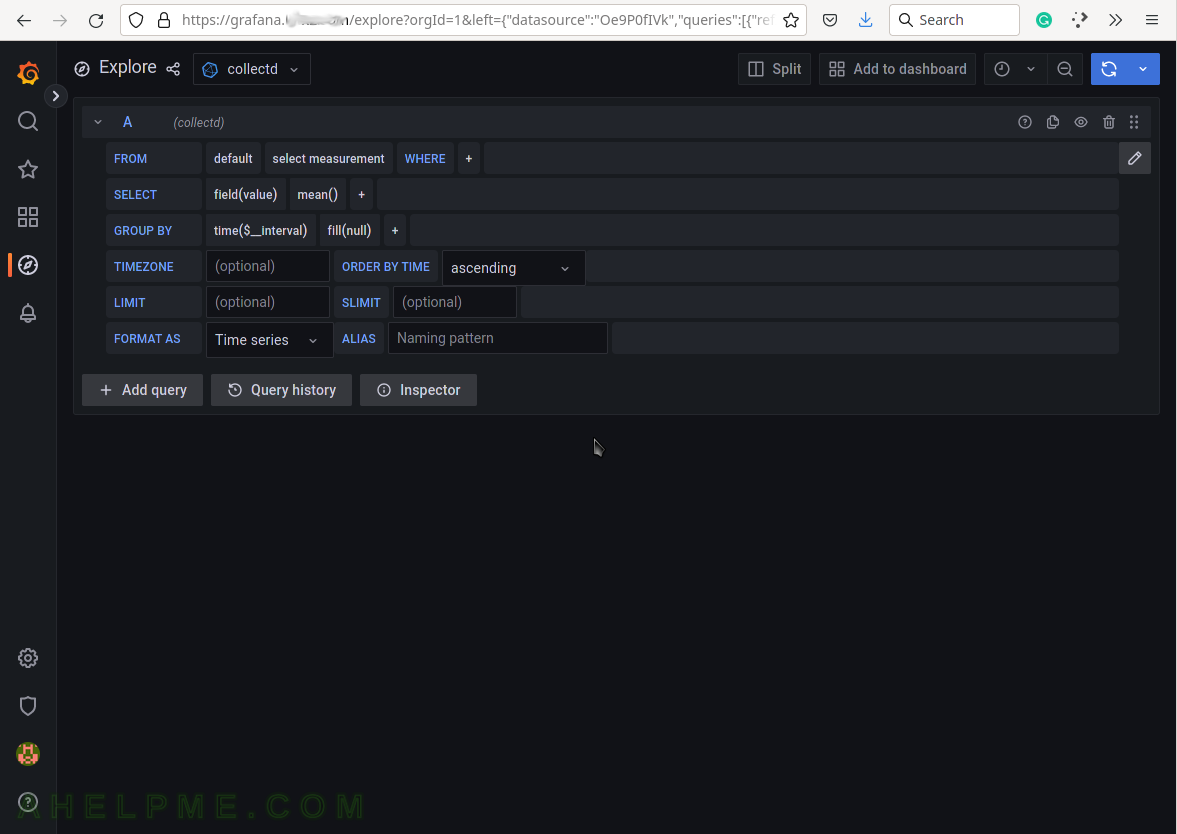
SCREENSHOT 12) The data source collectd is selected and a skeleton of the query is shown.
The white text can be modified by clicking on it Grafana will offer different options and hits. The button “plus” means there could be added more functionalities. To view what can be added, click the button plus “+”.
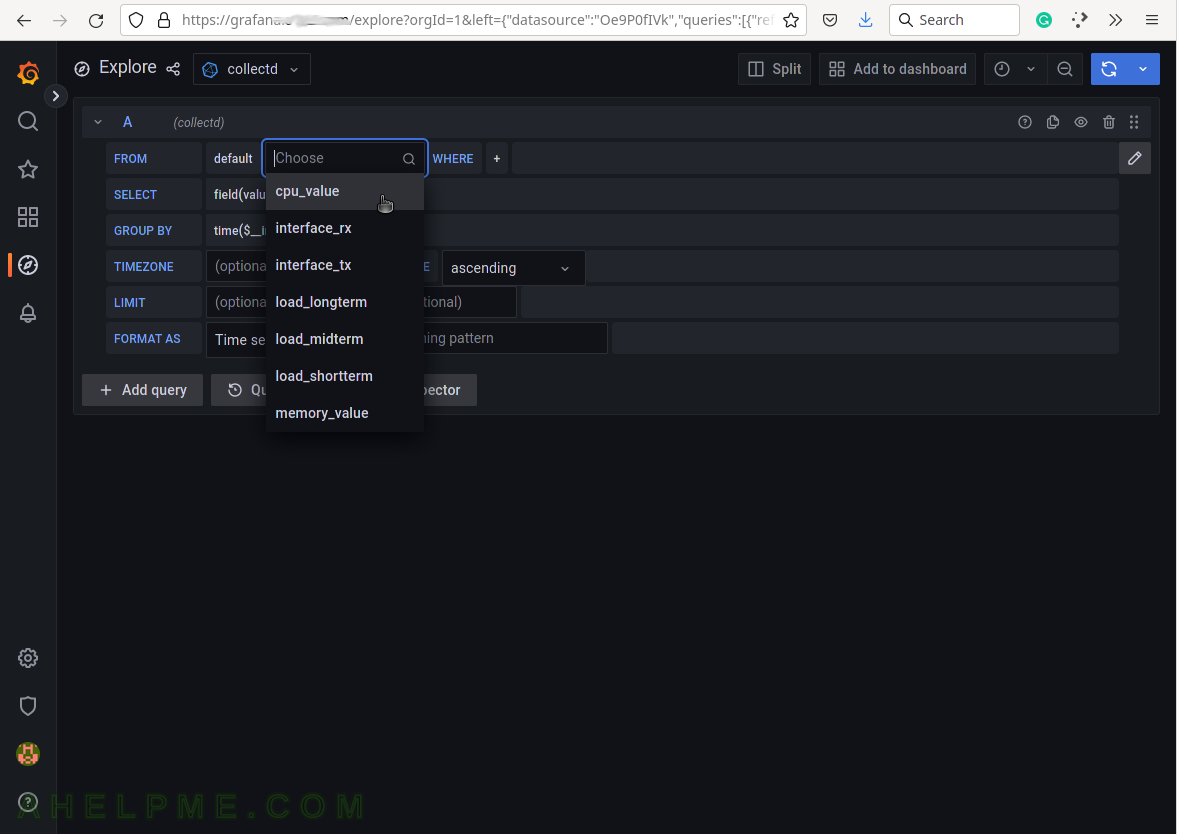
SCREENSHOT 13) Select the measurement to query.
The dropdown list shows all available ones right now in the database collectd – cpu_value, interface_rx, interface_tx, load_longterm, load_midterm, load_shortterm and memory_value. The collectd daemon started at (STEP 2) and wrote data with those measurements in the database.
SCREENSHOT 14) Select the measurement cpu_value, which is an increasing number and a graph immediate appears.
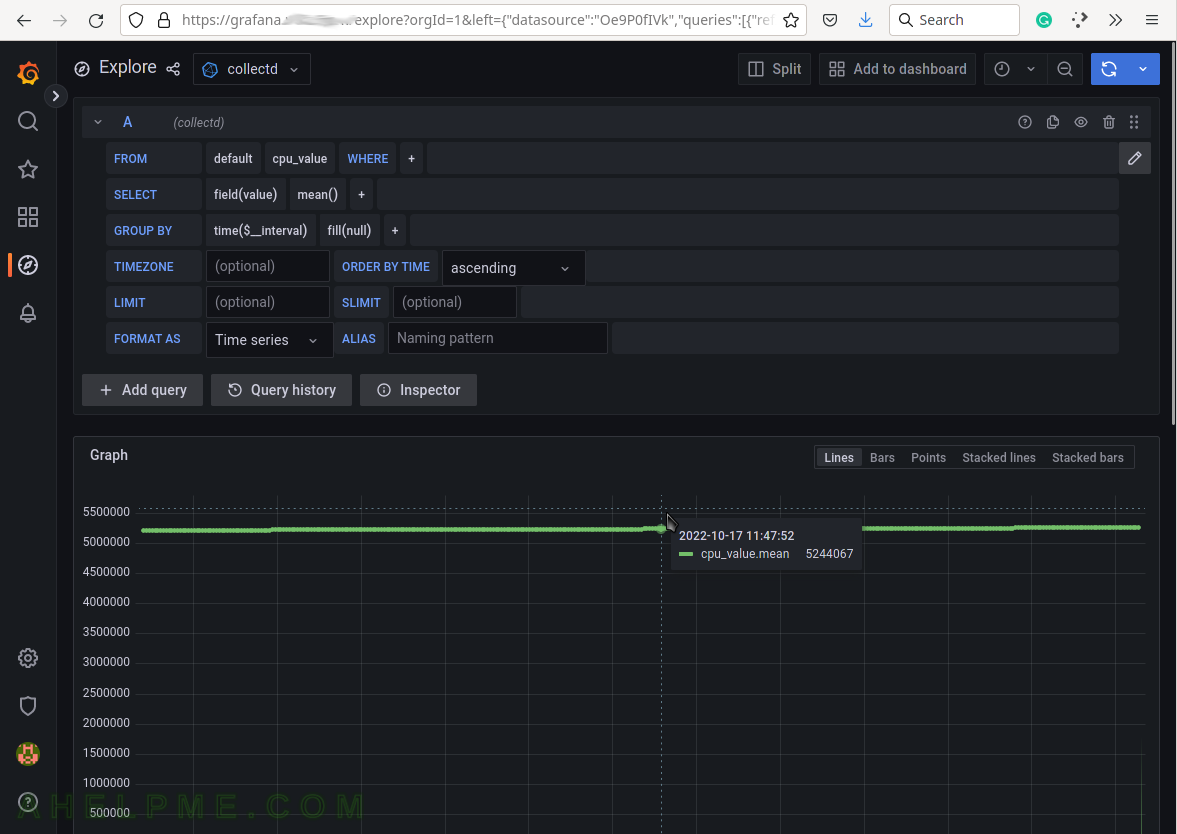
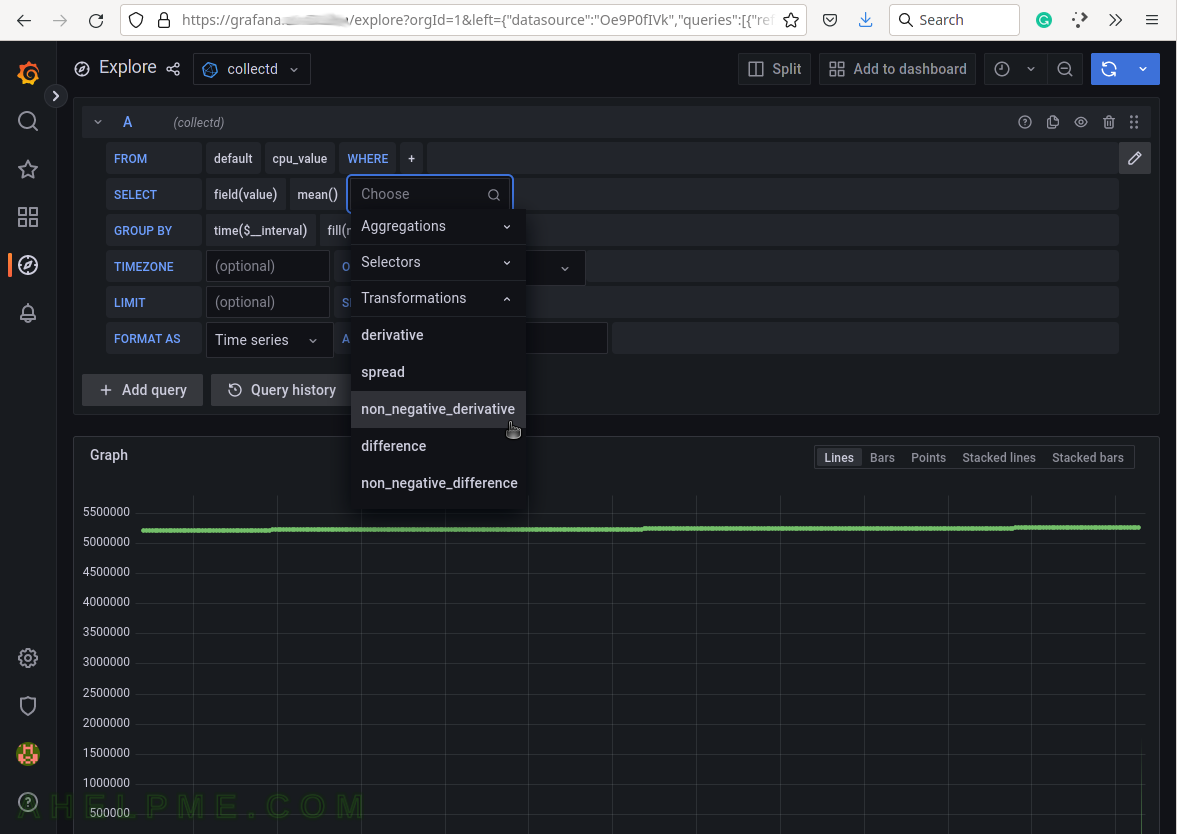
SCREENSHOT 15) Select the function, which will transform the cpu_value in meaningful value.
The cpu_value is increasing value and the show how many CPU idles it should substract two consecutive values.
The CPU plugin collects the amount of time spent by the CPU in various states, most notably executing user code, executing system code, waiting for IO-operations and being idle. This since has been an FAQ: The CPU plugin does not collect percentages. It collects “jiffies”, the units of scheduling. On many Linux systems, there are circa 100 jiffies in one second, but this does not mean you will end up with a percentage.
More on https://collectd.org/wiki/index.php/Plugin:CPU.
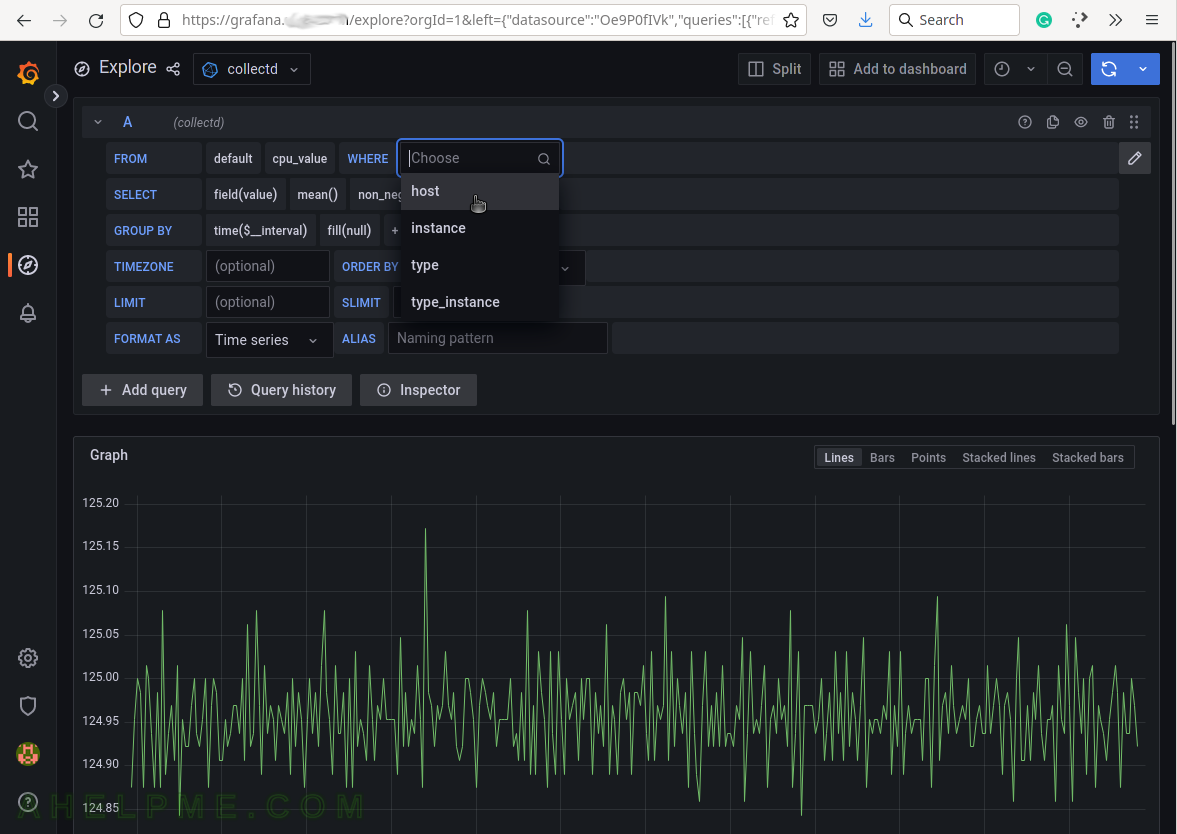
SCREENSHOT 16) Select the tag, with which to limit the query.
All available for this measurement are shown – host, instance, type, and type_instance. In different collectd modules there might be slightly different meanings, but, for example, the host is for the server’s hostname, which gathered the value.
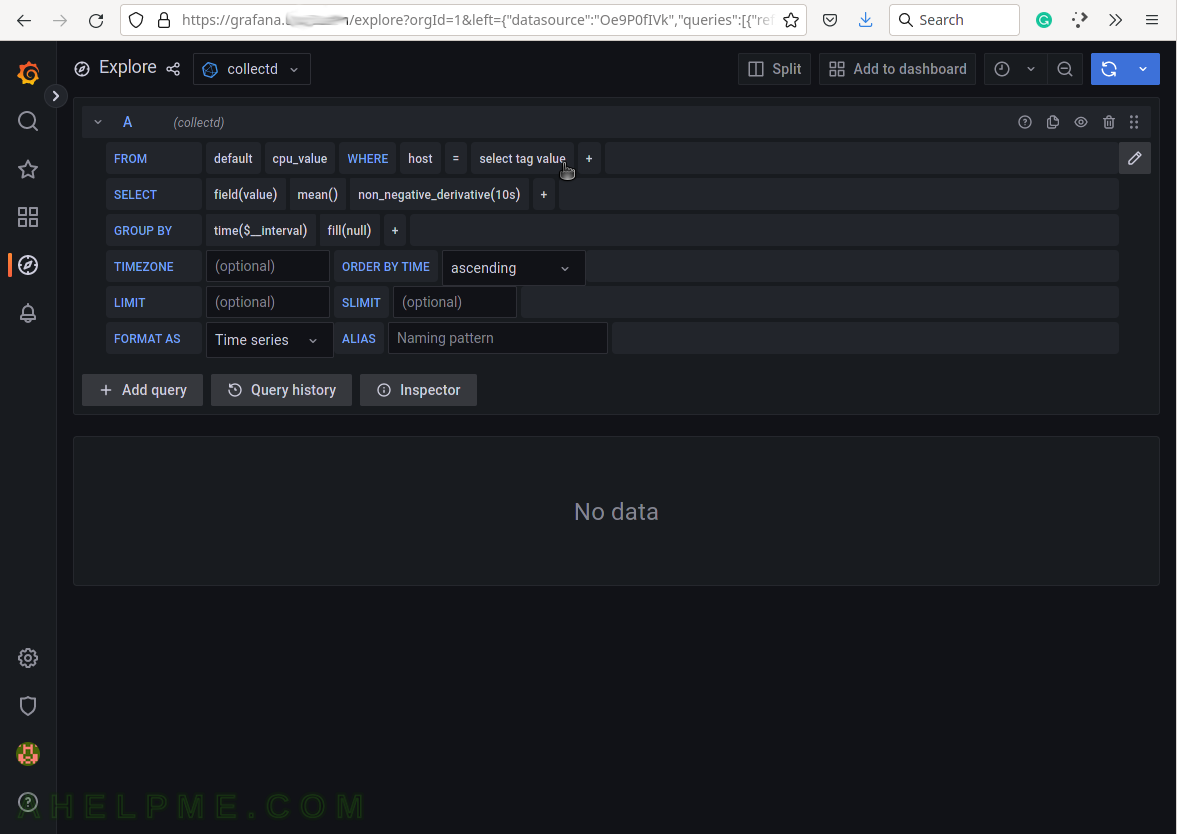
SCREENSHOT 17) Select the hostname of the server to limit the measurement only for this server.
The host tag value is for the hostname. It can accept regular expressions.
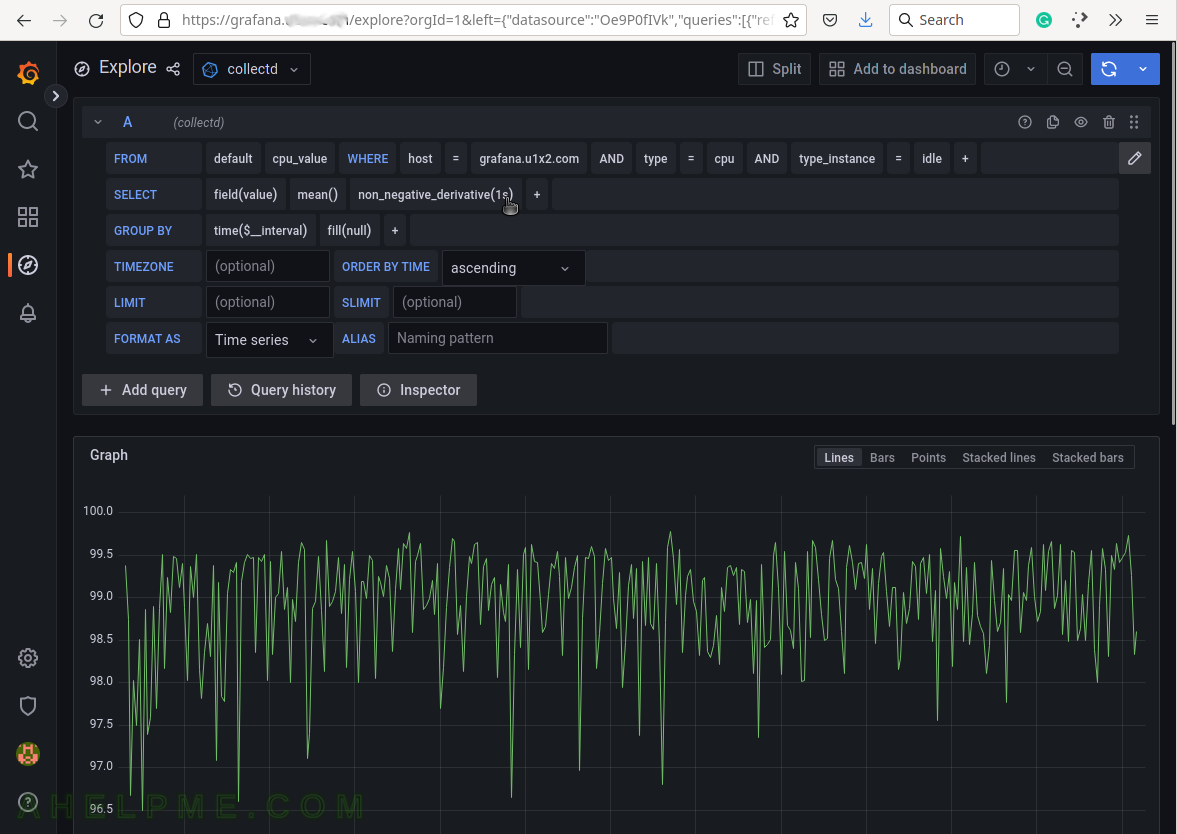
SCREENSHOT 18) A proper query for the idle time percentage of the CPU is shown.
Limiting by using WHERE clause with tags host, type and type_instance and tags’ values grafana.ahelpme.com, CPU, idle in the same order.
SCREENSHOT 19) All graphs and data usually is organized in dashboards with panels of charts, graphs, tables, counters, and lines of data.
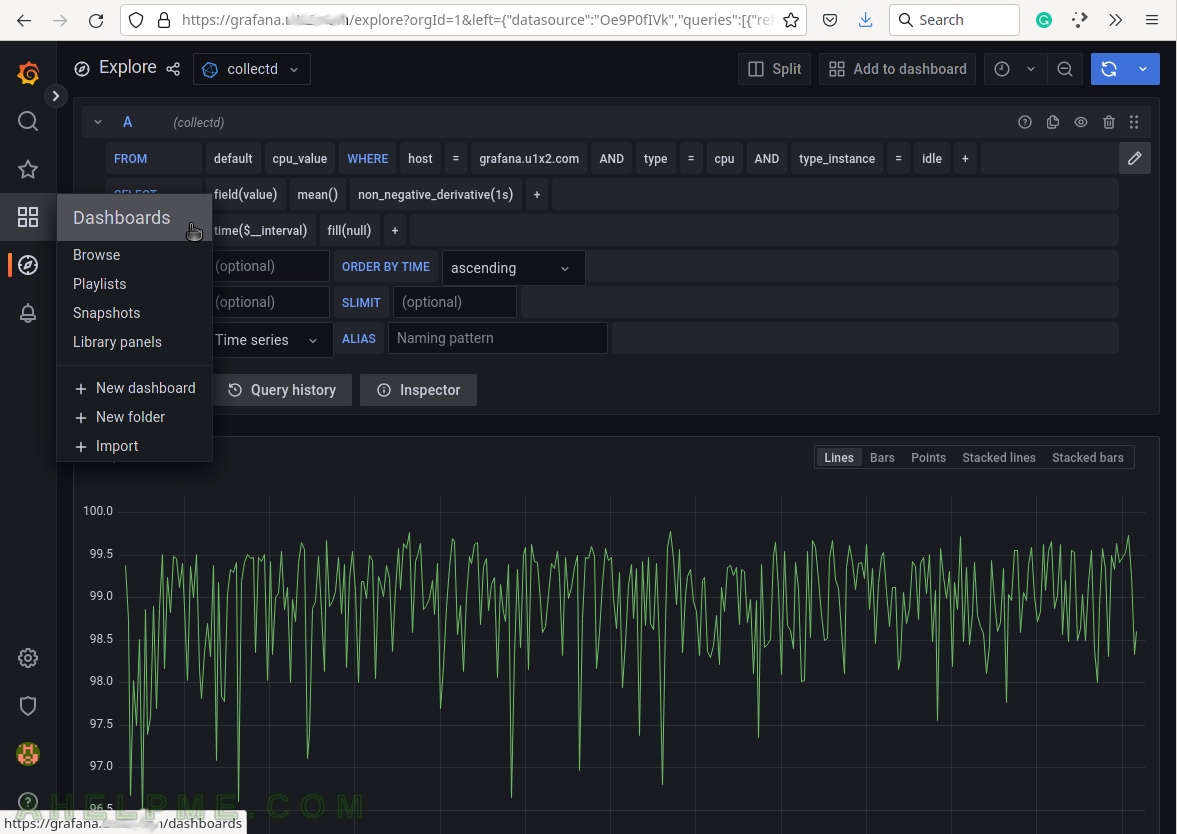
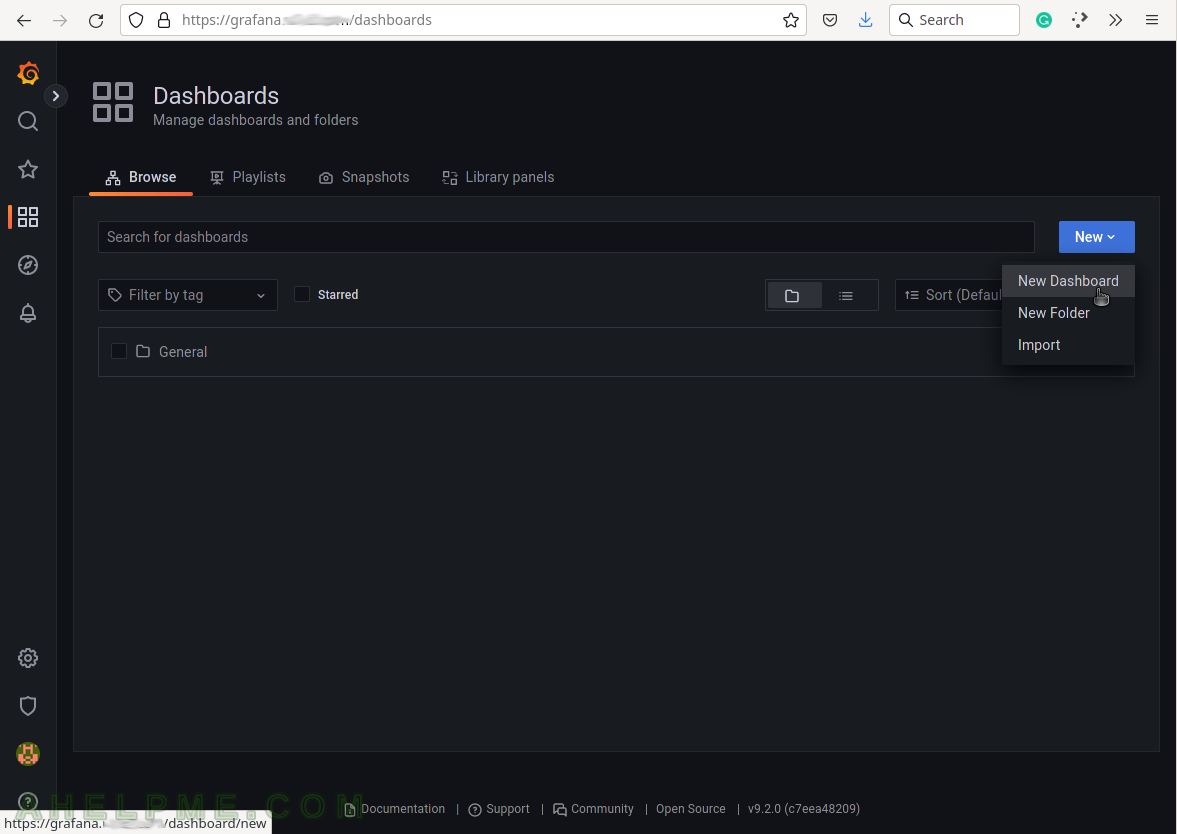
SCREENSHOT 20) Create a new dashboard.