This article shows how to add a new source in Grafana with screenshots. The source is InluxDB 1.8 with basic authentication enabled. The main purpose of this article is to give the user knowledge of how to:
- Enable basic authentication in InfluxDB
- Create users – administrative and ordinary ones in InfluxDB and give permissions for the database.
- Add the InfluxDB source in Grafana using web interface. with basic authentication enabled with credentials created in the article.
It is supposed the InfluxDB is installed and running on the loopback 127.0.0.1, at least. If the InfluxDB service is not local for the Grafana service replace the 127.0.0.1 with the appropriate IP and adjust the firewall such that it accepts connections from the Grafana server IP. For installing InfluxDB with detailed information including firewall modifications there is another article here – Monitor and analyze with Grafana, InfluxDB 1.8 and collectd under CentOS Stream 9.
No installation information for InfluxDB or Grafana is included in this article and if they are needed check out the article above.
STEP 1) Create users in InfluxDB.
By default, InfluxDB authentication is disabled and no users are required to access and manage the service and the databases. That’s why, the first thing to do is to create an administrative user, which will manage the databases when the basic authentication will be enabled. At the same time, when creating the administrative user, ordinary users may be created, too.
To connect to the InfluxDB to manage the service the InfluxDB command-line tool influx will be used. influx connects to http://127.0.0.1:8086 – an HTTP interface to access the InfluxDB service.
[root@srv ~]# influx
Connected to http://localhost:8086 version 1.8.10
InfluxDB shell version: 1.8.10
> CREATE USER admin WITH PASSWORD 'aiqu8ohth9Cheeshai]c' WITH ALL PRIVILEGES
> SHOW USERS
user  admin
----  -----
admin true
> CREATE USER collectd WITH PASSWORD 'ohg|ahTh9Sa|quoh8zoh'
> GRANT READ ON "collectd" TO "collectd"
> SHOW USERS
user     admin
----     -----
admin    true
collectd false
>
First, the administrative user with admin name is created, and then the ordinary user with the collectd name. For the ordinary user, the access privileges are granted only for READ on the collectd database. It is typical to name the database and the user accessing it with the same name. The format of the GRANT command is the following:
GRANT "[PRIVILEGES]" ON "[database_name]" TO "[user_name]"
READ privileges are enough for Grafana to access the data.
STEP 2) Enable basic authentication in InfluxDB.
As stated before, by default InfluxDB has no authentication enabled. To enable the authentication few options should be changed in the main configuration file /etc/influxdb/influxdb.conf:
.....
[http]
.....
.....
  auth-enabled = true
.....
  pprof-enabled = true
.....
  pprof-auth-enabled = true
.....
  ping-auth-enabled = true
.....
.....
Then restart the InfluxDB service. For example, in the CentOS world:
systemctl restart influxdb
Now, to access the InfluxDB service with the command-line tool influx the “–username” and “–password” arguments must be used.
> [root@srv ~]# influx --username admin --password 'aiqu8ohth9Cheeshai]c'
Connected to http://localhost:8086 version 1.8.10
InfluxDB shell version: 1.8.10
> SHOW USERS
user     admin
----     -----
admin    true
collectd false
> exit
Create an ordinary user with READ privileges if it wasn’t created in STEP 1).
If no password is supplied or it is wrong, there is an error message at the moment a query is performed:
[root@srv ~]# influx --username admin --password '1111'
Connected to http://localhost:8086 version 1.8.10
InfluxDB shell version: 1.8.10
> SHOW USERS
ERR: authorization failed
Warning: It is possible this error is due to not setting a database.
Please set a database with the command "use <database>".
>
STEP 3) Add new InfluxDB sources in Grafana using the web interface.
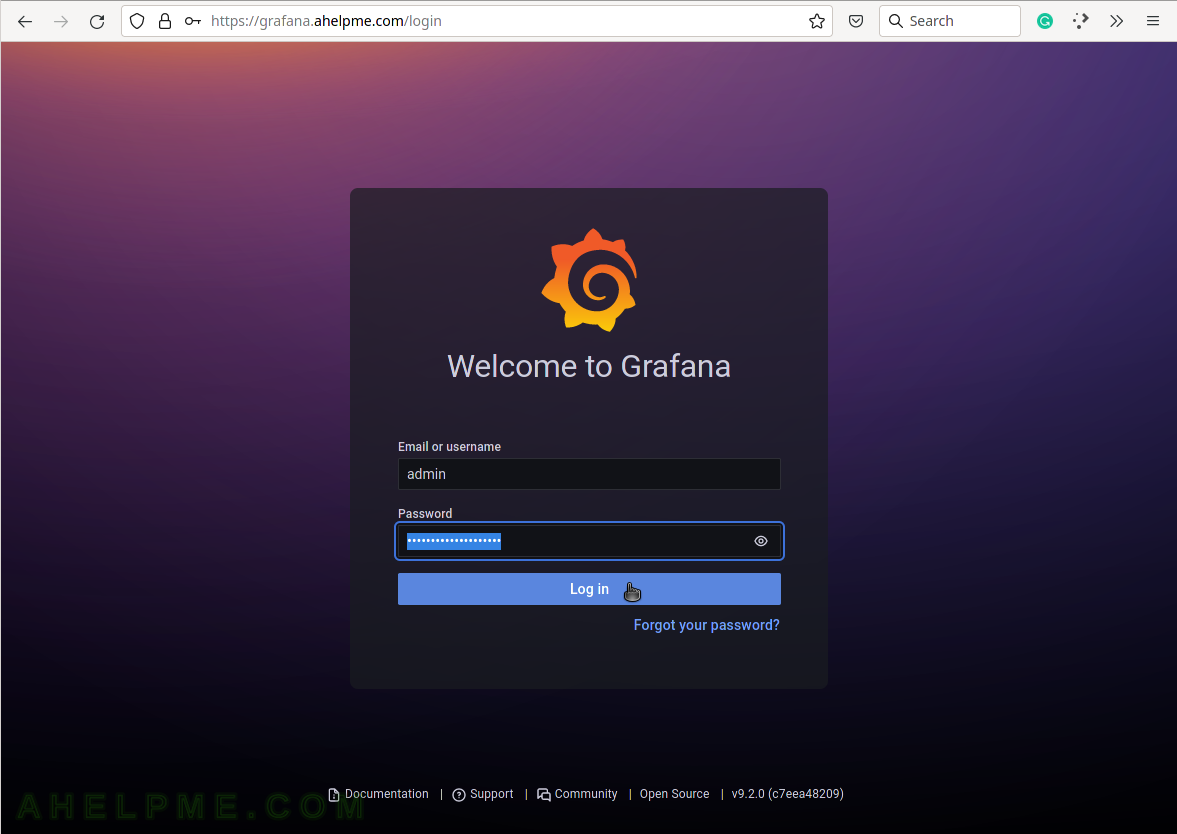
Login with the administrative user admin to Grafana and follow the screenshots below.
SCREENSHOT 1) Login with the user with administrative privileges.
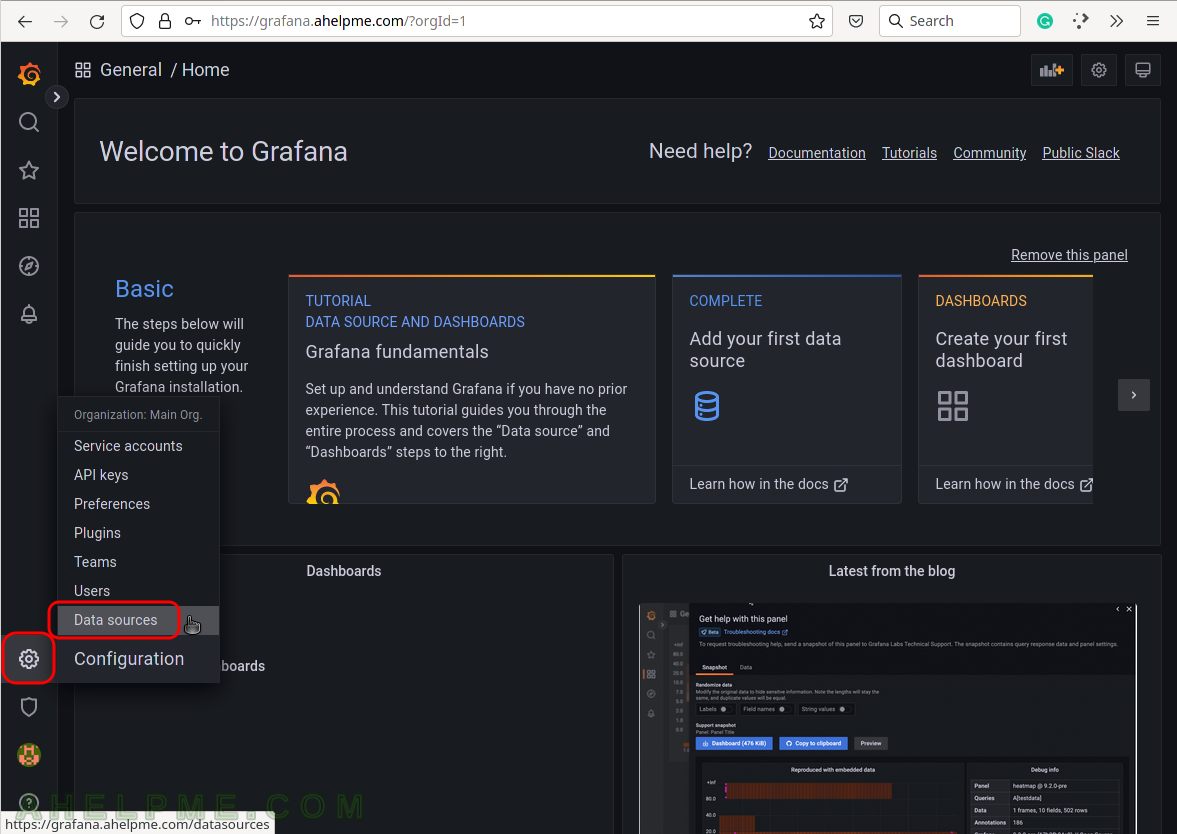
SCREENSHOT 2) Select the Configuration menu and then Data sources to add the database back-end.
Grafana supports multiple back-ends and one of them is the InfluxDB source.
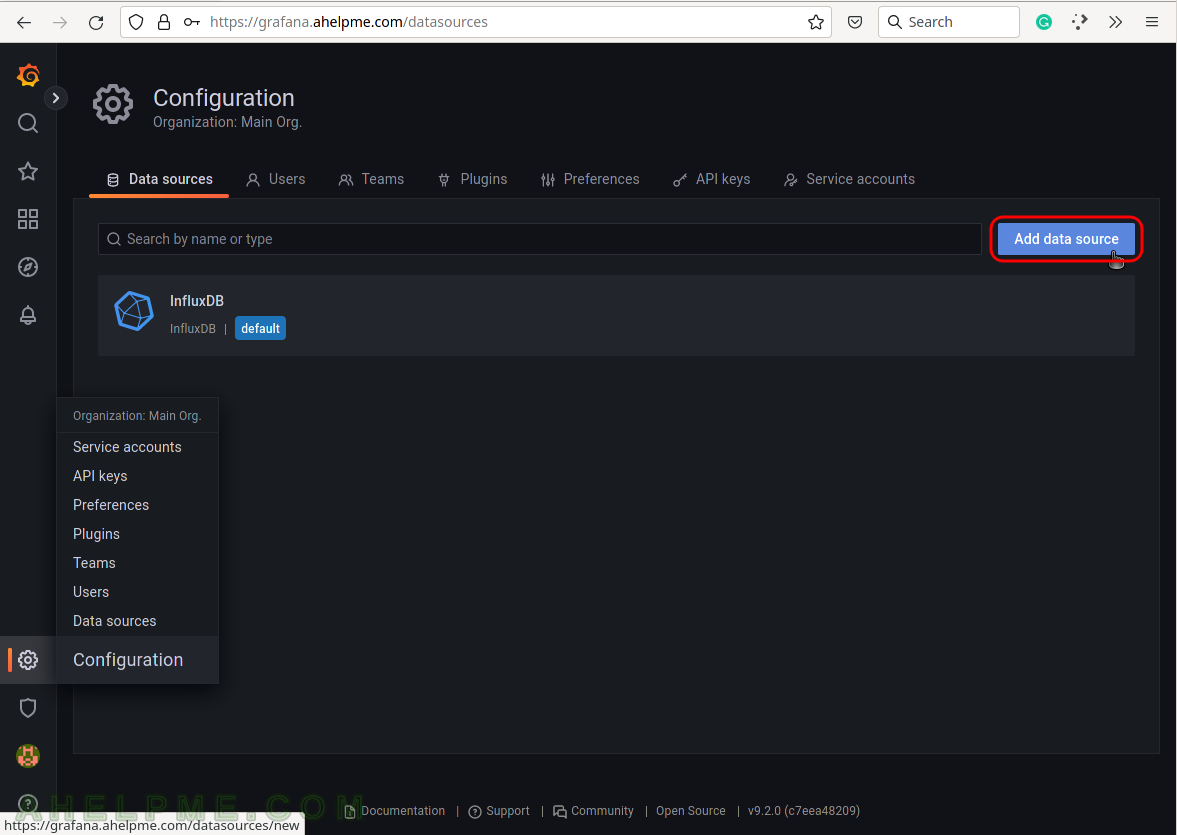
SCREENSHOT 3) To tell Grafana how to access the data sources.
Click on the button “Add data source” to choose from different supported data sources.
SCREENSHOT 4) Select the InfluxDB line to add and configure an InfluxDB data source.
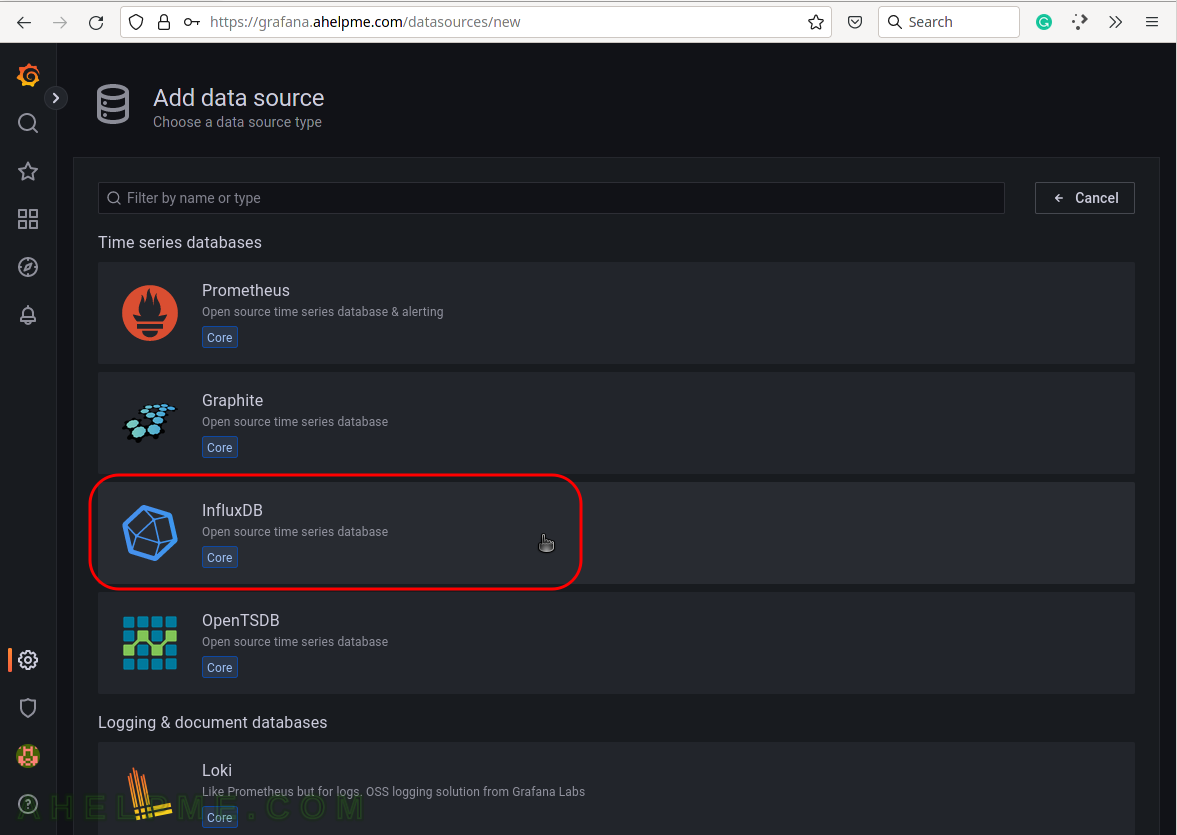
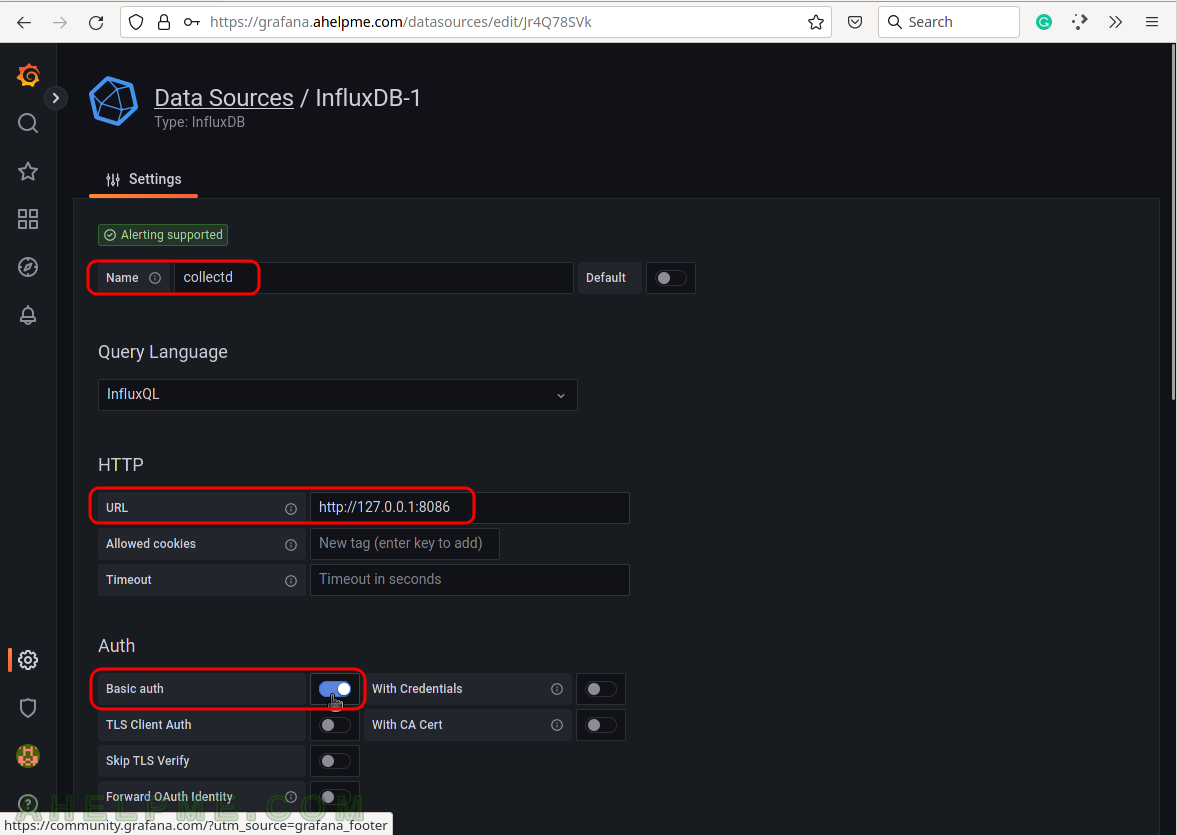
SCREENSHOT 5) Configure how Grafana can access the InfluxDB – URL, database name, and authentication.
Set the name of the source to be “collectd” (usually is the same name as the database name), URL: http://127.0.0.1:8086 (this is the default local URL if it is remote add the IP of the remote InfluxDB server), and enable the “Basic auth” for basic authentication. Scroll down the page.
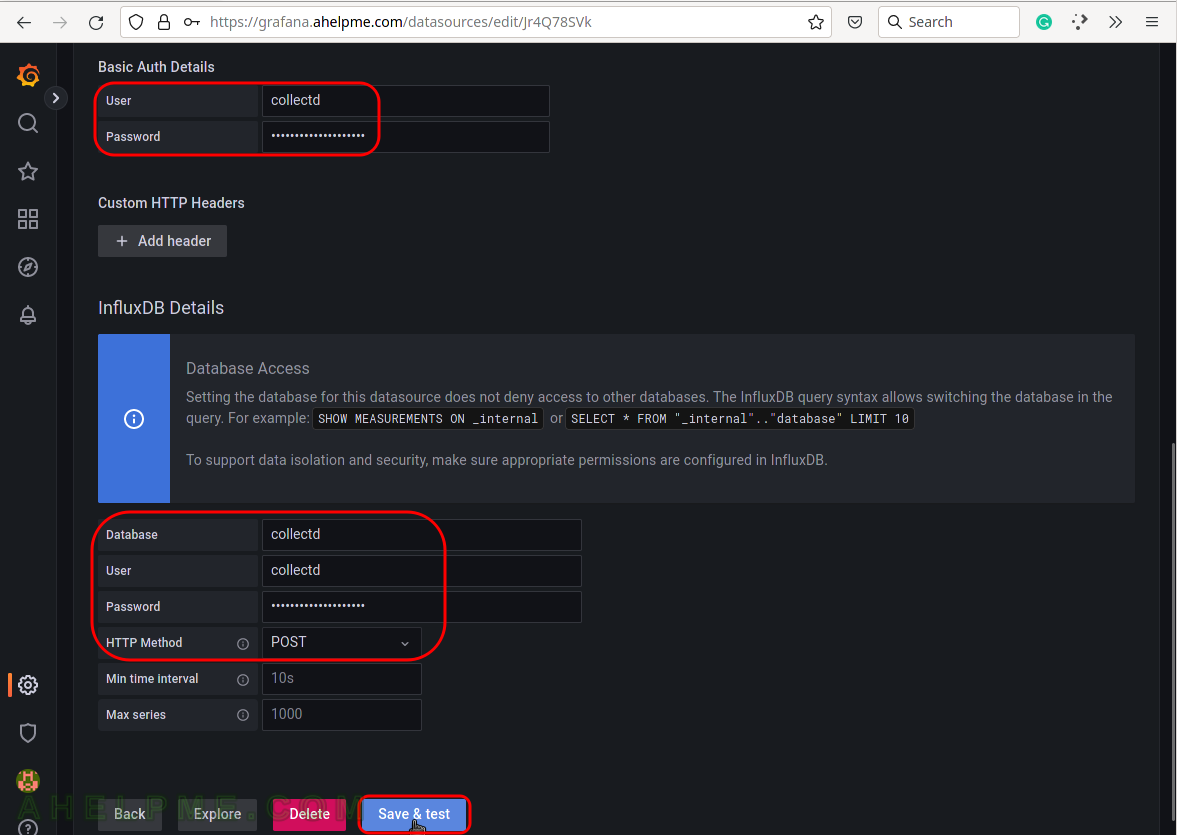
SCREENSHOT 6) Configure the username, password and the database name to access InfluxDB server.
Fill the both sections with the same username and password set during the installation phase above. For database name fill with “collectd” and change the HTTP Method to “POST” (POST method allows bigger and more complex queries). Finally, click on the button “Save & test” to save the new Data source and test the connection to the database back-end.
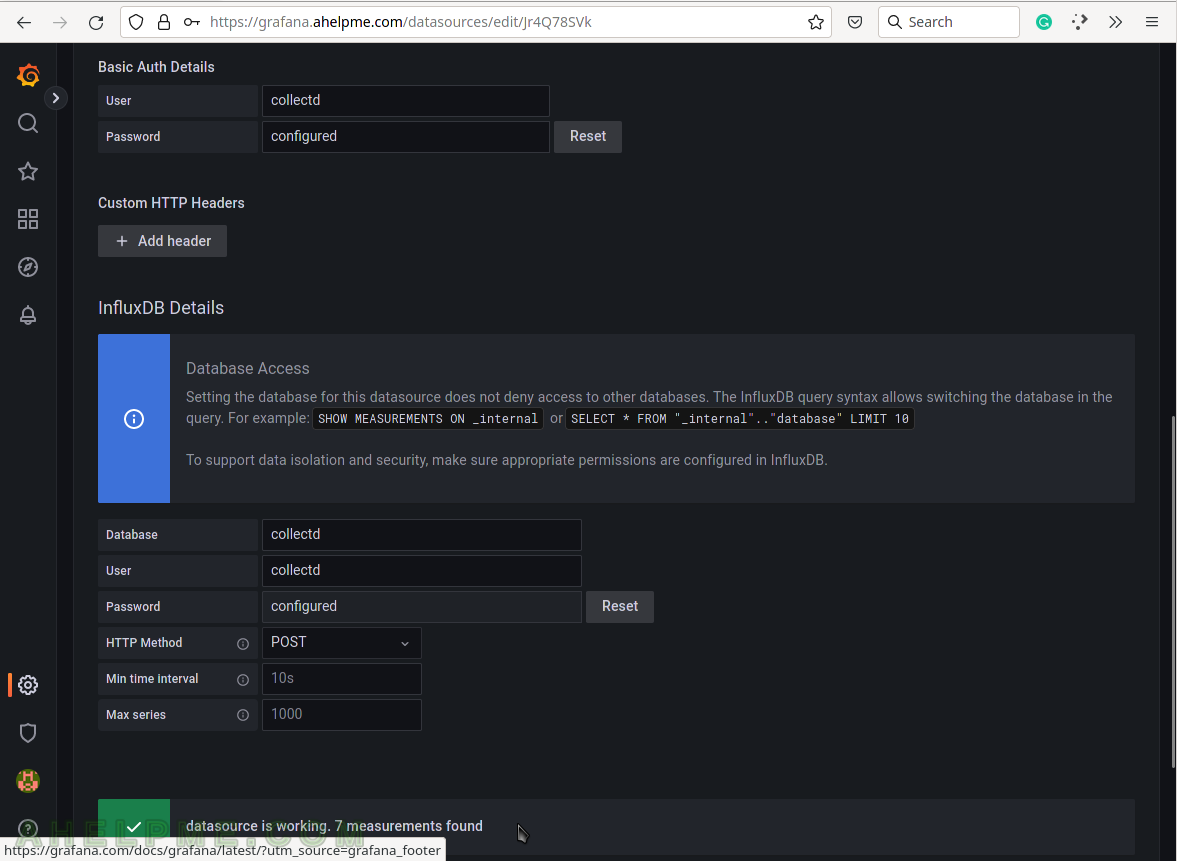
SCREENSHOT 7) If the connection to the database is working a green note will be shown above the buttons.
The connection is working and a green note is shown – “datasource is working. 7 measurements found.” The number of measurements found by Grafana may vary.
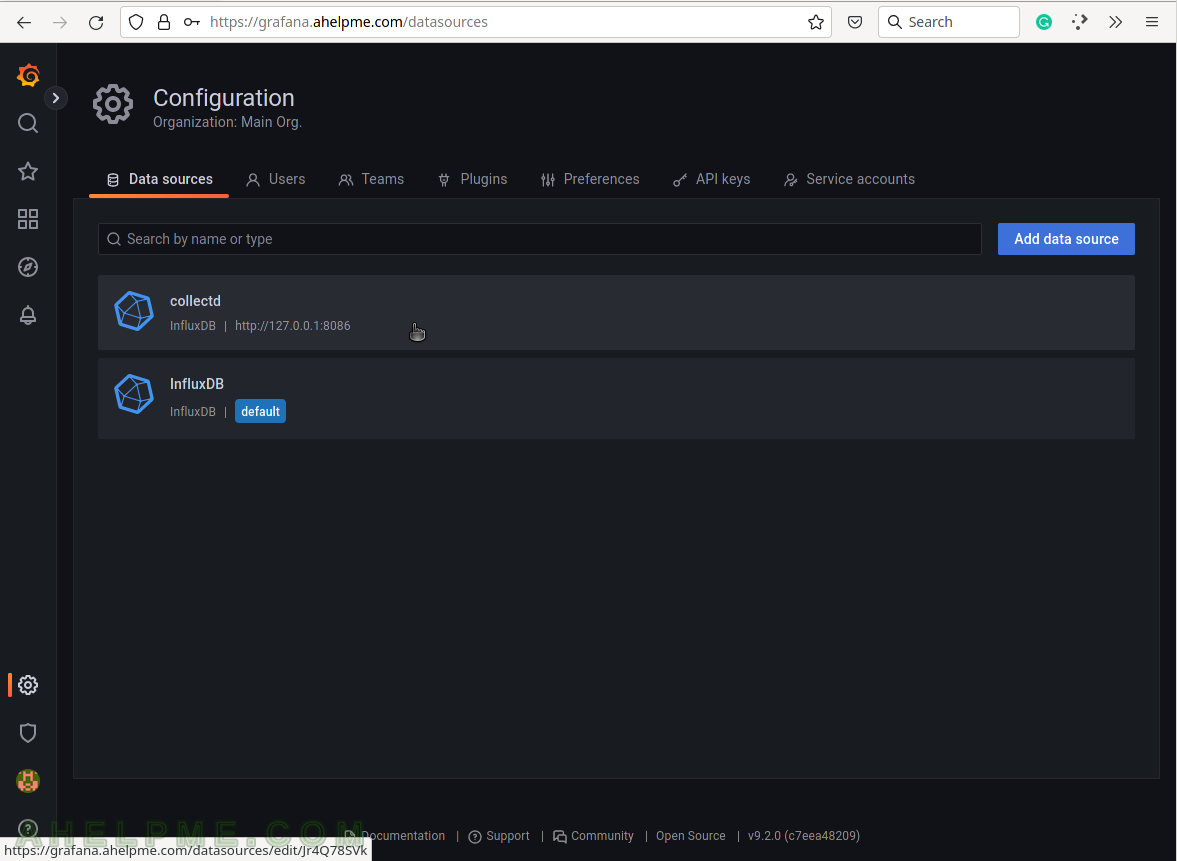
SCREENSHOT 8) The Data sources sub-menu of Configuration shows the InfluxDB data sources with name “collectd”.
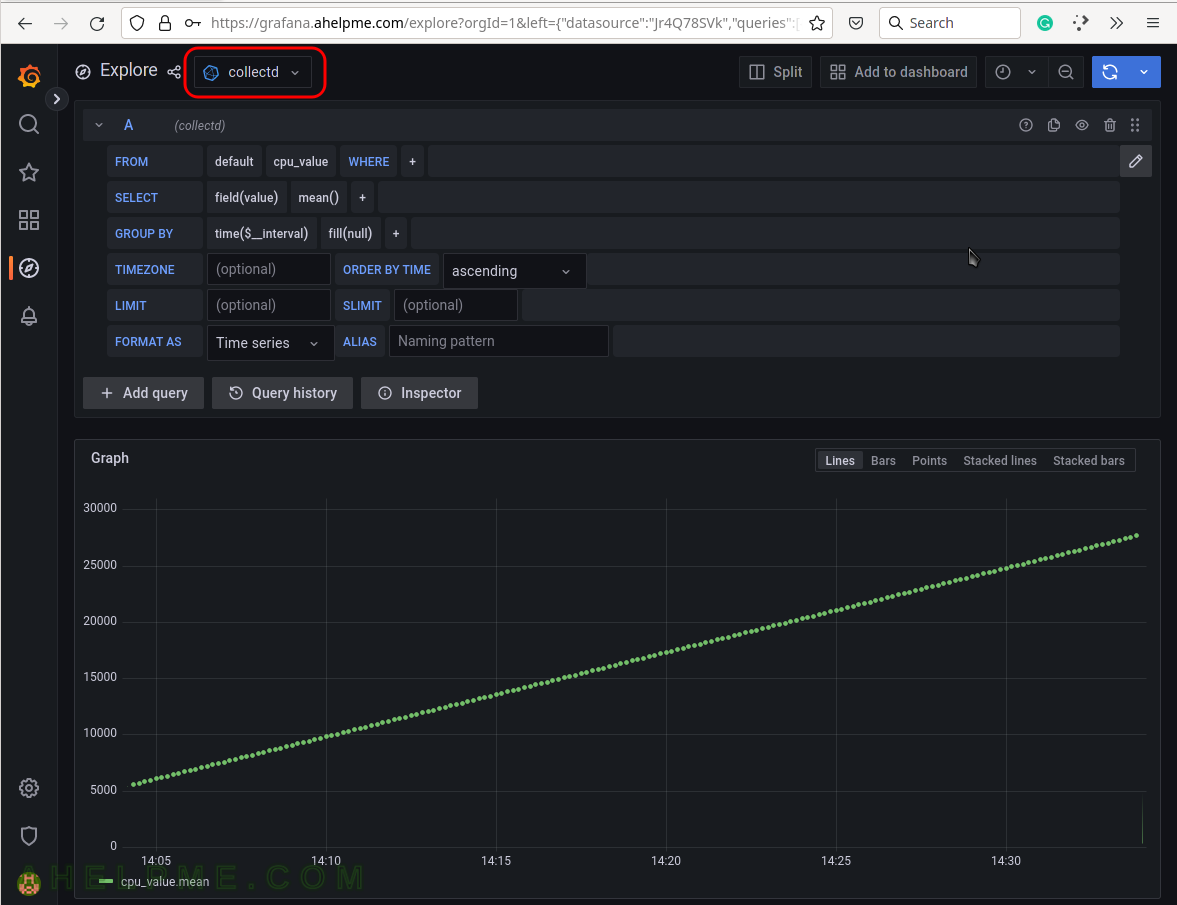
SCREENSHOT 9) Show data from the InfluxDB data sources “collectd”.
Click on the Explore to make queries to the InfluxDB and to visualize the results. Explore menu is just for testing purpose of diffrent queries.