This article shows how to make a graph showing a Linux machine’s processes states. This plugin could gather the number of the processes grouped by their state or metadata per the selected process defined in the configuration (metadata includes process state, size of the resident segment size (RSS), system/user time used, and so on.). The purpose of this article is to make a graph with all the processes grouped by their state. Graphs per process data are not included here.
The Linux machine is using collectd to gather the processes statistics and send them to the time series back-end – InfluxDB. Grafana is used to visualize the data stored in the time series back-end InfluxDB and organize the graphs in panels and dashboards. Check out the previous articles on the subject to install and configure such software to collect, store and visualize data – Monitor and analyze with Grafana, influxdb 1.8 and collectd under CentOS Stream 9, Monitor and analyze with Grafana, influxdb 1.8 and collectd under Ubuntu 22.04 LTS and Create graph for Linux CPU usage using Grafana, InfluxDB and collectd
The collectd daemon is used to gather data on the Linux system and to send it to the back-end InfluxDB.
Key knowledge for the Processes collectd plugin
- The collectd plugin Processes official page – https://collectd.org/wiki/index.php/Plugin:Processes
- The Processes plugin options – https://collectd.org/documentation/manpages/collectd.conf.5.shtml#plugin_processes
- to enable the Processes plugin, load the plugin with the load directive in /etc/collectd.conf
LoadPlugin processes
- The Processes plugin collects data every 10 seconds.
- processses_value – a single Gauge value – a metric, which value that can go up and down. It is used to count the number of processes in the different states (the state is saved in a tag value of one record). So there are multiple gauge values with different tags for the different process states at a given time.
tag key tag value description host server hostname The name of the source this measurement was recorded. type cpu ps_state is the type, which will group the processes by states. type_instance processes’ states States are – blocked, paging, running, sleeping, stopped, zombies. - A Gauge value – a metric, which value that can go up and down. More on the topic – Data sources.
A GAUGE value is simply stored as-is. This is the right choice for values which may increase as well as decrease, such as temperatures or the amount of memory used.
- To cross check the value, the user can use the /proc/stat
[root@srv ~]# cat /proc/stat
cpu  804 0 732 6240 198 106 25 0 0 0
cpu0 444 0 345 3092 121 44 14 0 0 0
cpu1 359 0 387 3147 76 62 11 0 0 0
intr 72376 117 9 0 0 0 0 0 0 1 2 0 0 156 0 187 187 0 0 188 273 0 0 0 0 0 0 6574 0 0 0 0 0 0 0 0 0 0 0 0 0 0 0 0 0 0 0 0 0 0 0 0 0 0 0 0 0 0 0 0 0 0 0 0 0 0 0 0 0 0 0 0 0 0 0 0 0 0 0 0 0 0 0 0 0 0 0 0 0 0 0 0 0 0 0 0 0 0 0 0 0 0 0 0 0 0 0 0 0 0 0 0 0 0 0 0 0 0 0 0 0 0 0 0 0 0 0 0 0 0 0 0 0 0 0 0 0 0 0 0 0 0 0 0 0 0 0 0 0 0 0 0 0 0 0 0 0 0 0 0 0 0 0 0 0 0 0 0 0 0 0 0 0 0 0 0 0 0 0 0 0 0 0 0 0 0 0 0 0 0 0 0 0 0 0 0 0 0 0 0 0 0 0 0 0 0 0 0 0 0 0 0 0 0 0 0 0 0 0 0 0 0 0 0 0 0 0 0 0 0 0 0 0 0 0 0 0 0 0 0 0 0 0 0 0 0 0 0 0 0 0 0 0 0 0 0 0 0 0 0 0 0 0 0 0 0 0 0 0 0 0 0 0 0 0 0 0 0 0 0 0 0 0 0 0 0 0 0 0 0 0 0 0 0 0 0 0 0 0 0 0 0 0 0 0 0 0 0 0 0 0 0 0 0 0 0 0 0 0 0 0 0 0 0 0 0 0 0 0 0 0 0 0 0 0 0 0 0 0 0 0 0 0 0 0 0 0 0 0 0 0 0 0 0 0 0 0 0 0 0 0 0 0 0 0 0 0 0 0 0 0 0 0 0 0 0 0 0 0 0 0 0 0 0 0 0 0 0 0 0 0 0 0 0 0 0 0 0 0 0 0 0 0 0 0 0 0 0 0 0 0 0 0 0 0 0 0 0 0 0 0 0 0 0 0 0 0 0 0 0 0 0 0 0 0 0 0 0 0 0 0
ctxt 216350
btime 1667997331
processes 1359
procs_running 2
procs_blocked 0
softirq 38704 2 5003 5 290 6565 0 74 5796 0 20969
Some of the lines are pretty clear about what they mean by “procs_running“, “processes“, “procs_blocked” and so on.
The InfluxQL queries for the Linux Processes plugin are grouped by states
The queries are Grafana generated.
SELECT mean("value") FROM "processes_value" WHERE ("host" = 'srv' AND "type" = 'ps_state') AND time >= now() - 6h and time <= now() GROUP BY time(20s), "type_instance" fill(null)
The mean function will compute the mean if there is more than one value in the database for every 15 minutes (this is the “group by” logic here). Probably the most accurate query might be to use the last() function instead of mean() and to group by time(1s). As mentioned above, the collectd interval is 10 seconds. The function non_negative_derivative is needed to compute the difference between the values.
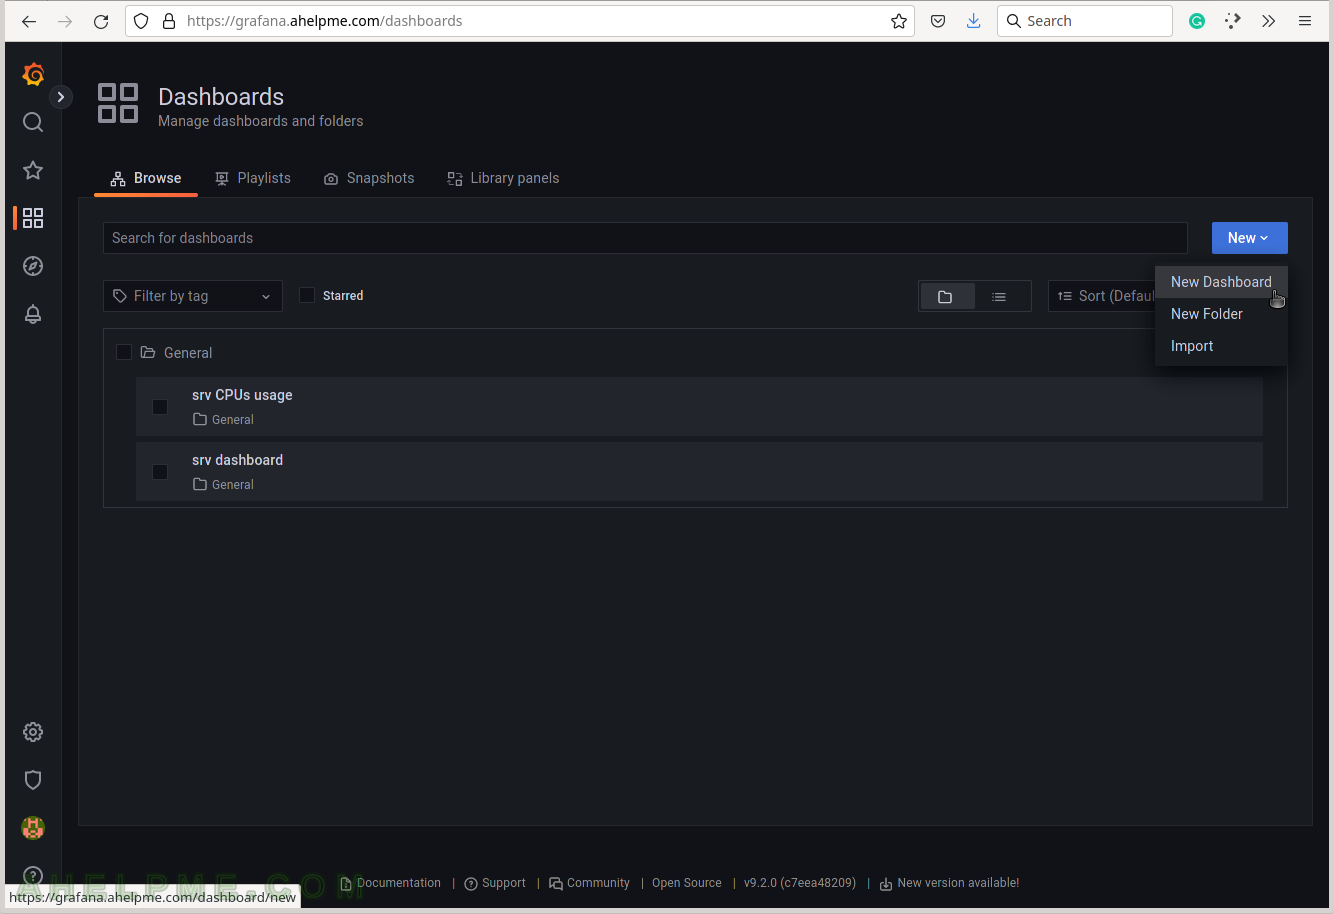
SCREENSHOT 1) Create a new dashboard, which will contain the Processes statesgraph.
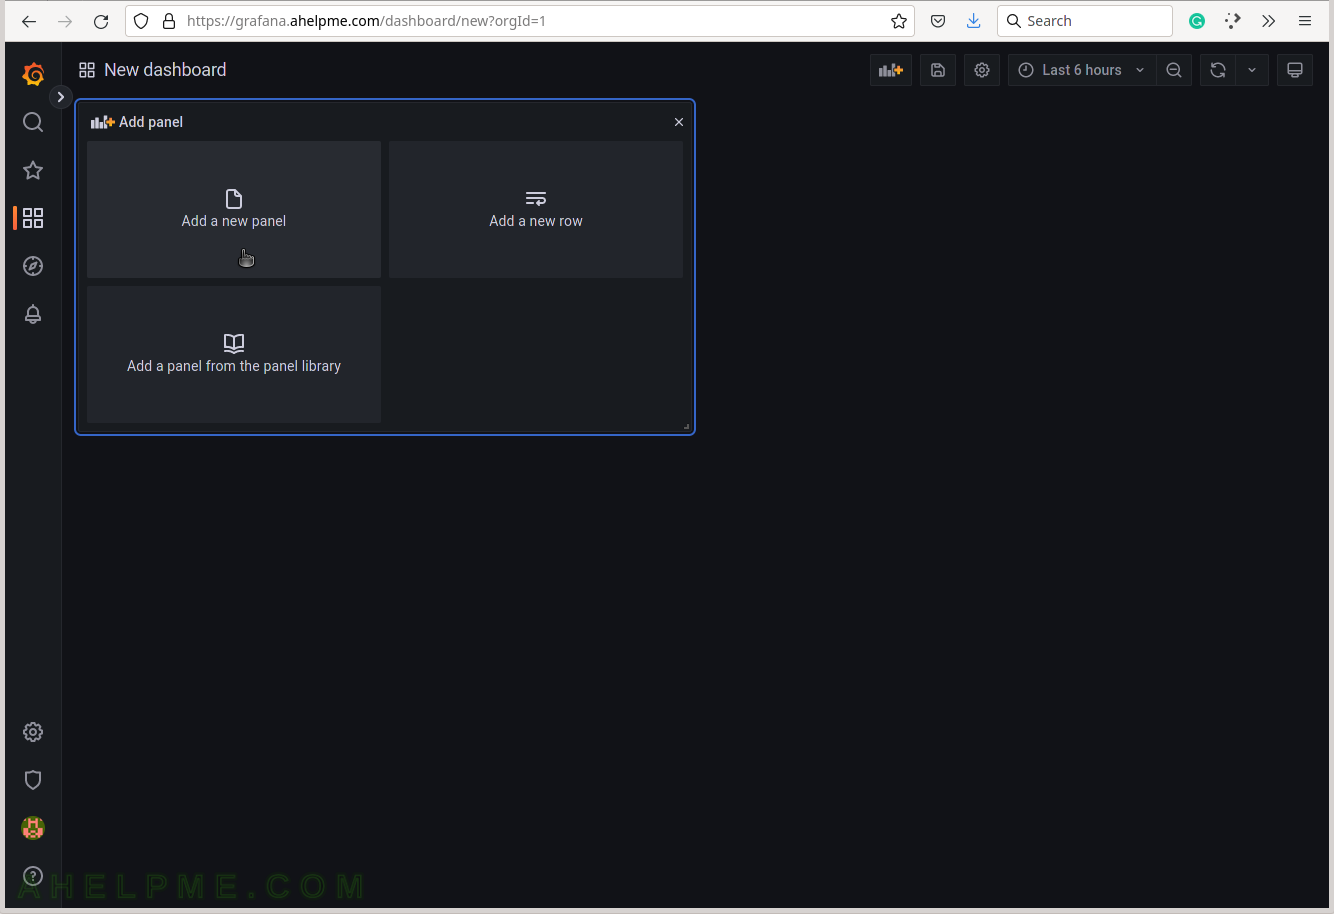
SCREENSHOT 2) Add a new panel in the new dashboard, which will contain the Processes statesgraph.
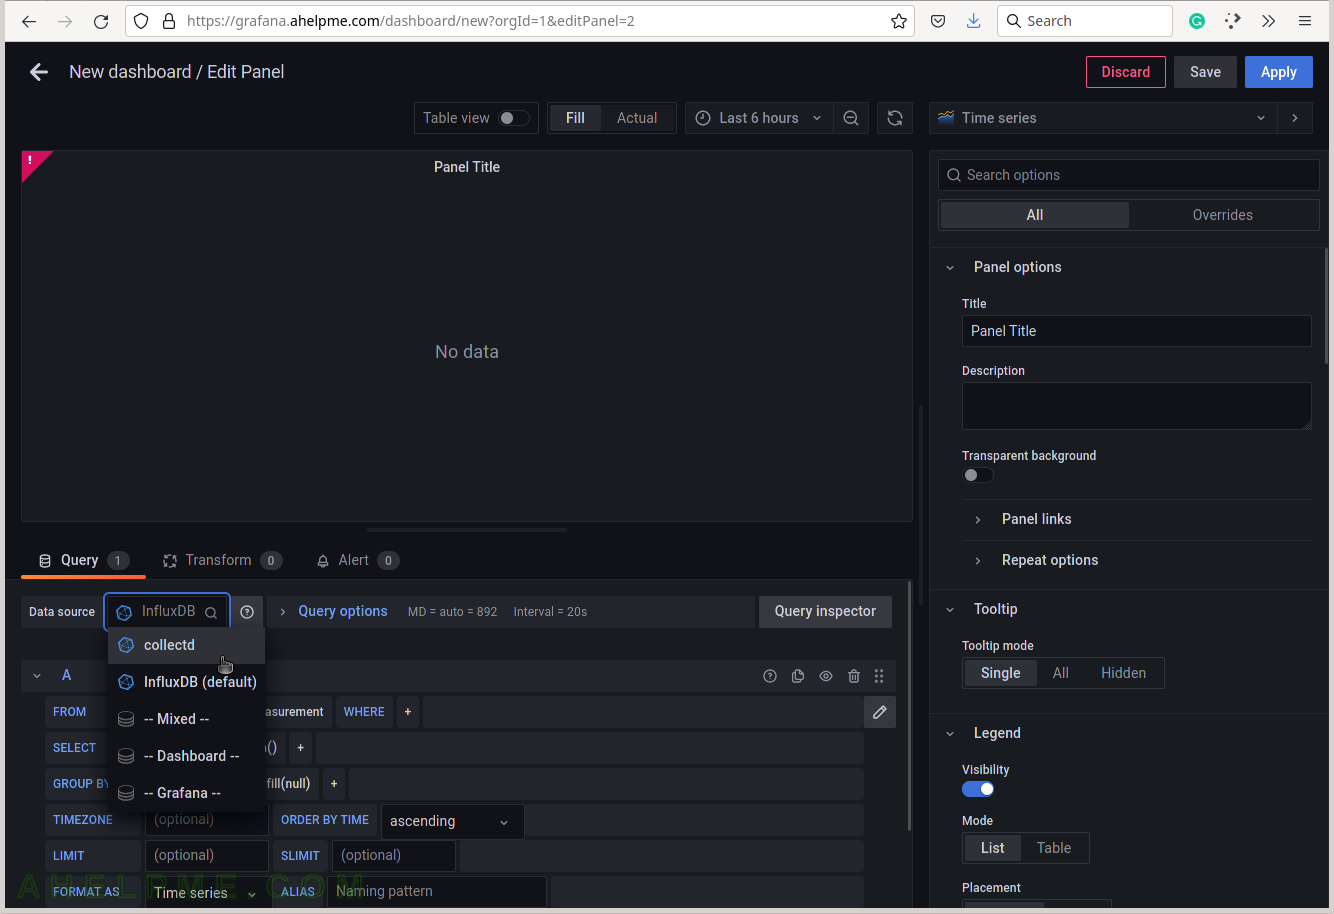
SCREENSHOT 3) Change the “Data Source” to the collectd (InfluxDB) database and ensure on the right top the graph type is “Time series”.
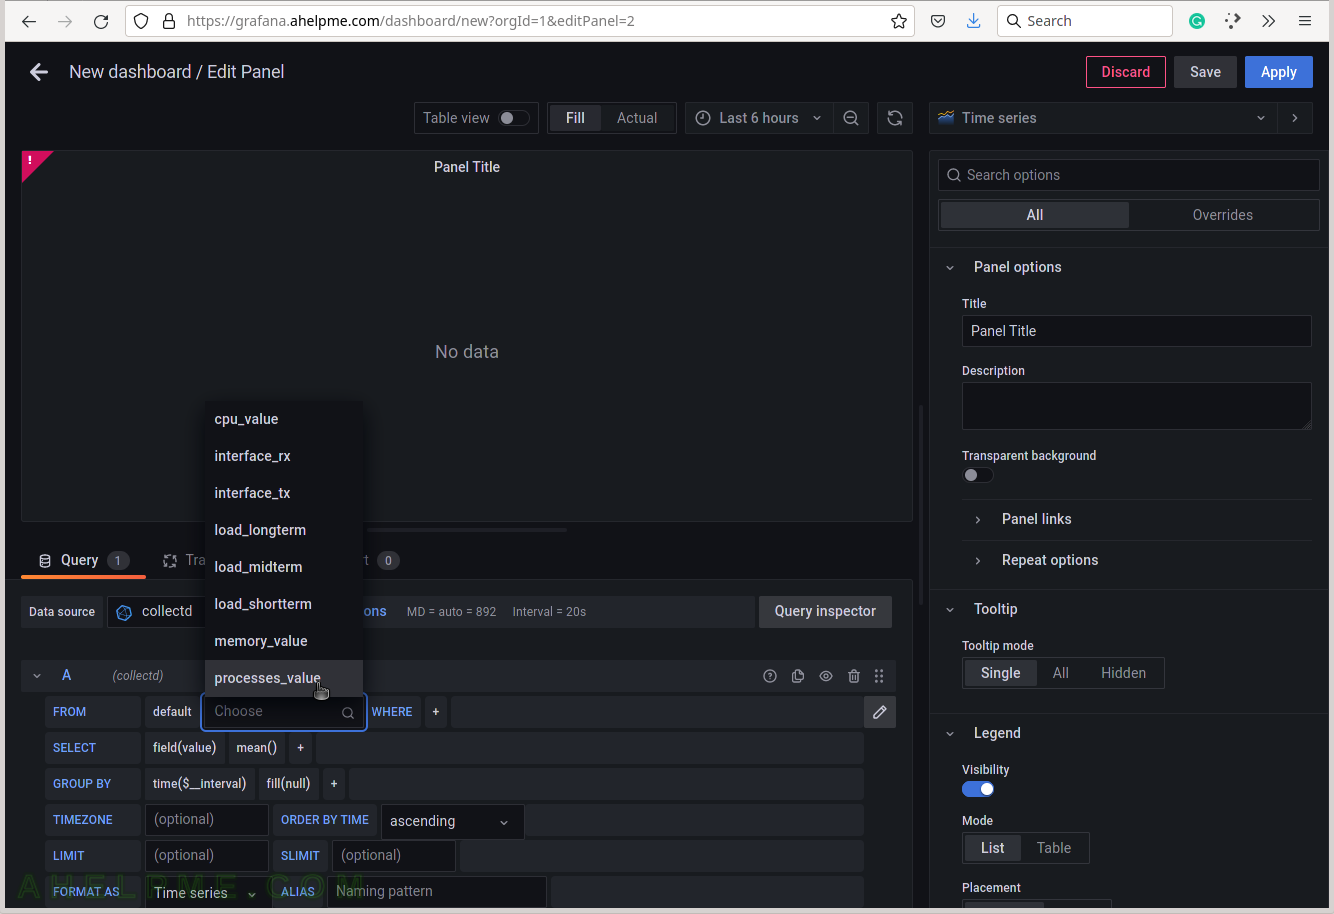
SCREENSHOT 4) Choose the processes_value from the measurement drop-down list.
There are all measurements in the drop-down list in the database collectd.
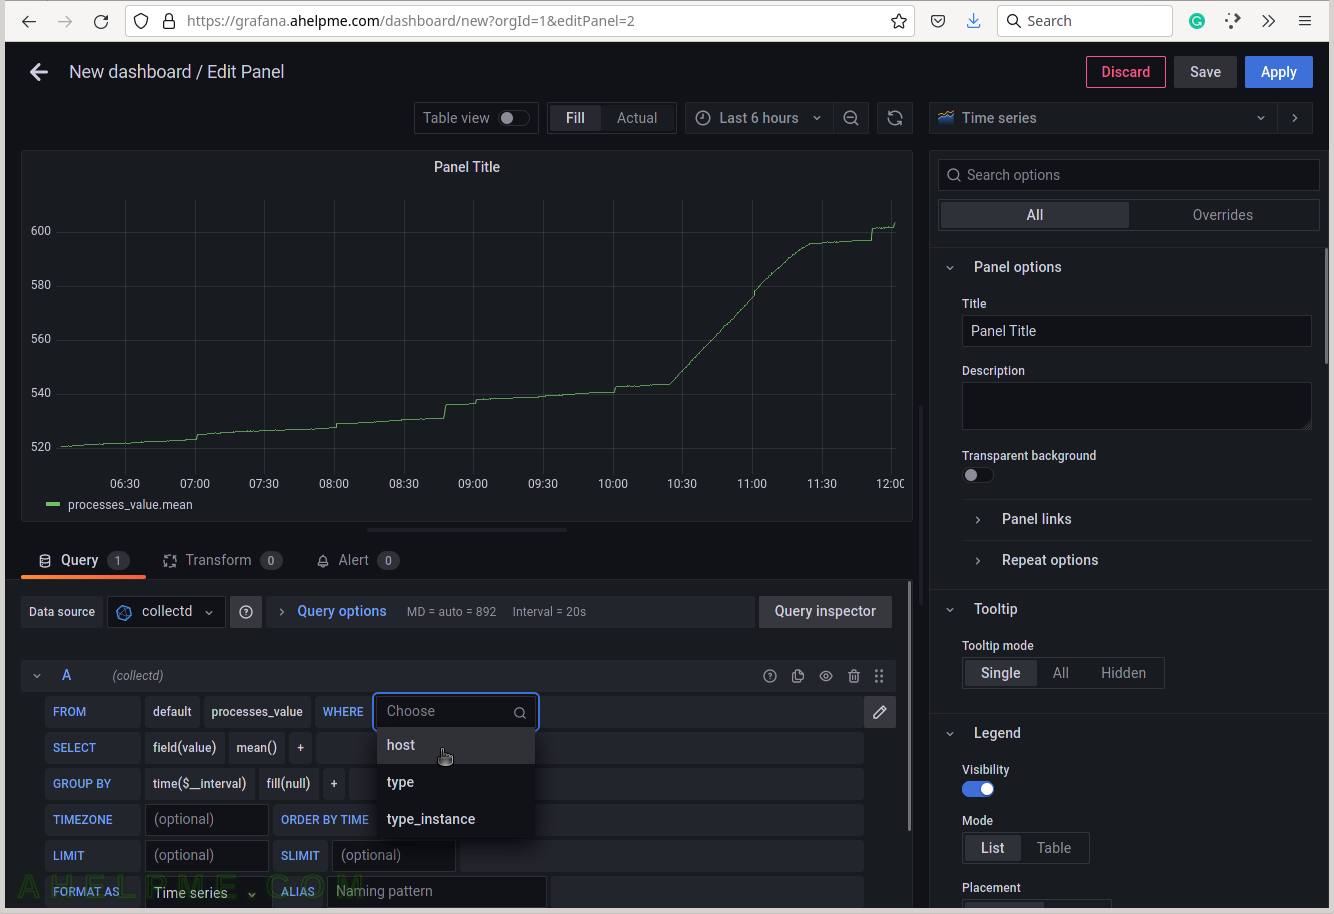
SCREENSHOT 5) Select the tag name “host” to limit the query for a selected hostname.
A tag is a key-value pair, which represents the metadata of a measurement record. For example, a measurement record consists of the actual measurement value and some metadata for it such as which did the measurement and where. The server hostname “srv” is the tag value and the tag key is the “host” name of the tag.
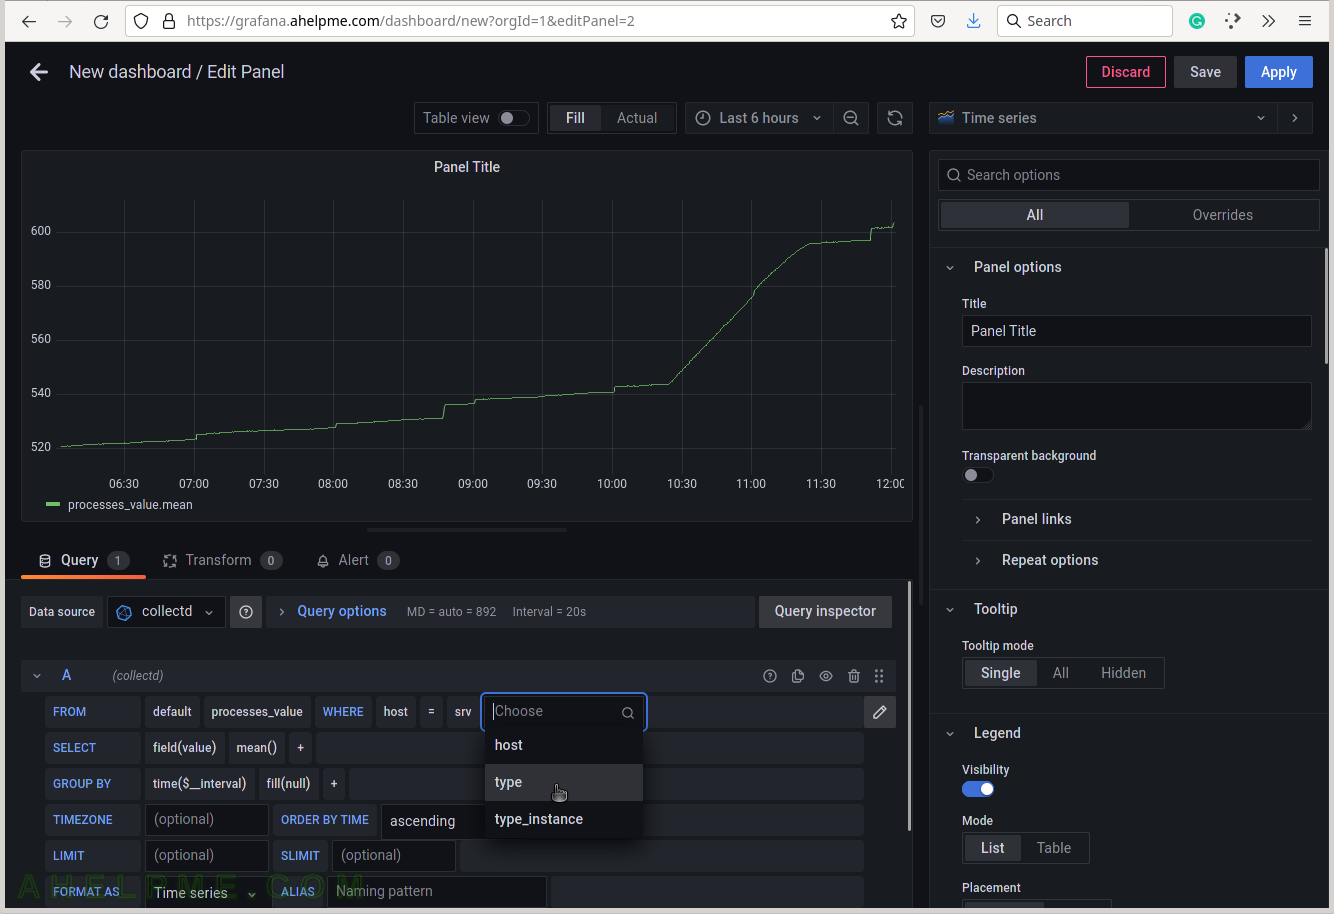
SCREENSHOT 6) Select the tag value “srv”.
This setup has only one server, so no other servers’ hostnames are shown.

SCREENSHOT 7) Select the type of measurement.
Yet another measurement metadata. The type of measurement is ps_state, i.e. the processes states.
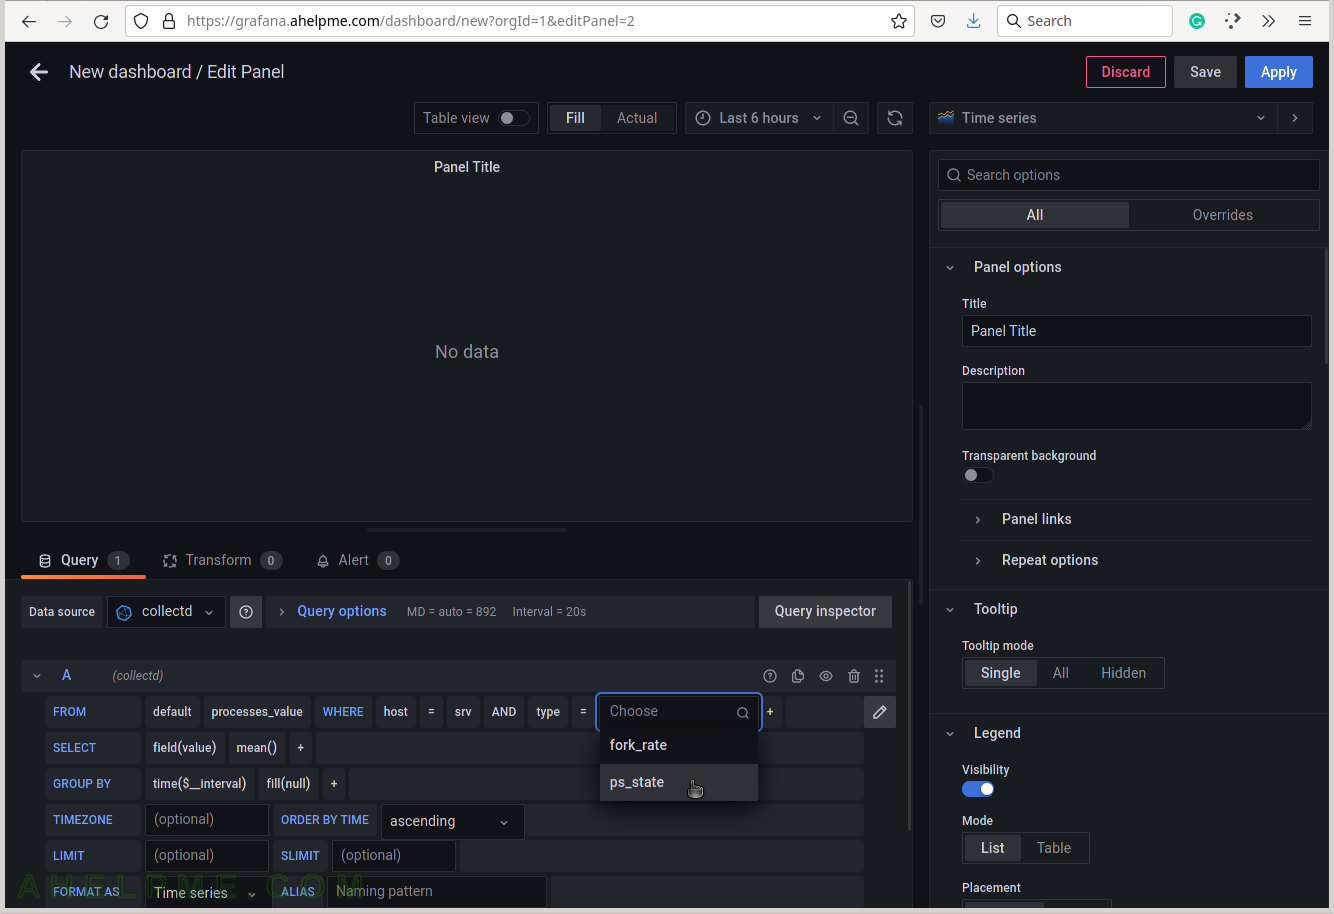
SCREENSHOT 8) Select ps_state for the tag value to draw processes states in the graph.
There is also another valid value fork_rate, which counts the forks occurrence in the system.
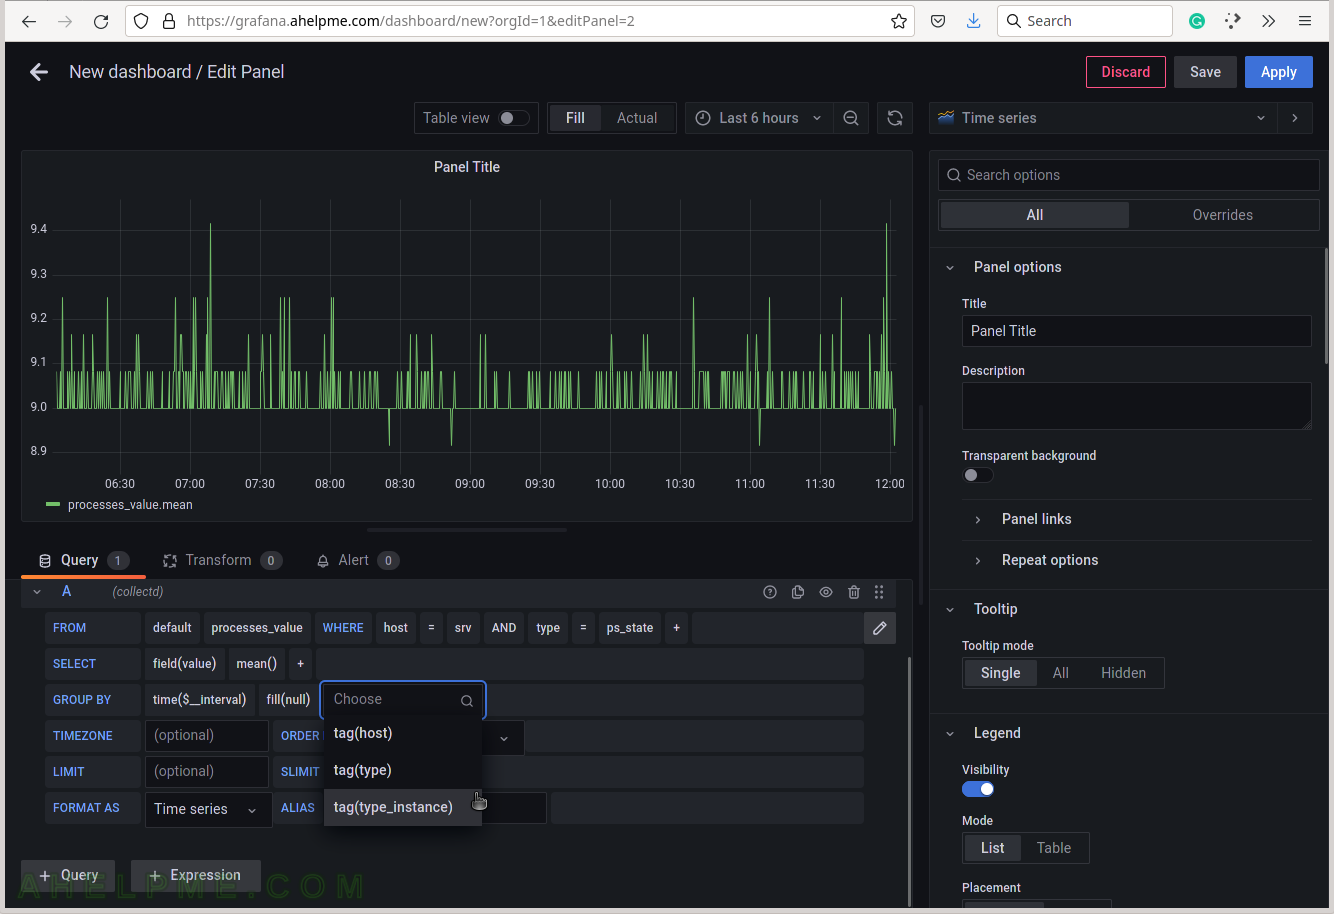
SCREENSHOT 9) Add a group by tag_instance to split the different tags in the graph.
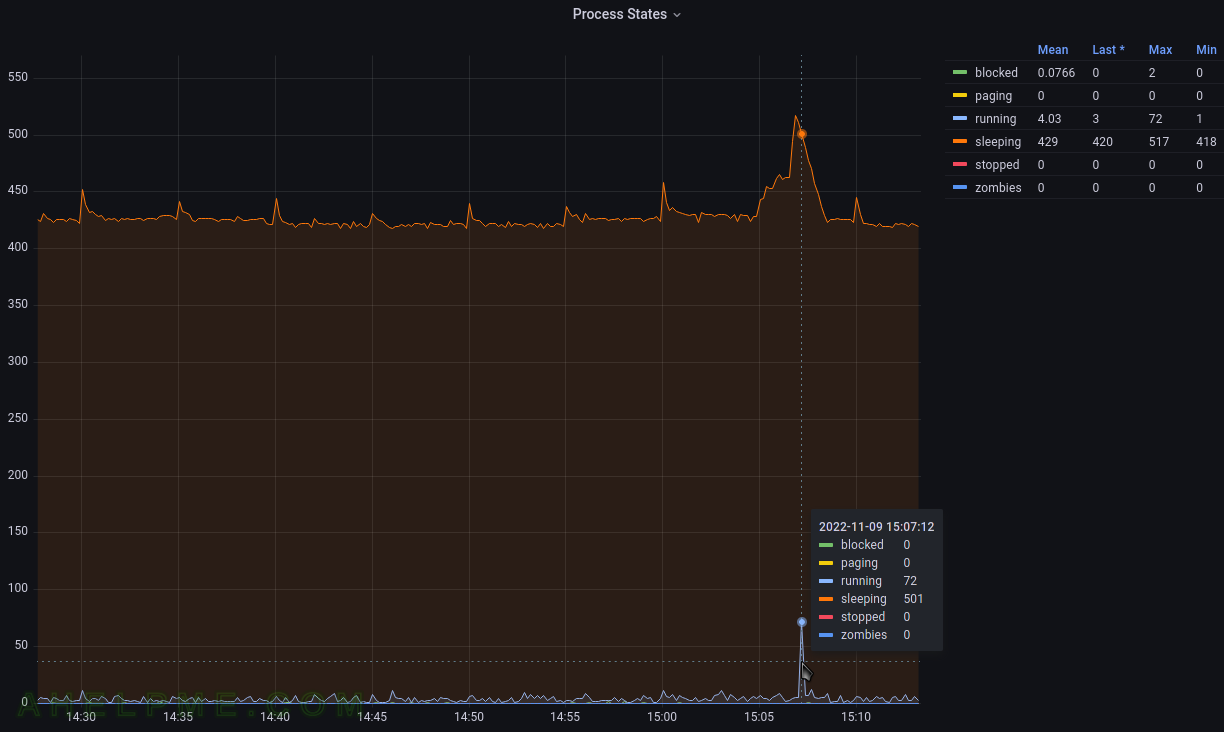
The tag_instance shows a process state, which is one of the follwoing: blocked, paging, running, sleeping, stopped and zombies.
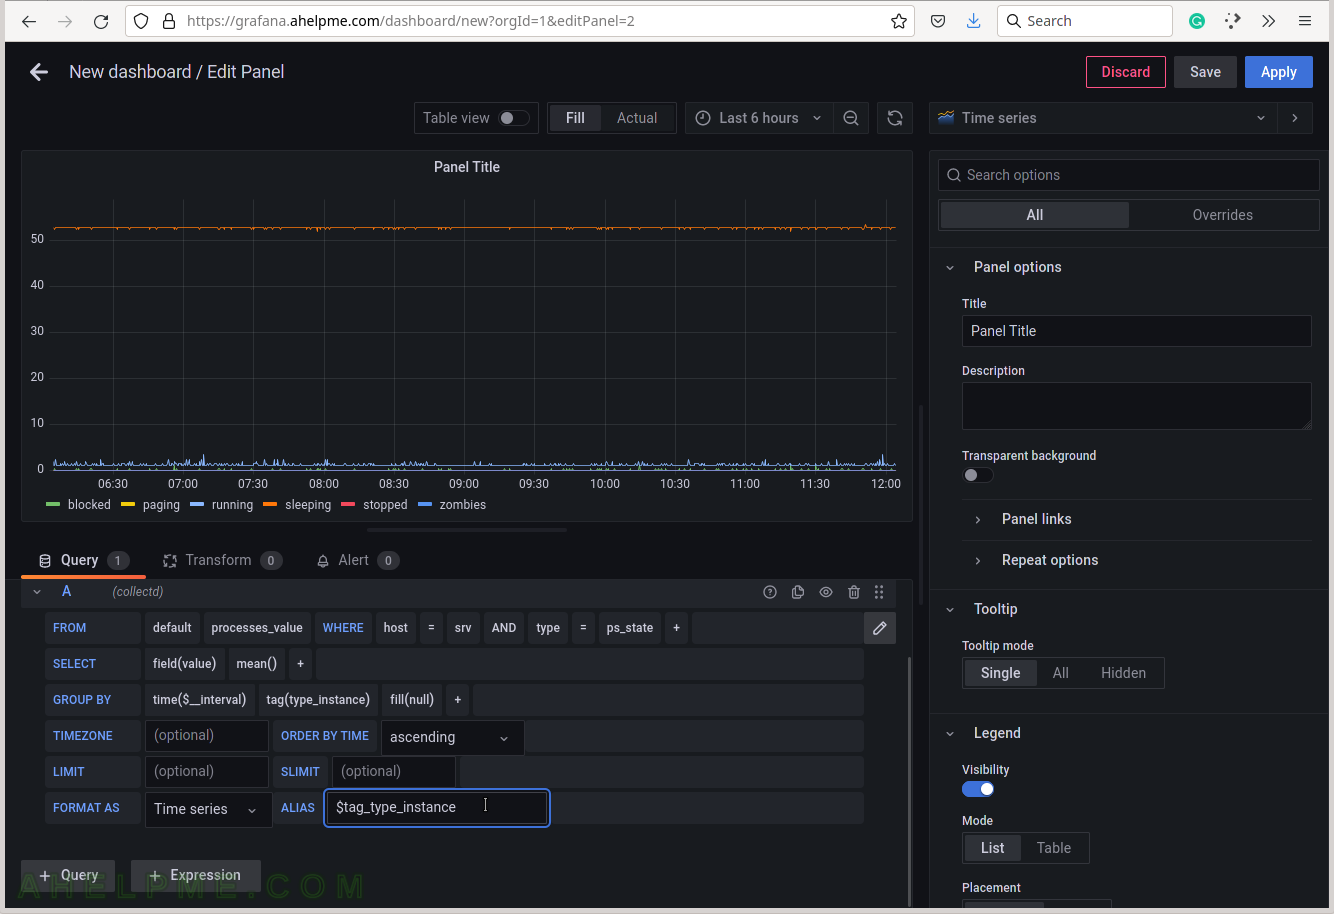
SCREENSHOT 10) To give pretty names to the tags in the graph’s legend add to the ALIAS a variable $tag_[tag_key] and in this case, the tag key is type_instance, so the variable will be $tag_type_instance.
There is an important variable “$__interval“, which may be edited and set to the rate of the original data (if applicable, not really for the processes states) or left as is to be computed each time based on the selected time frame of the graph (6 hours for this example).