SCREENSHOT 51) Disk Usage Analyzer shows in a tree with circular chart how much space is occupied by each directory.
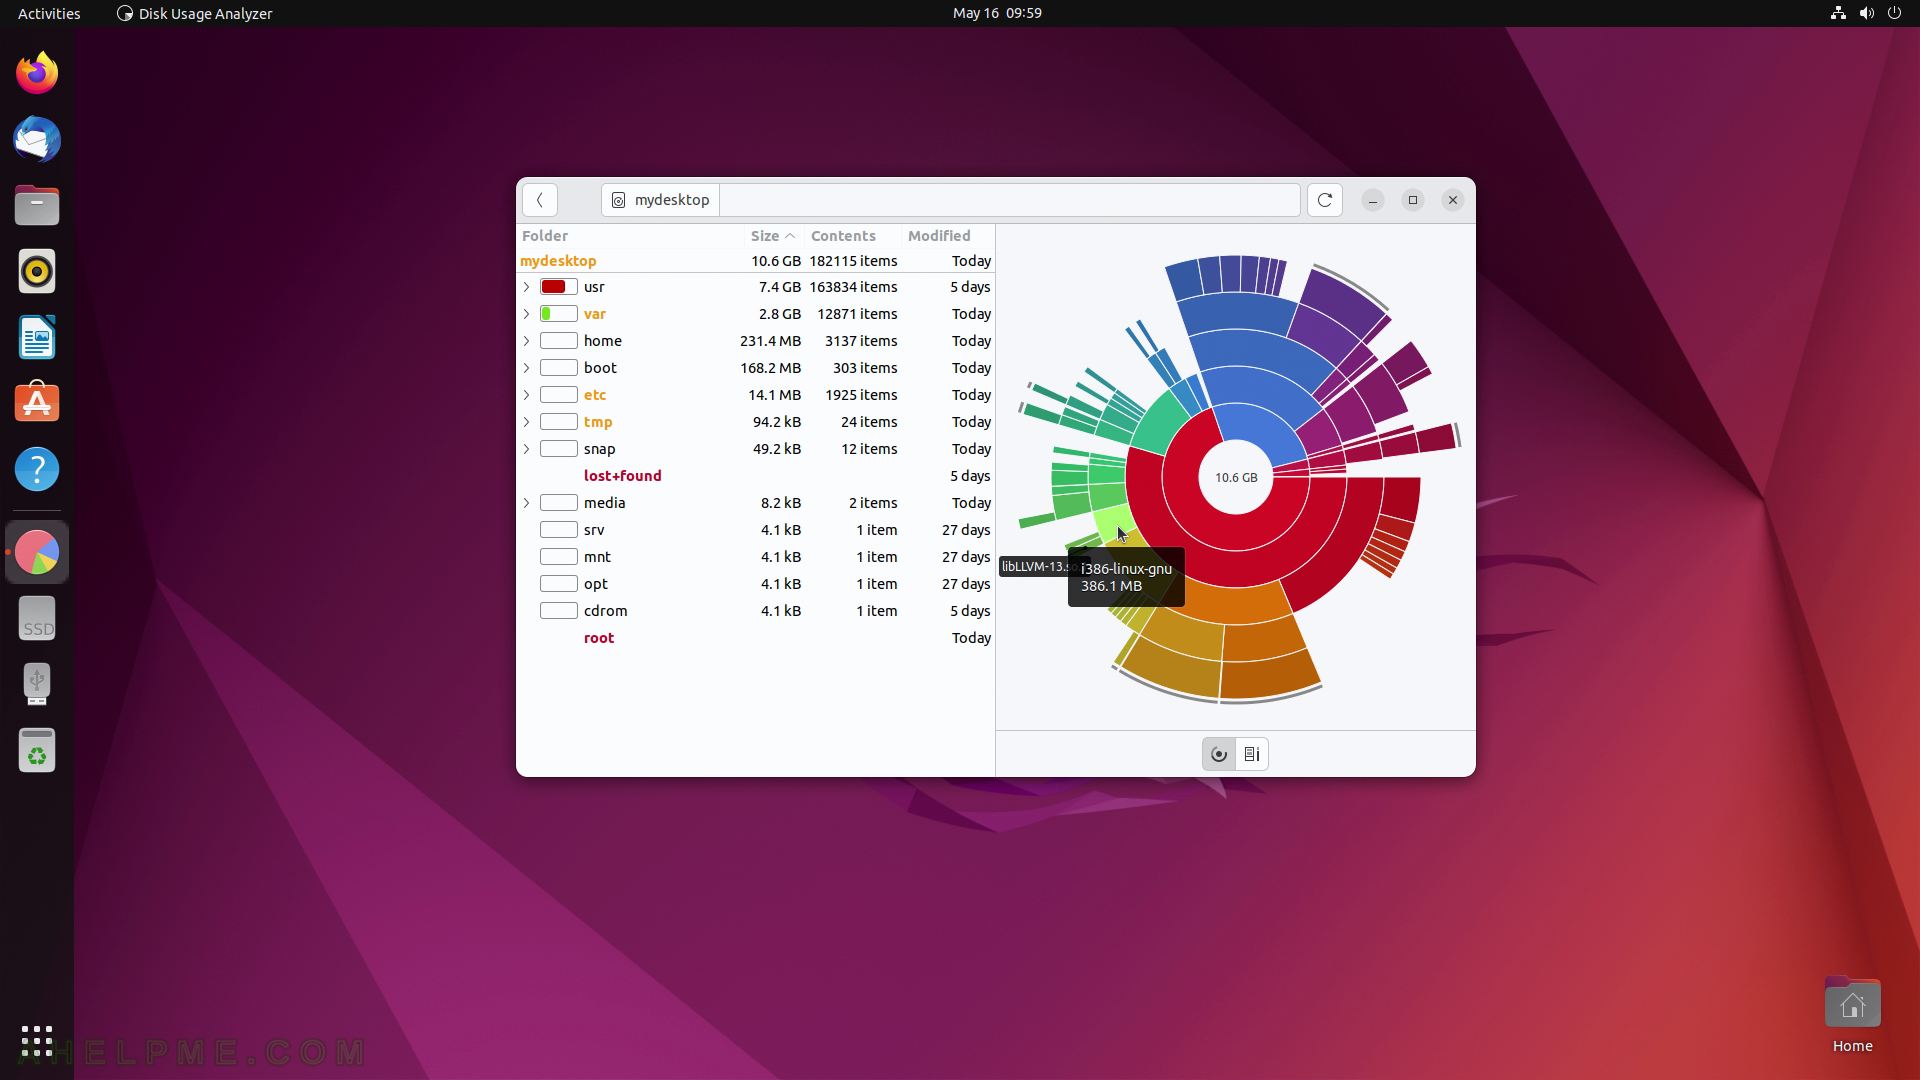
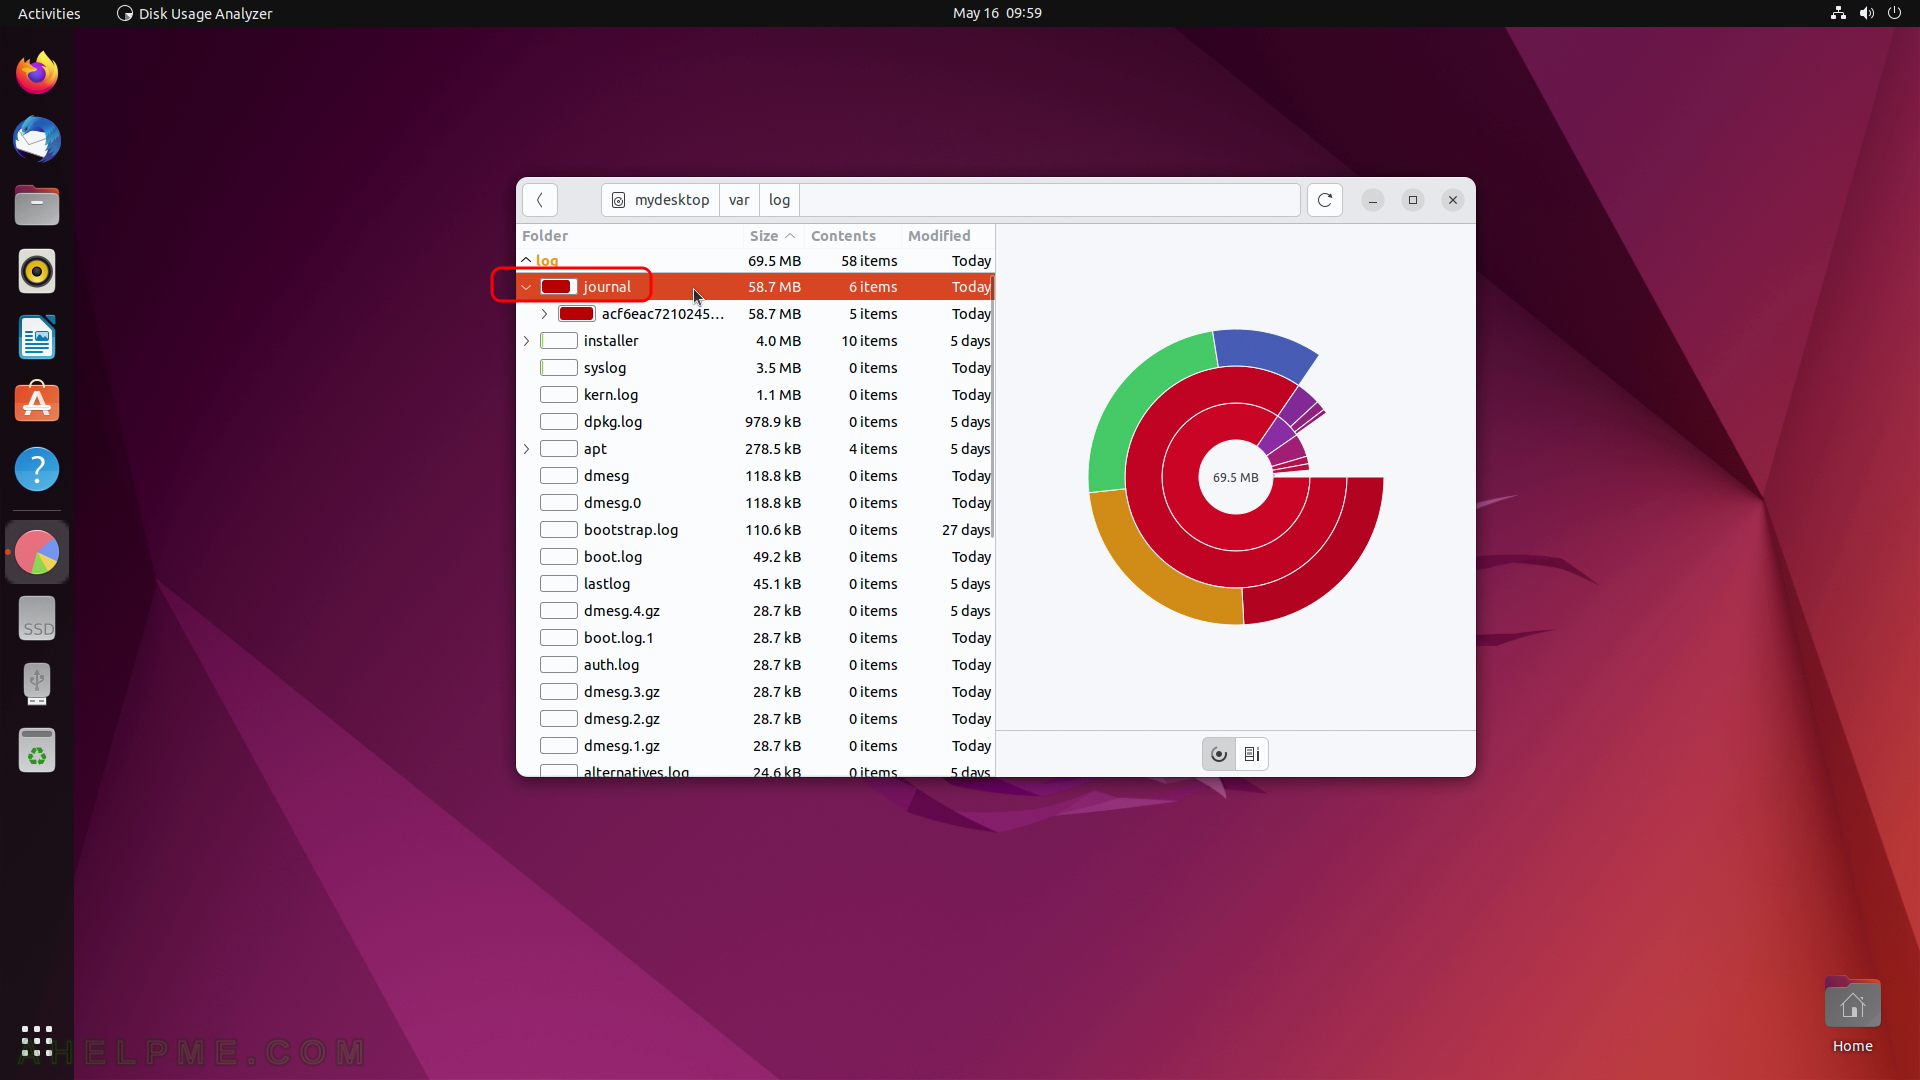
SCREENSHOT 52) To show a chart in the left for a folder, select it in the left.
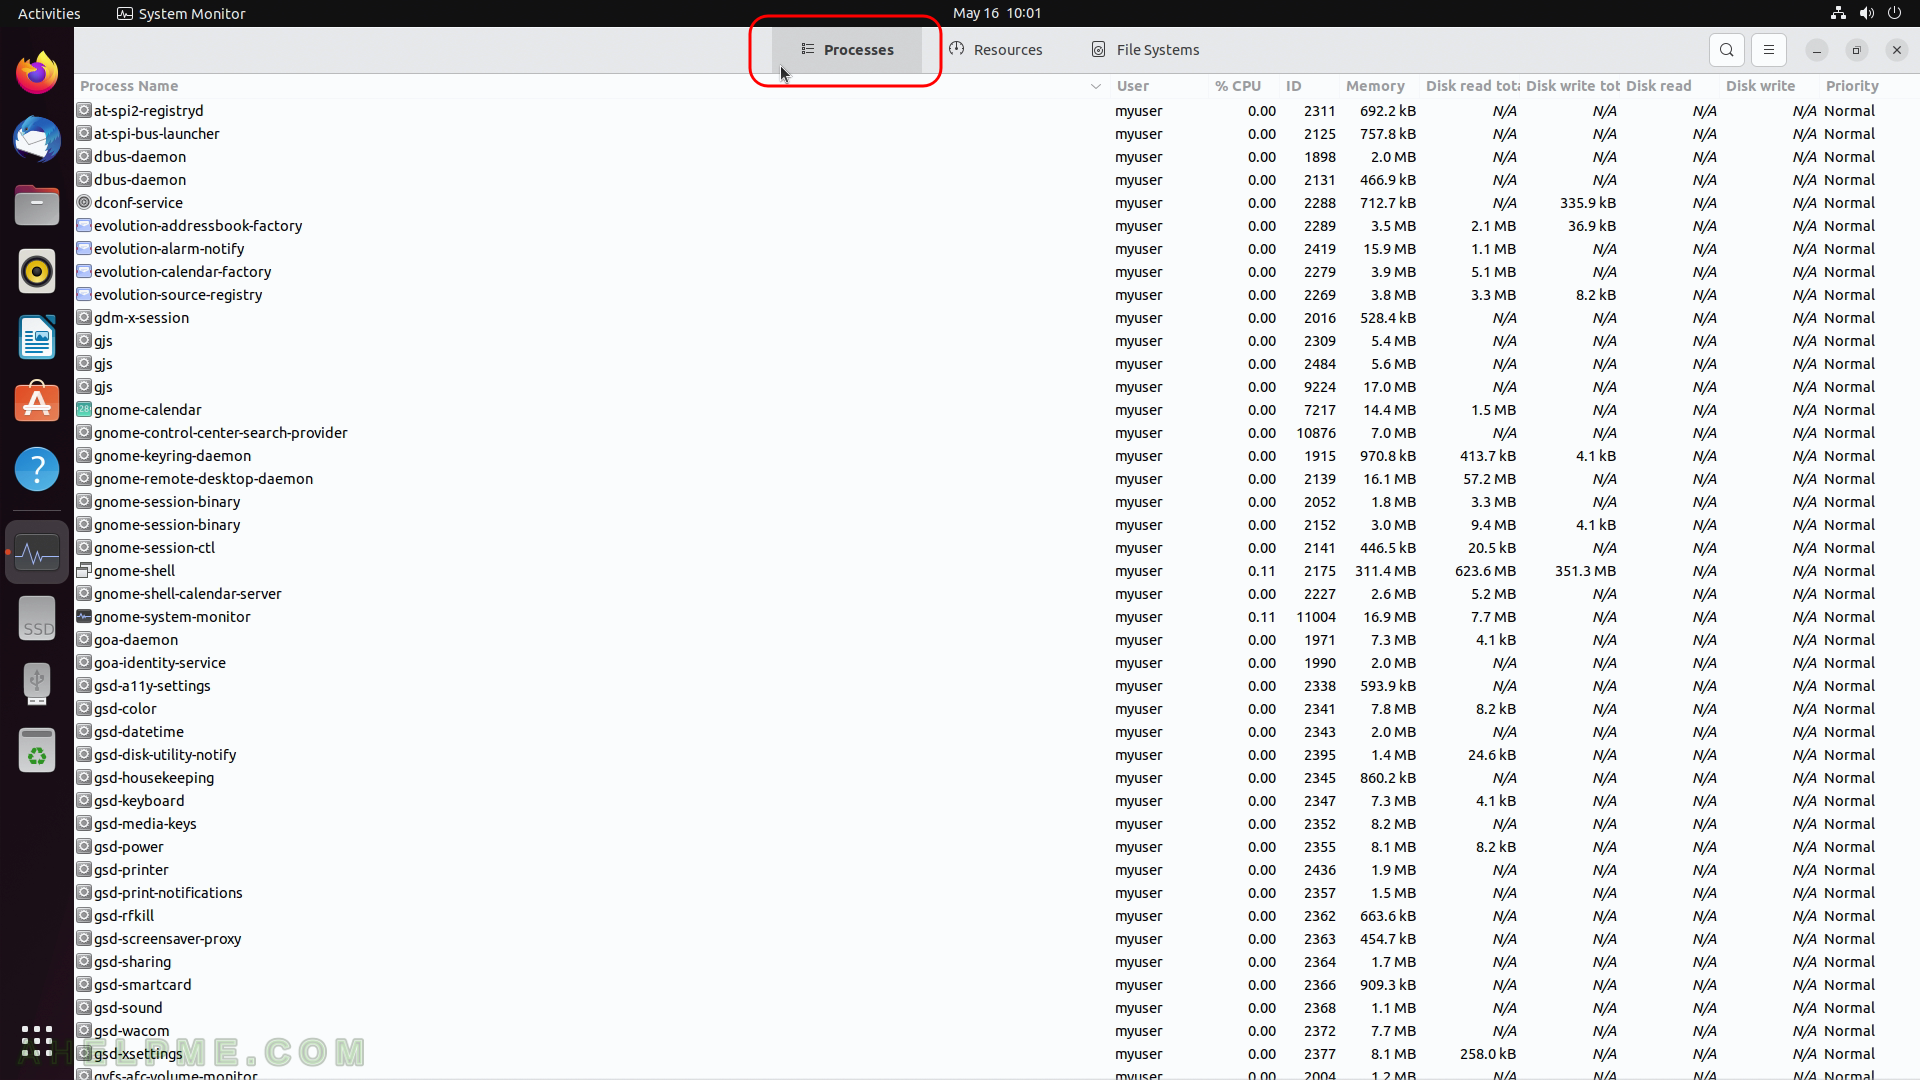
SCREENSHOT 53) System Monitor Processes section.
Processes information and metadata – User, % CPU, ID, Memory, Disk read total, Disk write total, Disk read, Disk write, Priority and etc.
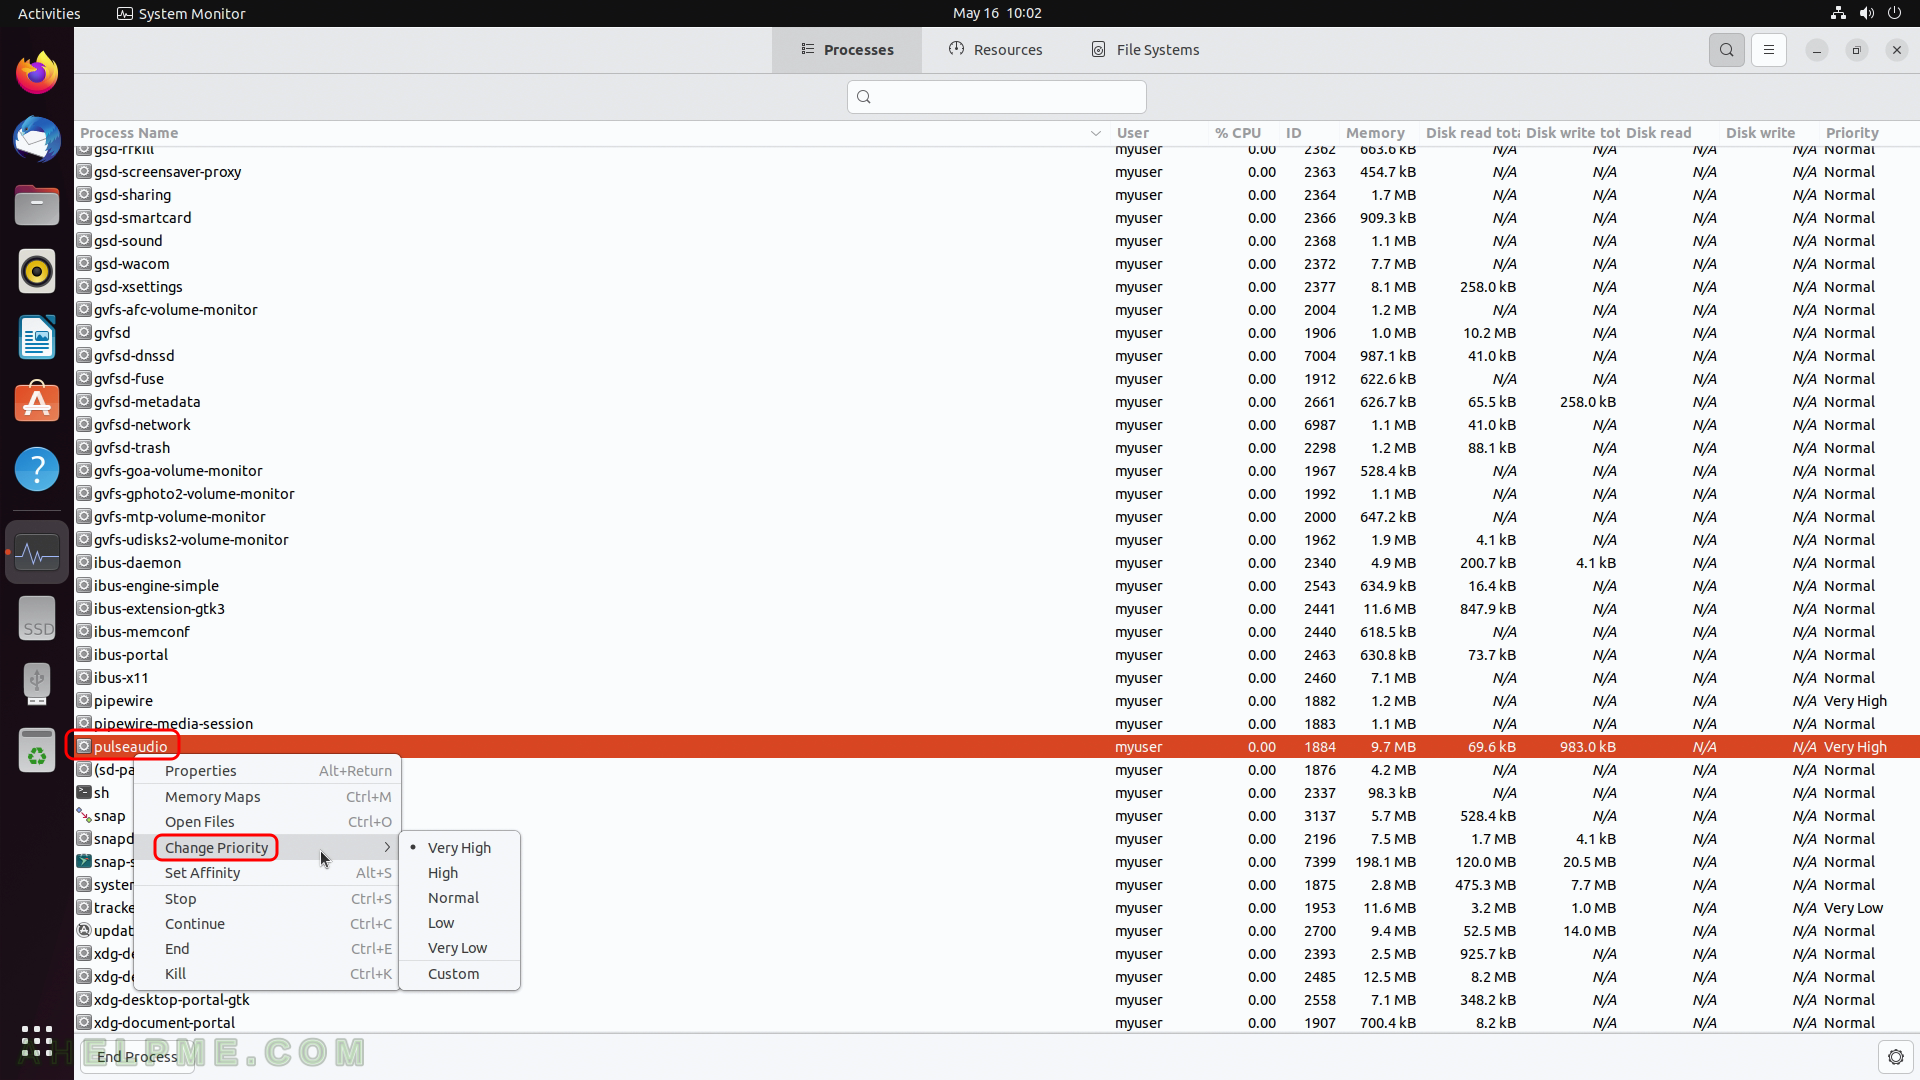
SCREENSHOT 54) Context menu of a process
Properties, Memory maps, Open Files, Change Priority (Very High, High, Normal, Low, Very Low, Custom), Stop, Continue, End, Kill.
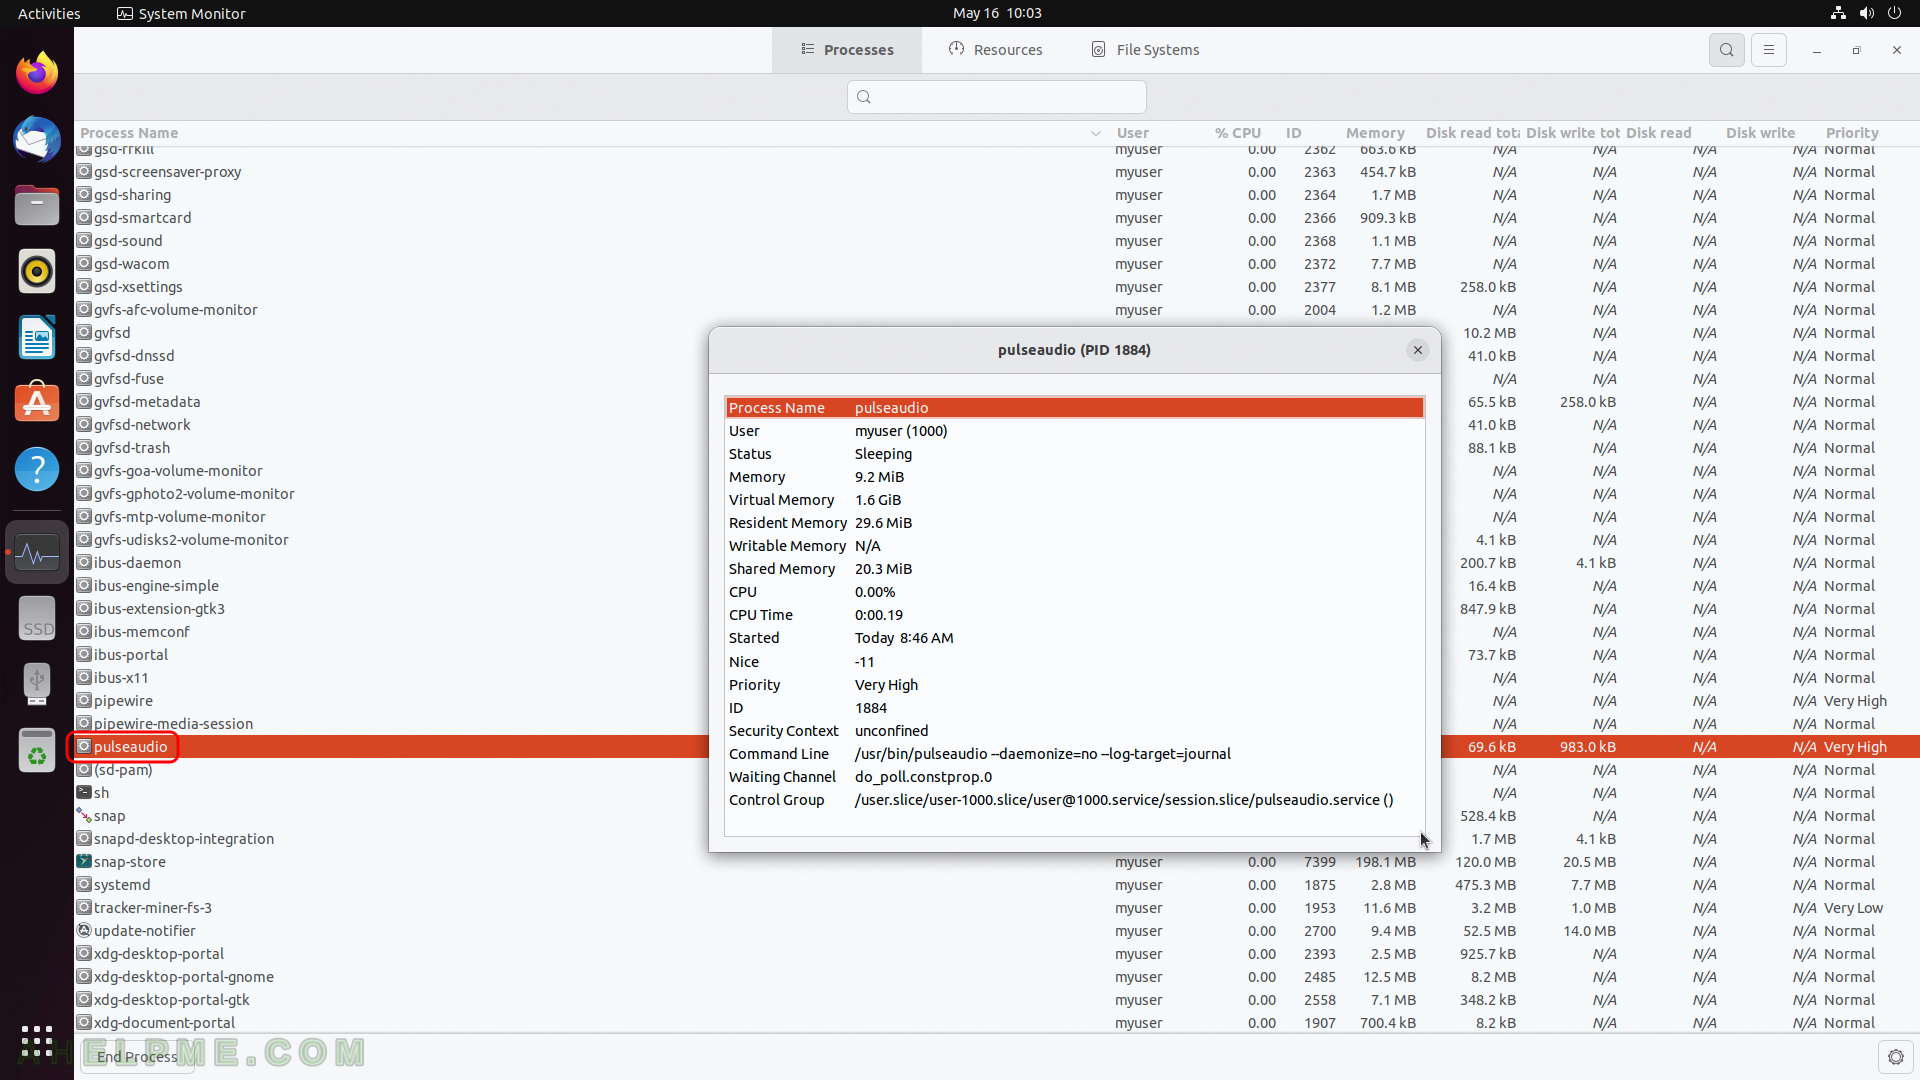
SCREENSHOT 55) Tha application shows – Process Name, User, Status, Memory, Virtual Memory, Resident Memory, Writable Memory, Shared Memory, CPU, CPU Time, Started, Nice, Priority, ID, Security Context, Command Line, Waiting Channel, Control Group.
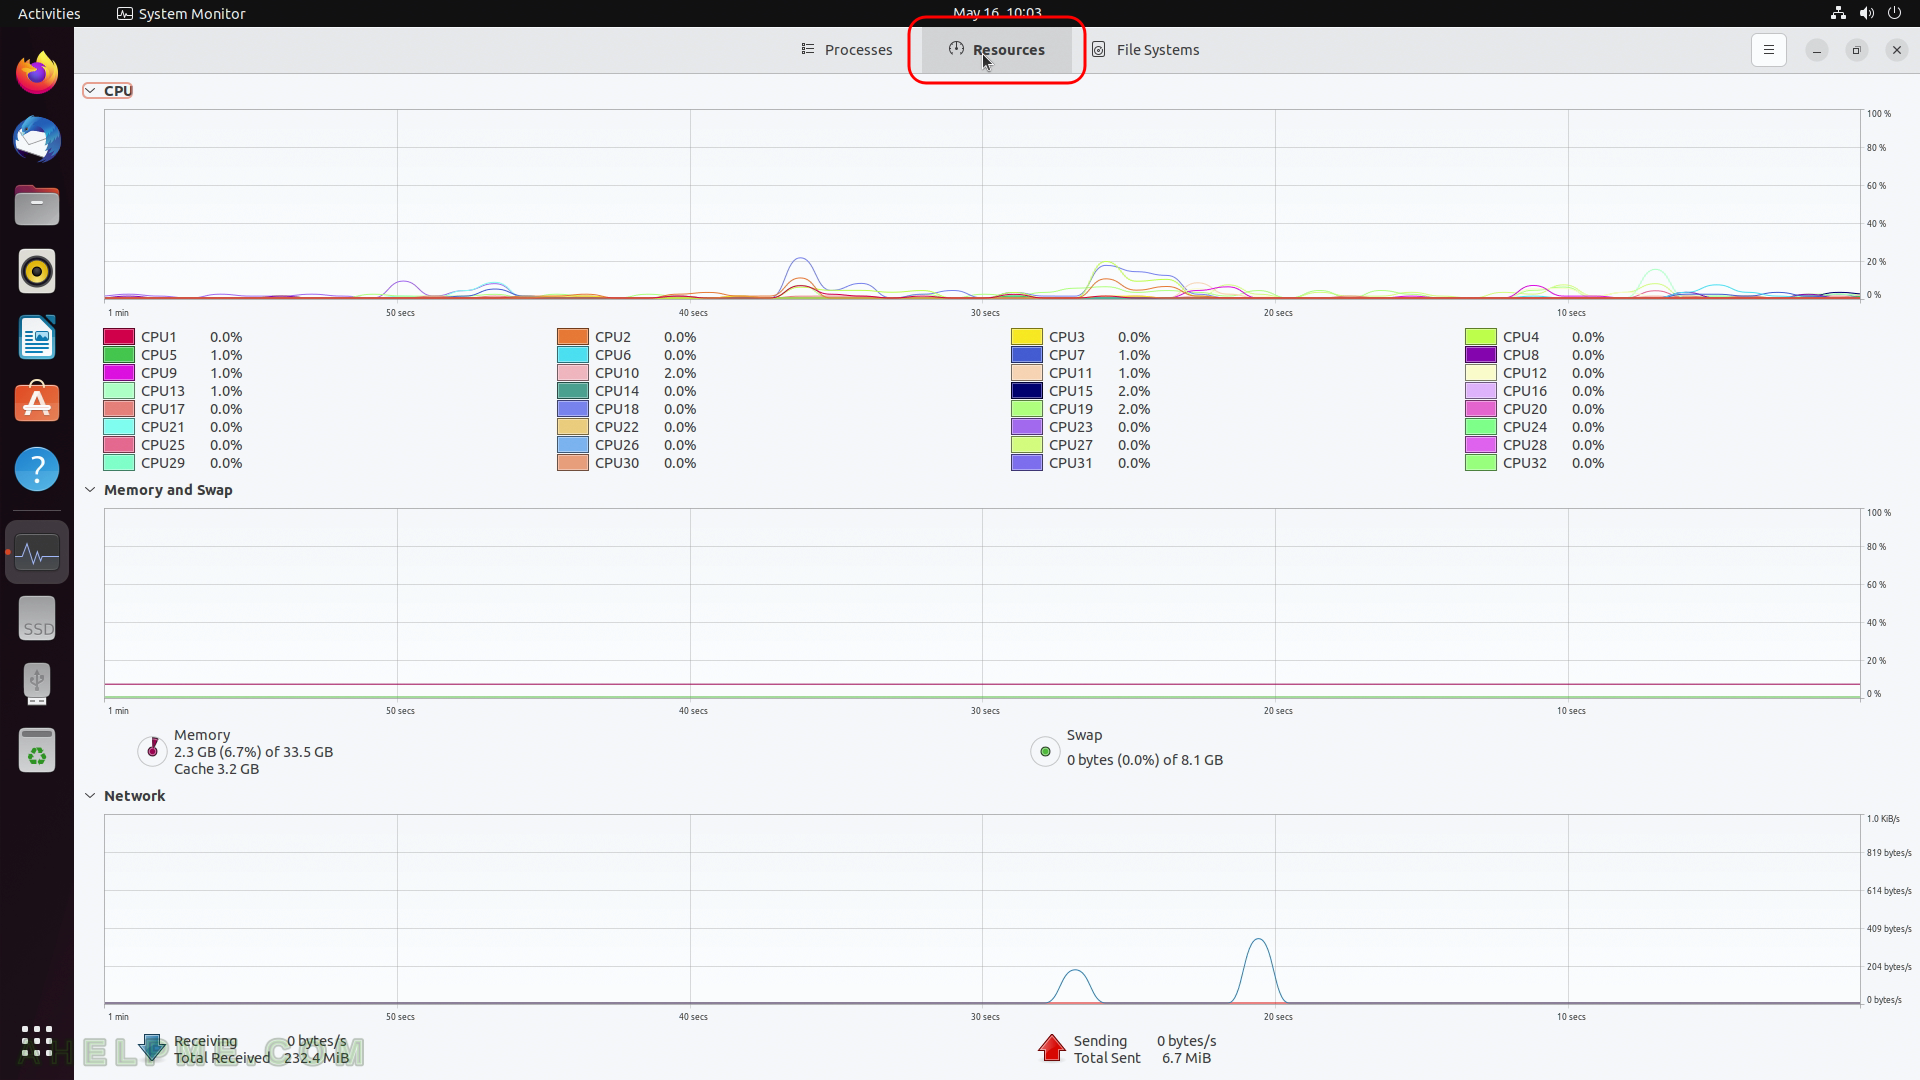
SCREENSHOT 56) Graphs of CPU History, Memory and Swap History and Network History.
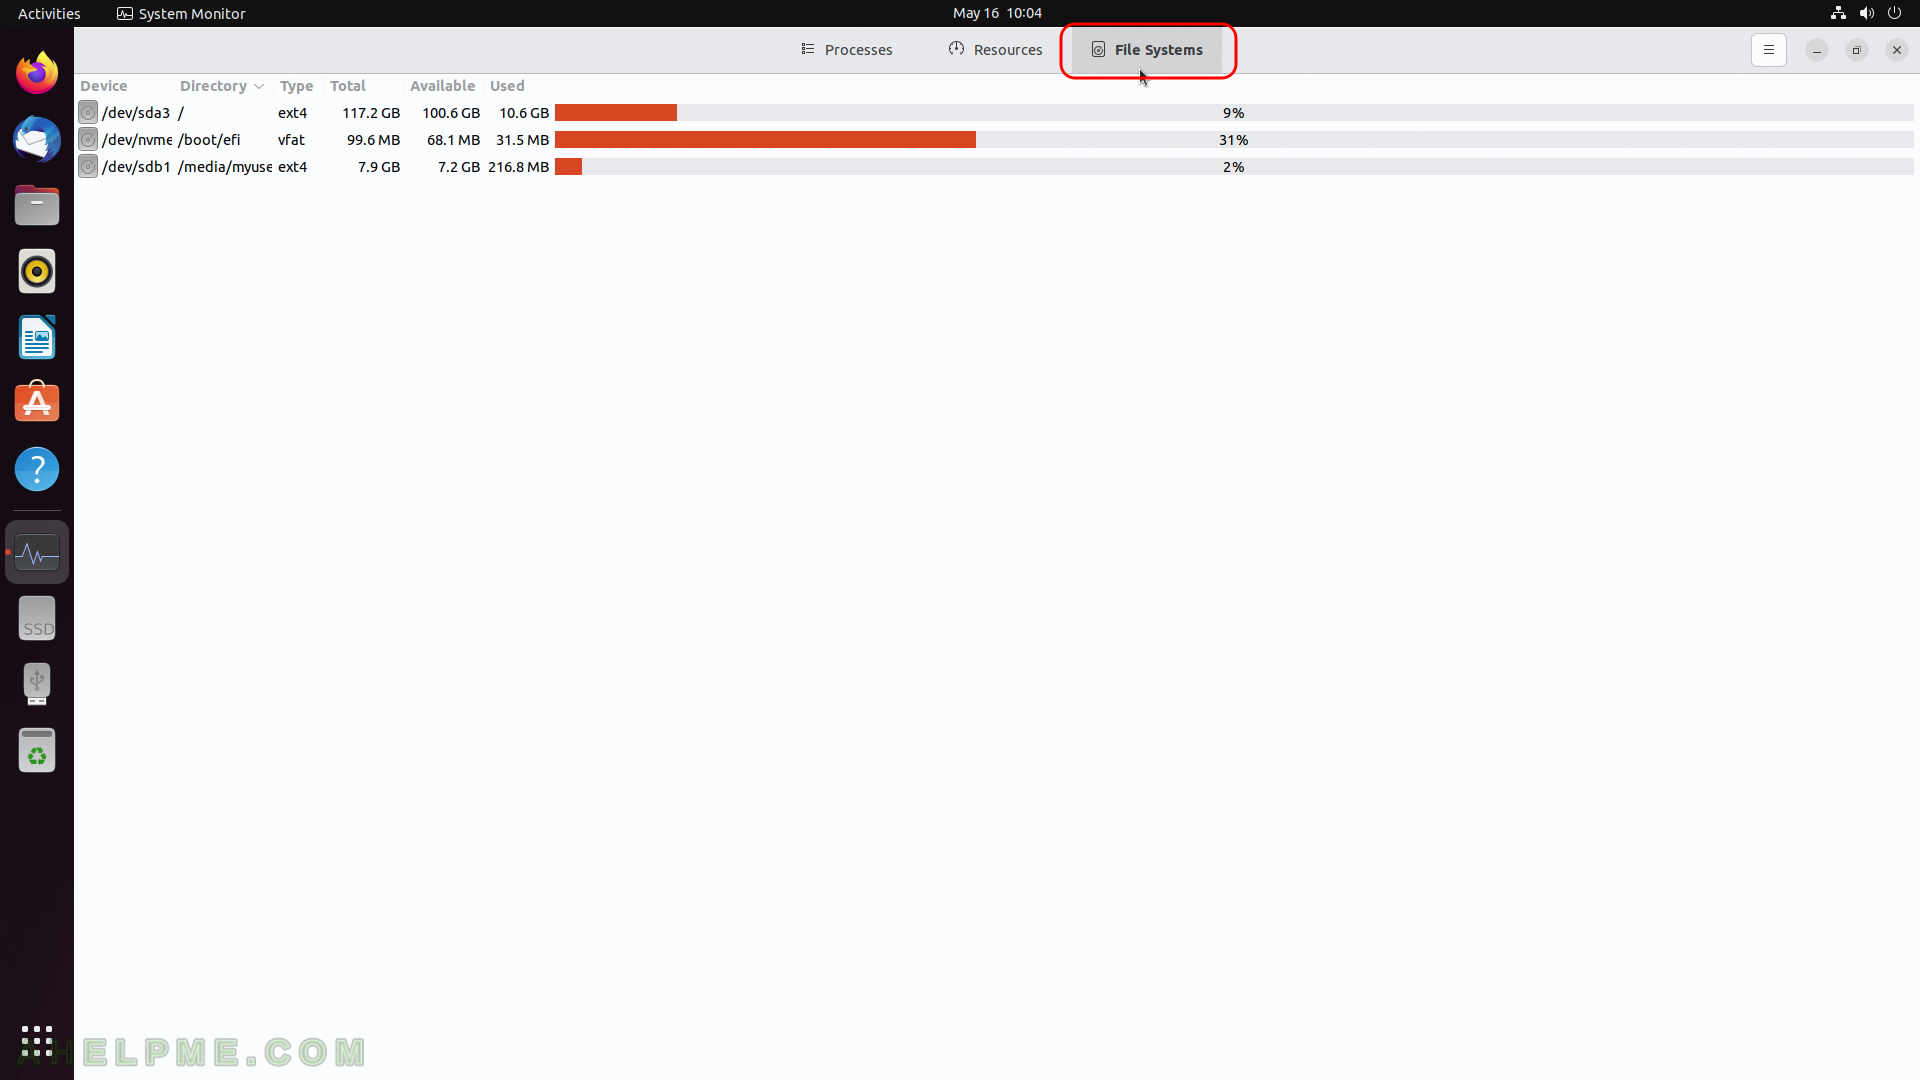
SCREENSHOT 57) System Monitor – File Systems
The current computer contains 3 file systems and the information is shown in the columns – Device, Directory (where is it mounted), Type, Total, Available, Used and charts.
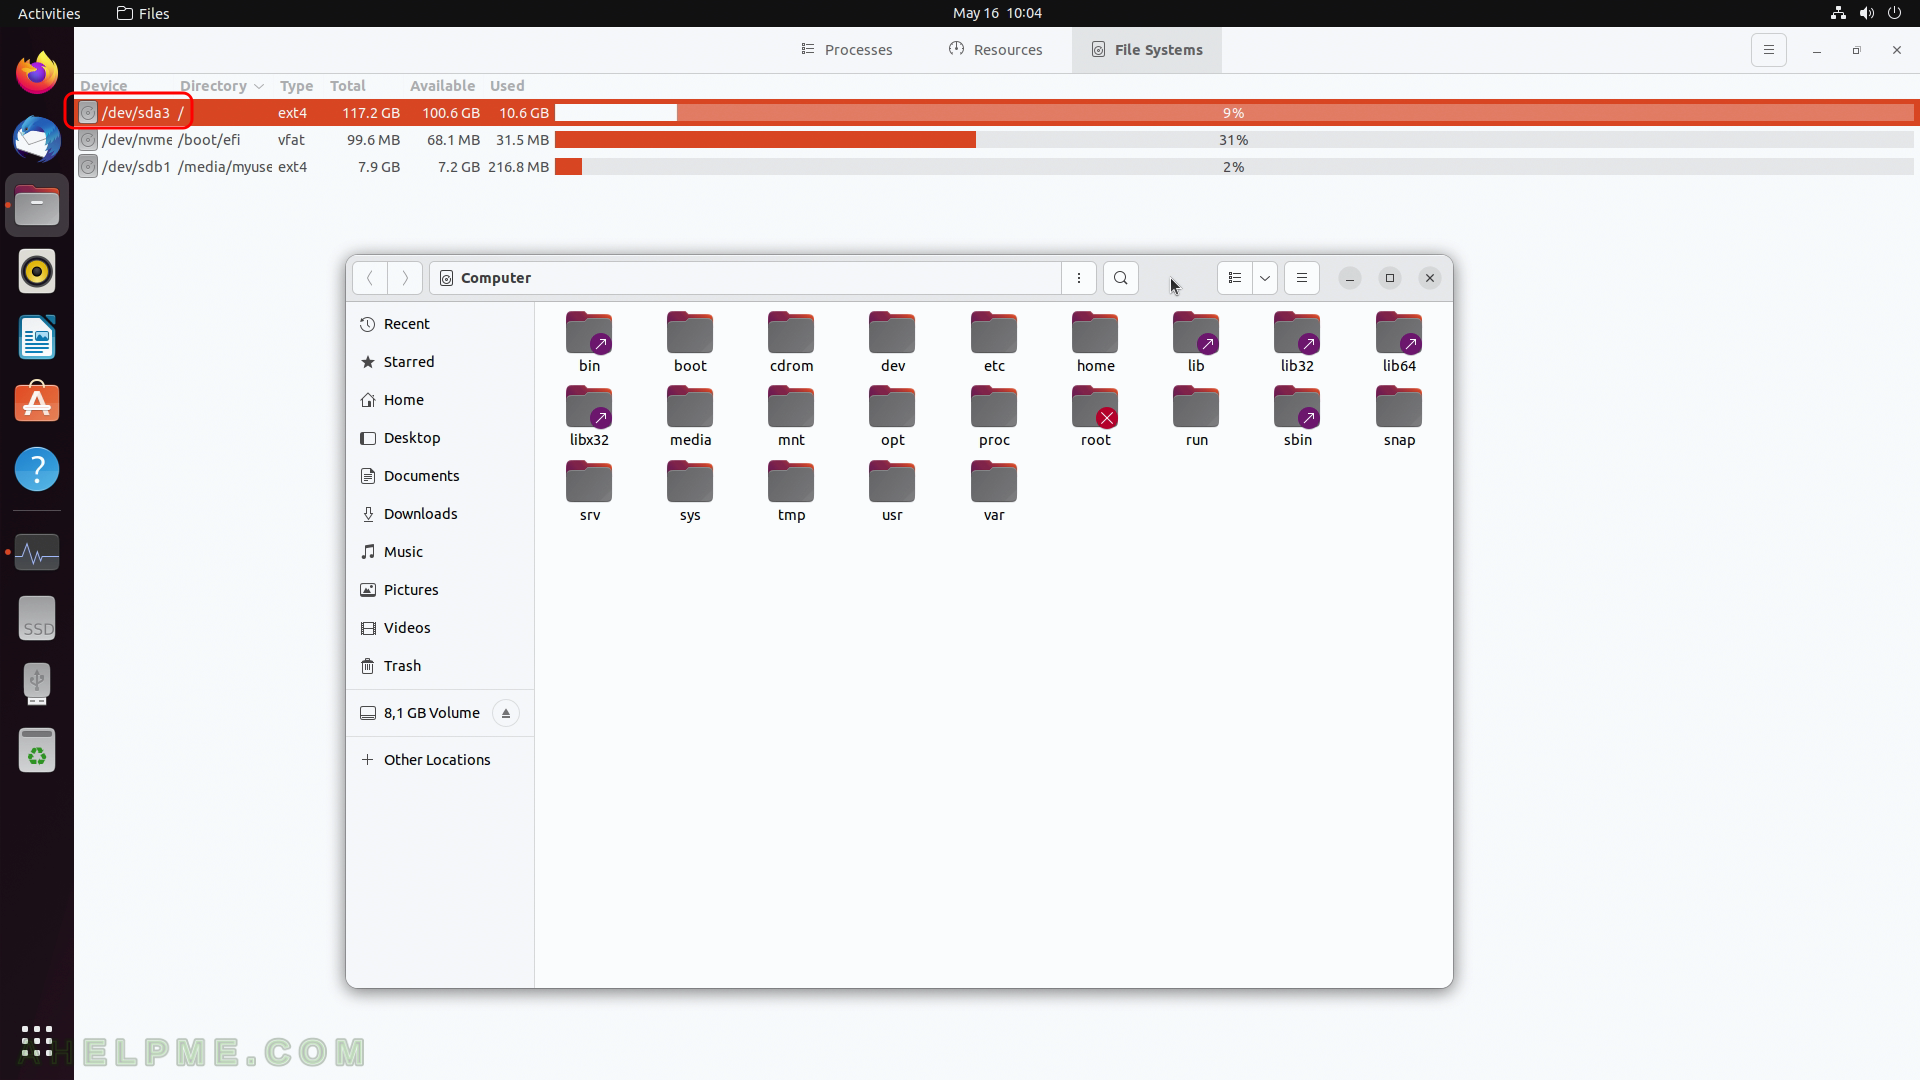
SCREENSHOT 58) System Monitor – File Systems – folder manager.
Clicking on one of the deivces opens a folder manager to explore the file system.
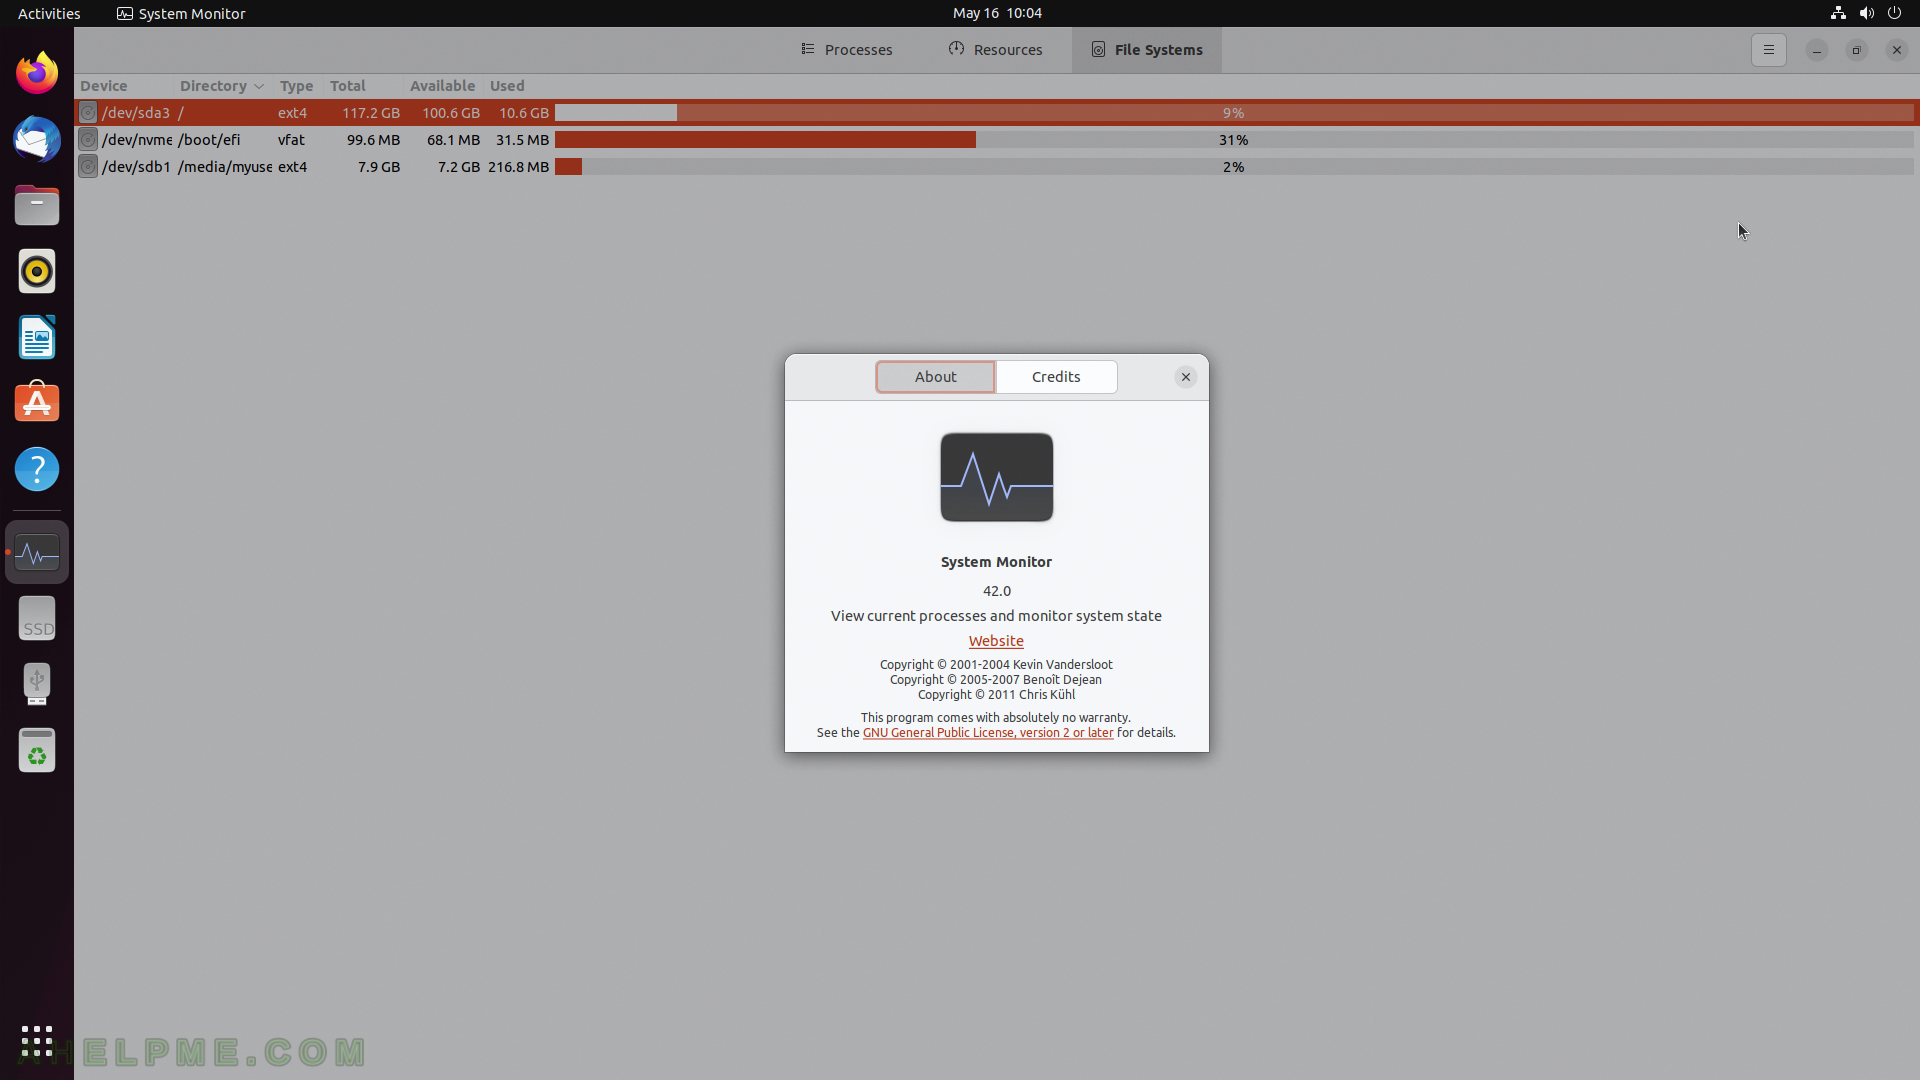
SCREENSHOT 59) Utilities – System Monitor – 42.0
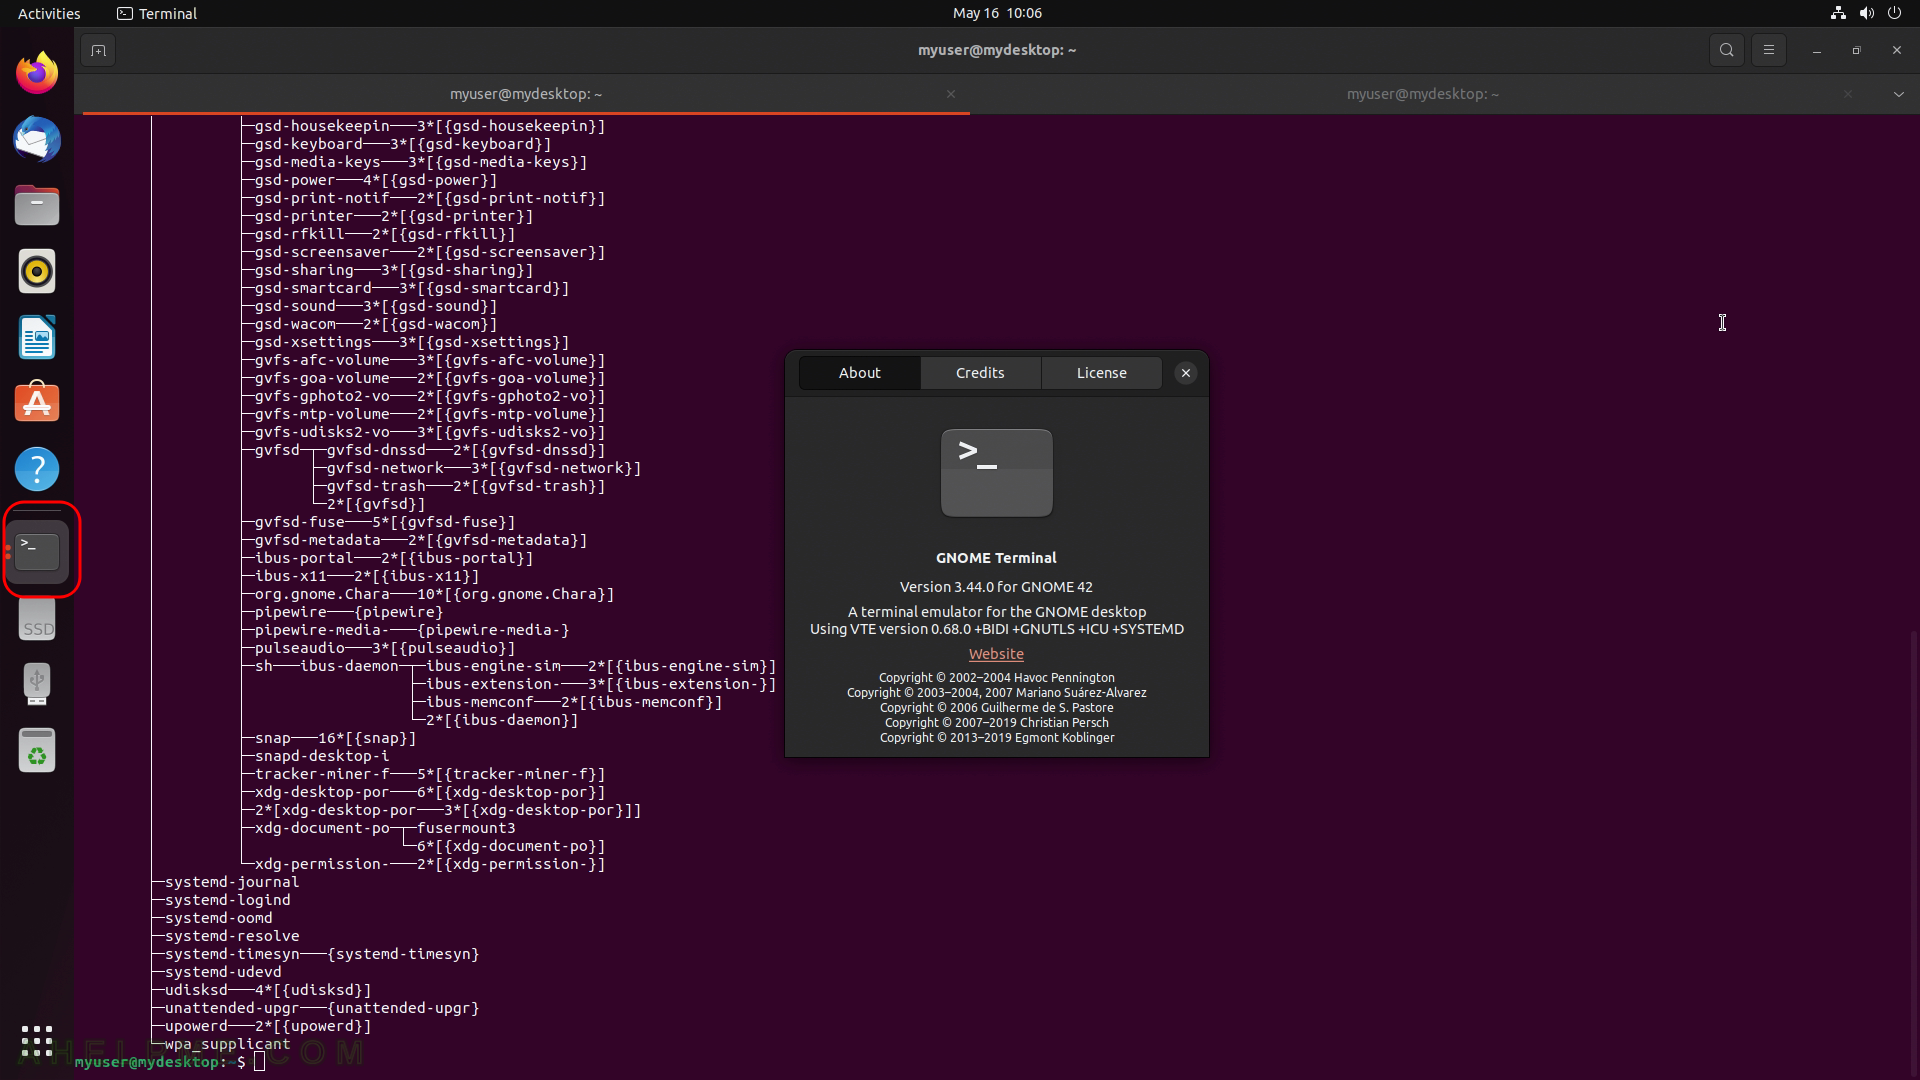
SCREENSHOT 60) Terminal 3.44.0 for Gnome
There two tabs opened and a pstree command executed in active one.