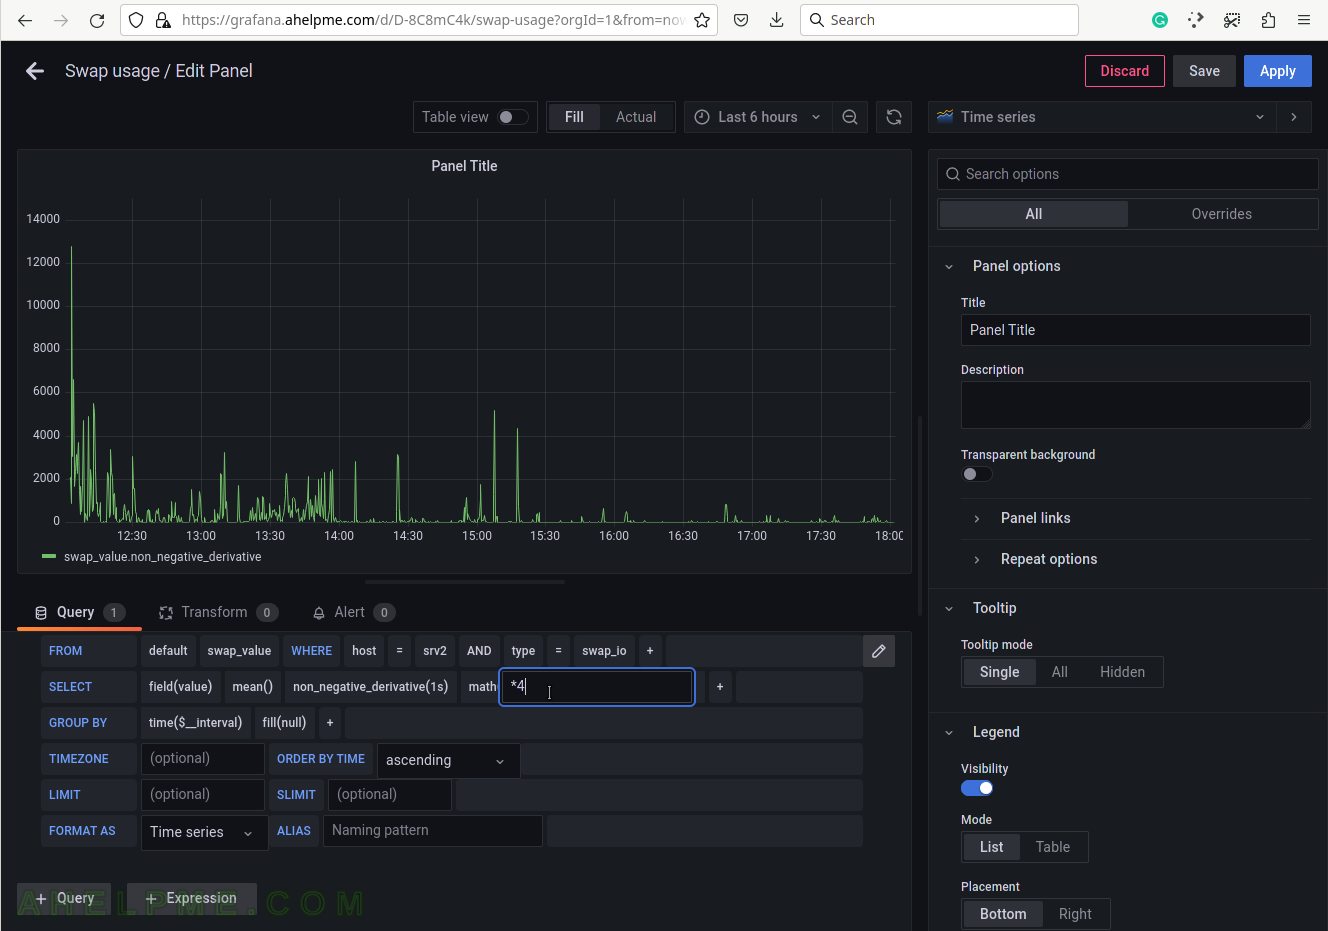
SCREENSHOT 31) Click on the “Add a new Panel” on the “Add panel” menu.
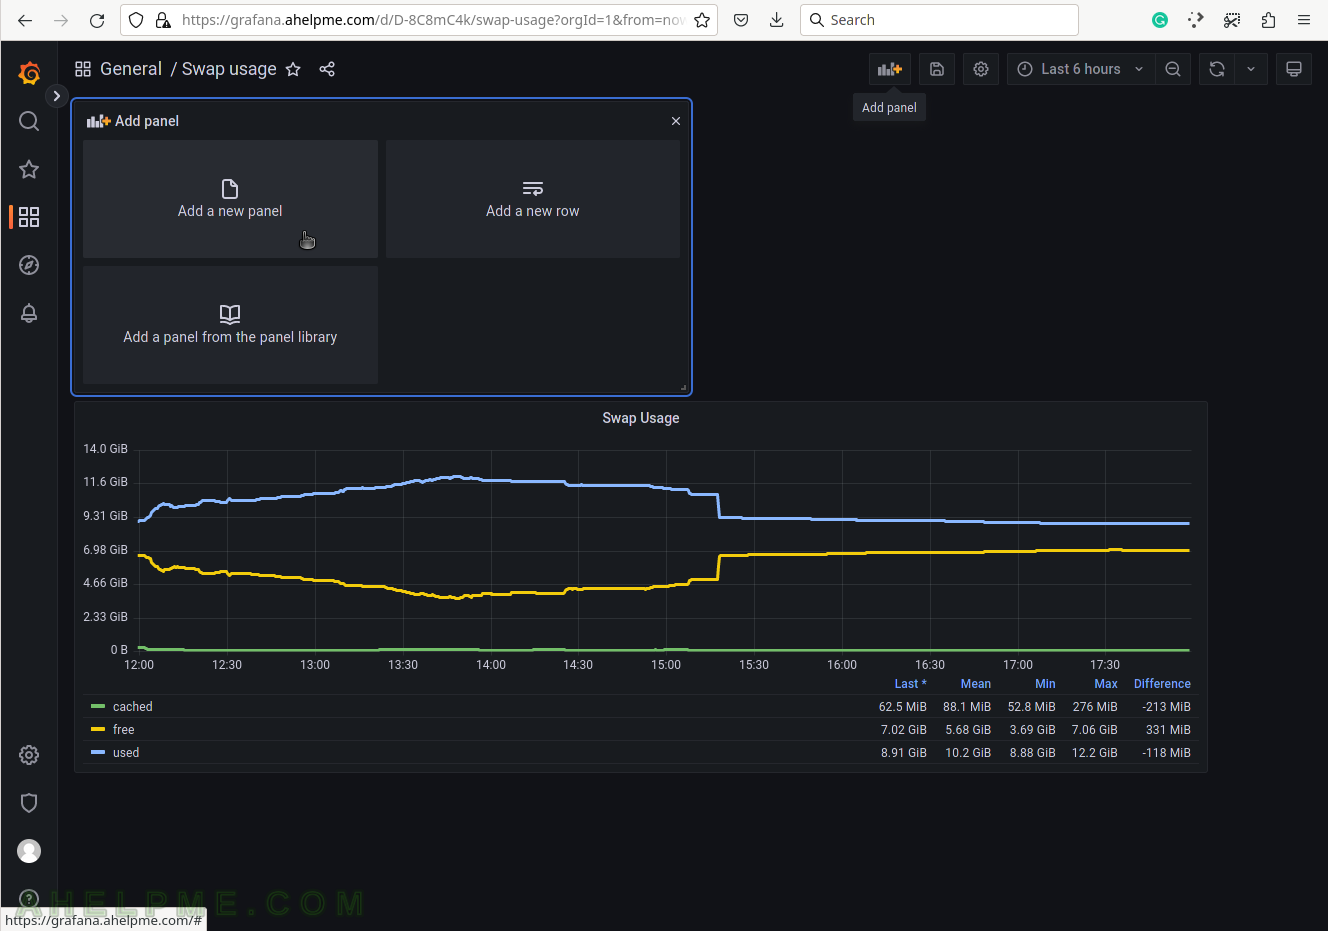
SCREENSHOT 32) Change the “Data Source” to the collectd (InfluxDB) database and ensure on the right top the graph type is “Time series”.
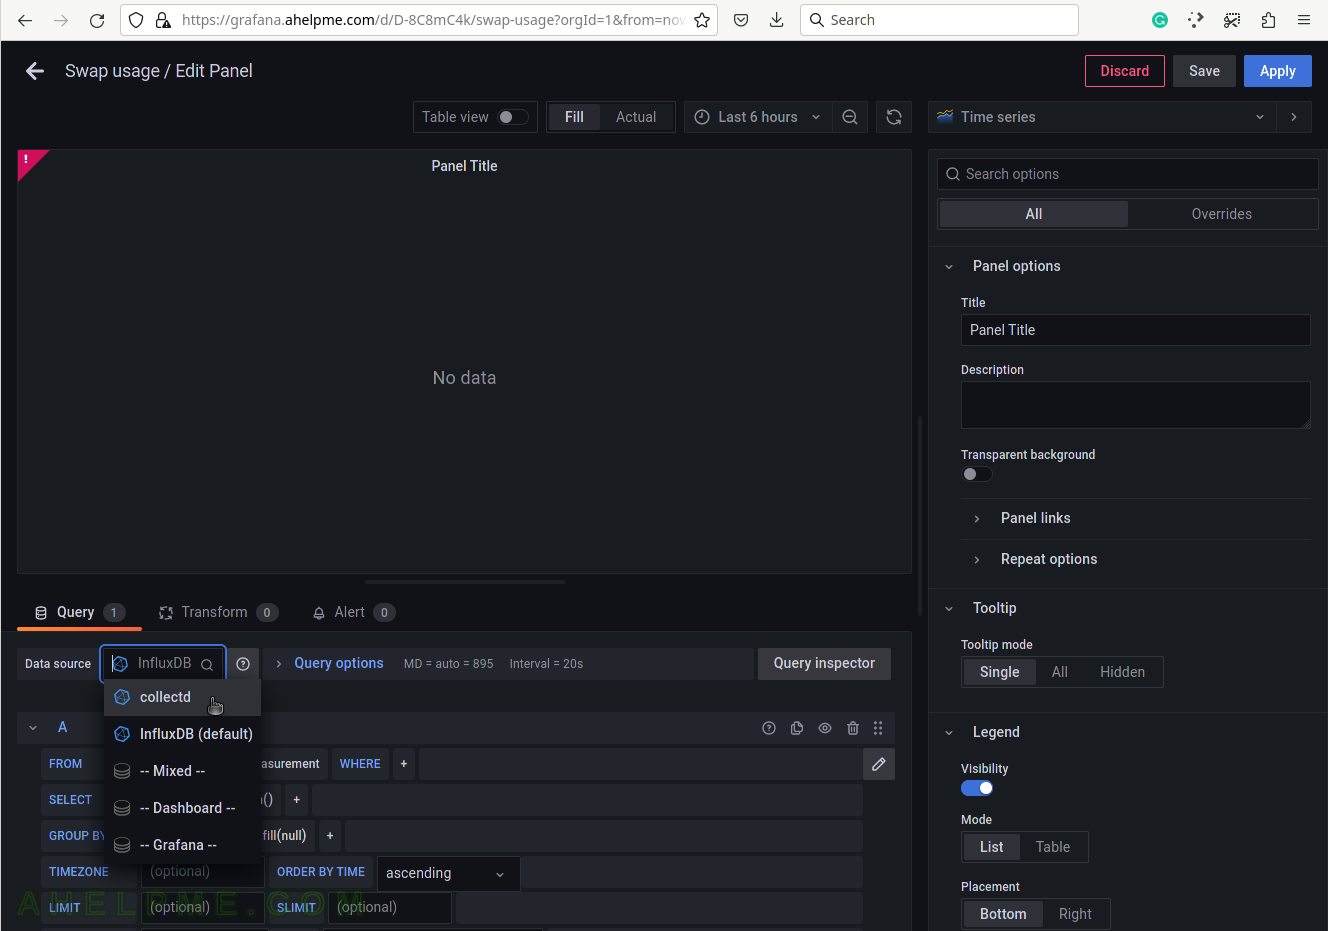
SCREENSHOT 33) Choose the swap_value from the measurement drop-down list.
There are all measurements in the drop-down list in the database collectd.
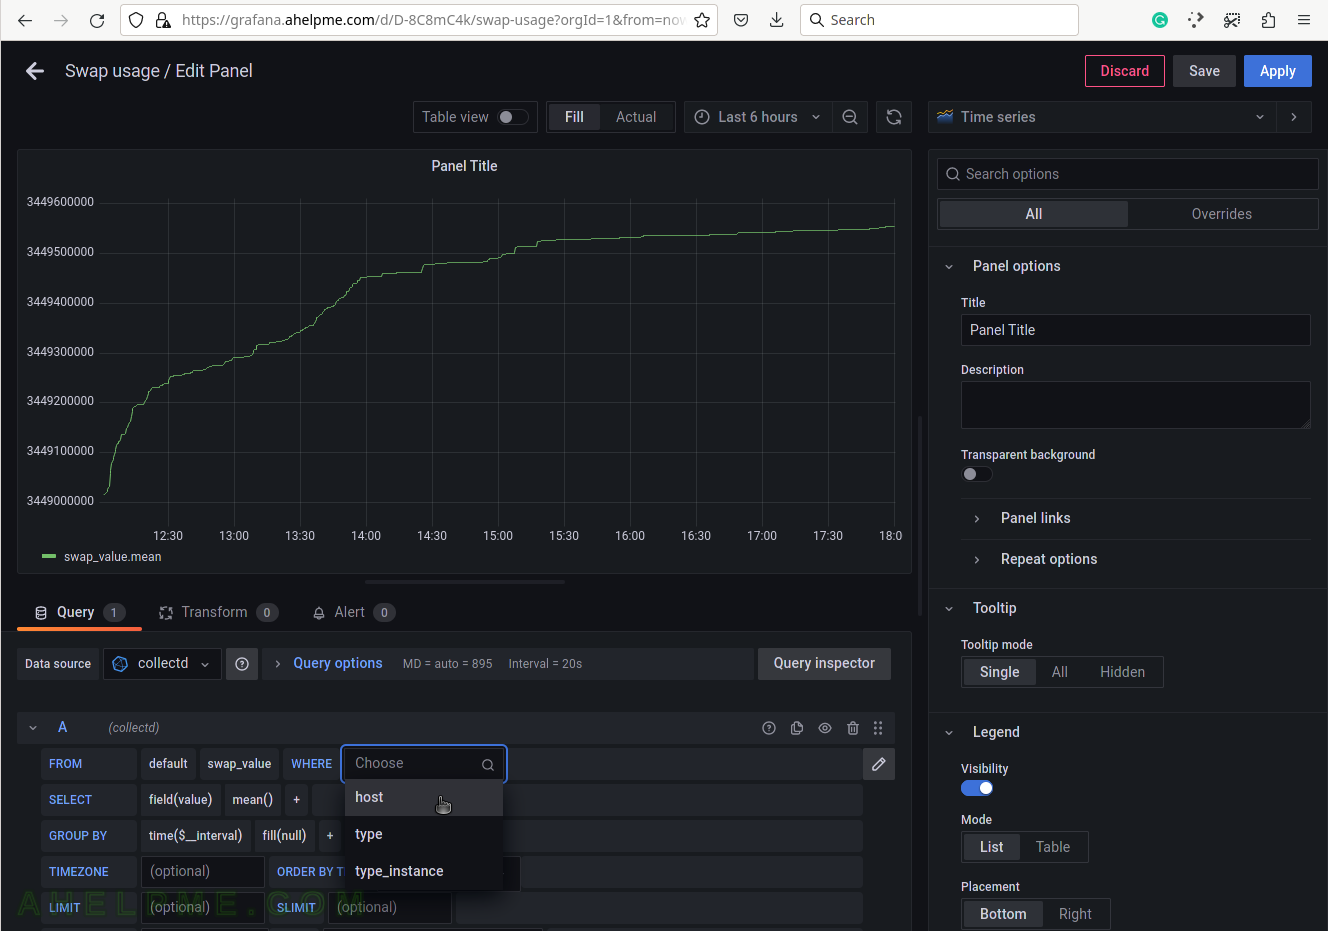
SCREENSHOT 34) Select the tag name “host” to limit the query for a selected hostname.
A tag is a key-value pair, which represents the metadata of a measurement record. For example, a measurement record consists of the actual measurement value and metadata for it such as which did the measurement and where. The server hostname “srv2” is the tag value and the tag key is the “host” name of the tag.
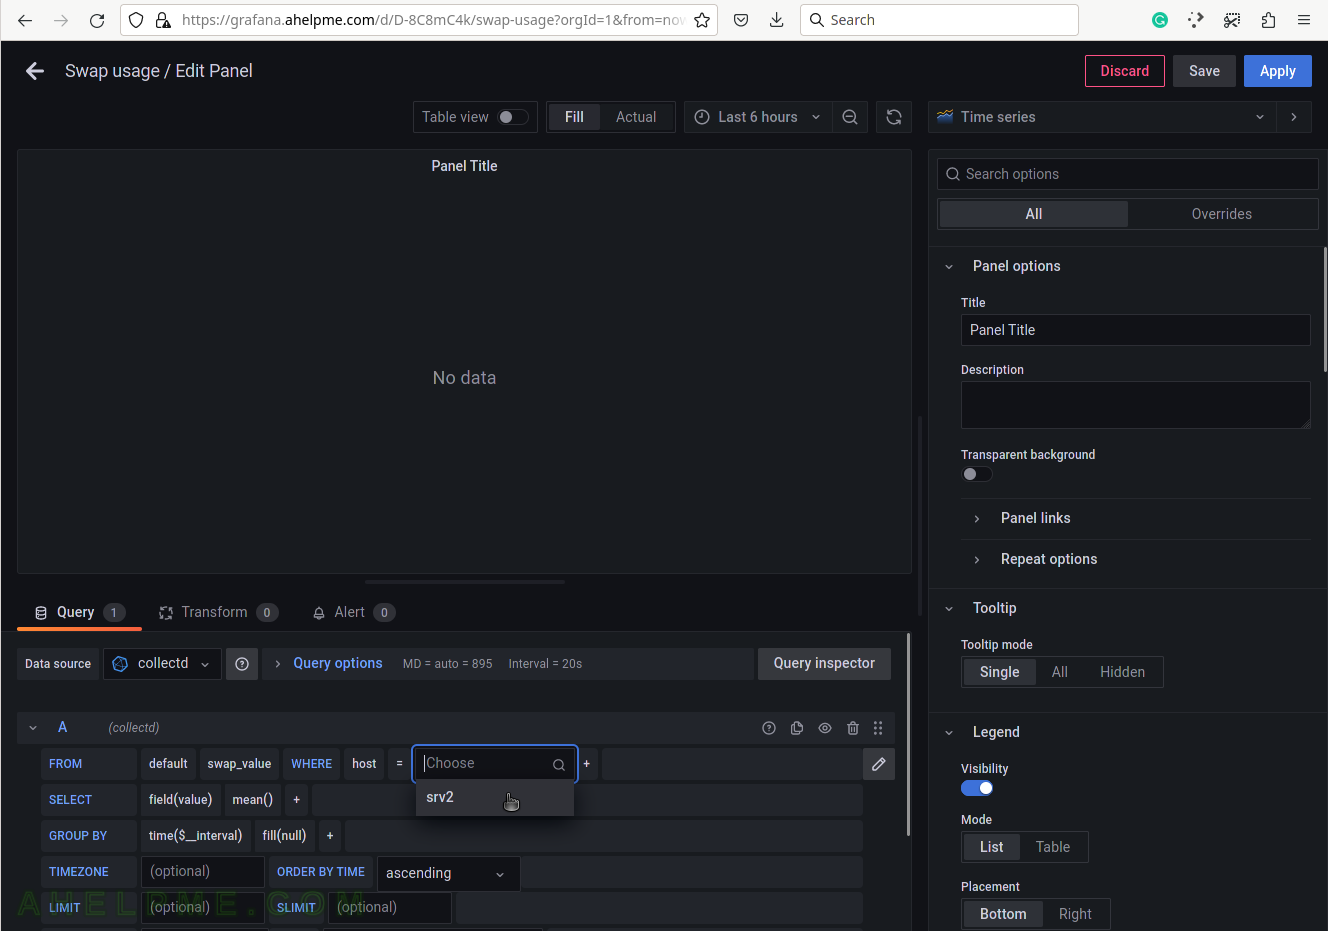
SCREENSHOT 35) Select the tag value “srv2”.
This setup has only one server, so no other servers’ hostnames are shown.
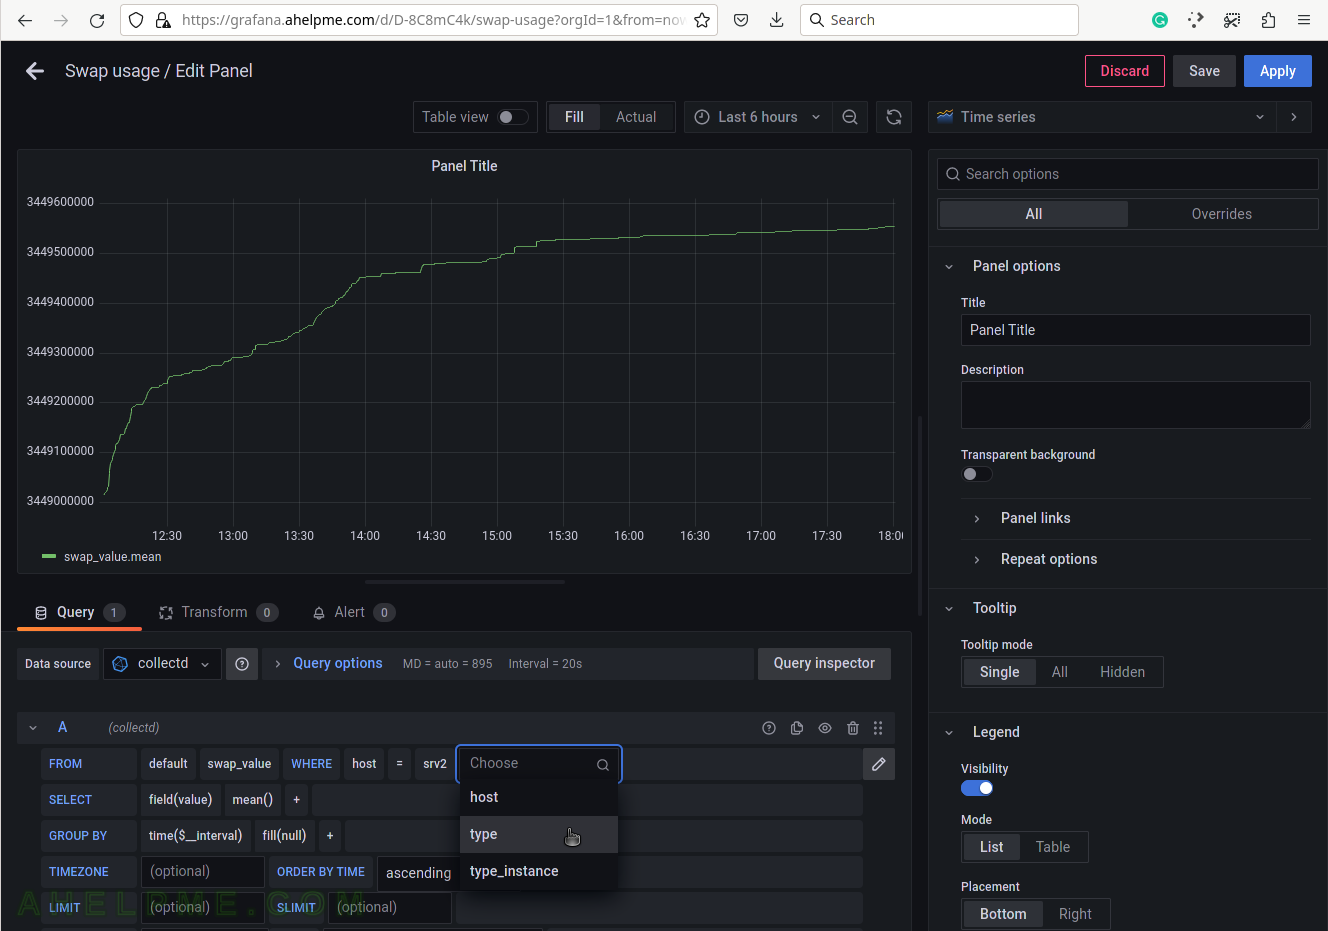
SCREENSHOT 36) Selecr the tag name “type”, which represets the name of the measurement – swap or swap IO.
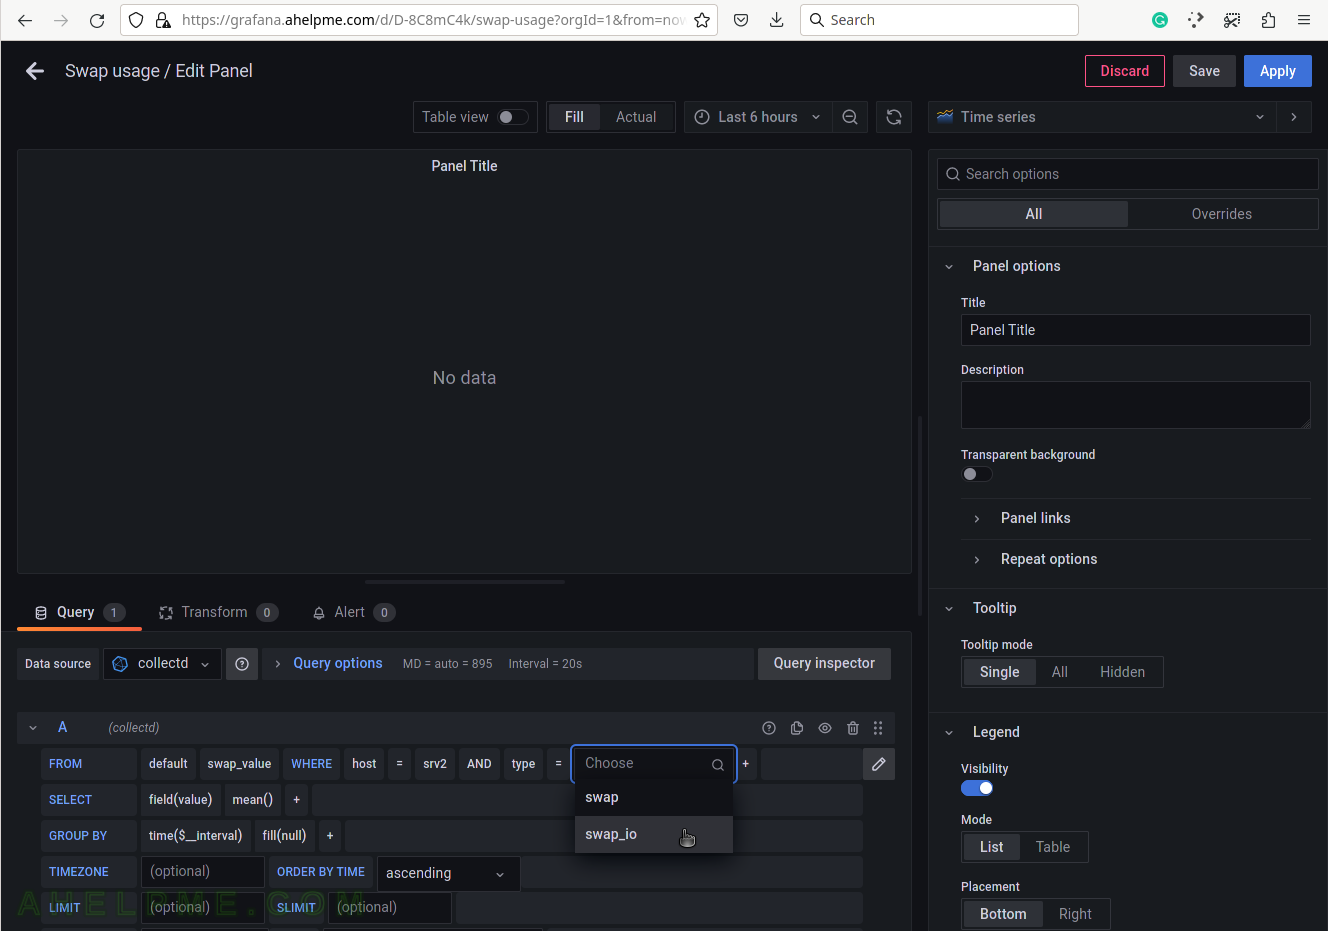
SCREENSHOT 37) Select the type of measurement – swap_io.
Yet another measurement metadata. swap_io hosts the counters for the input and output IO bytes, which the Linux kernel swap system makes.
SCREENSHOT 38) Add the function, which will compute the meaningful value.
The swap_io measurements are “derive” values and they should be transformed into something of value to the user. Using non_negative_derivative the swap_io tag_instances will be presented in bytes/s IN and OUT from the swap device. Change the number in the brackets to be 1s, because the data rate will be in bytes per second.
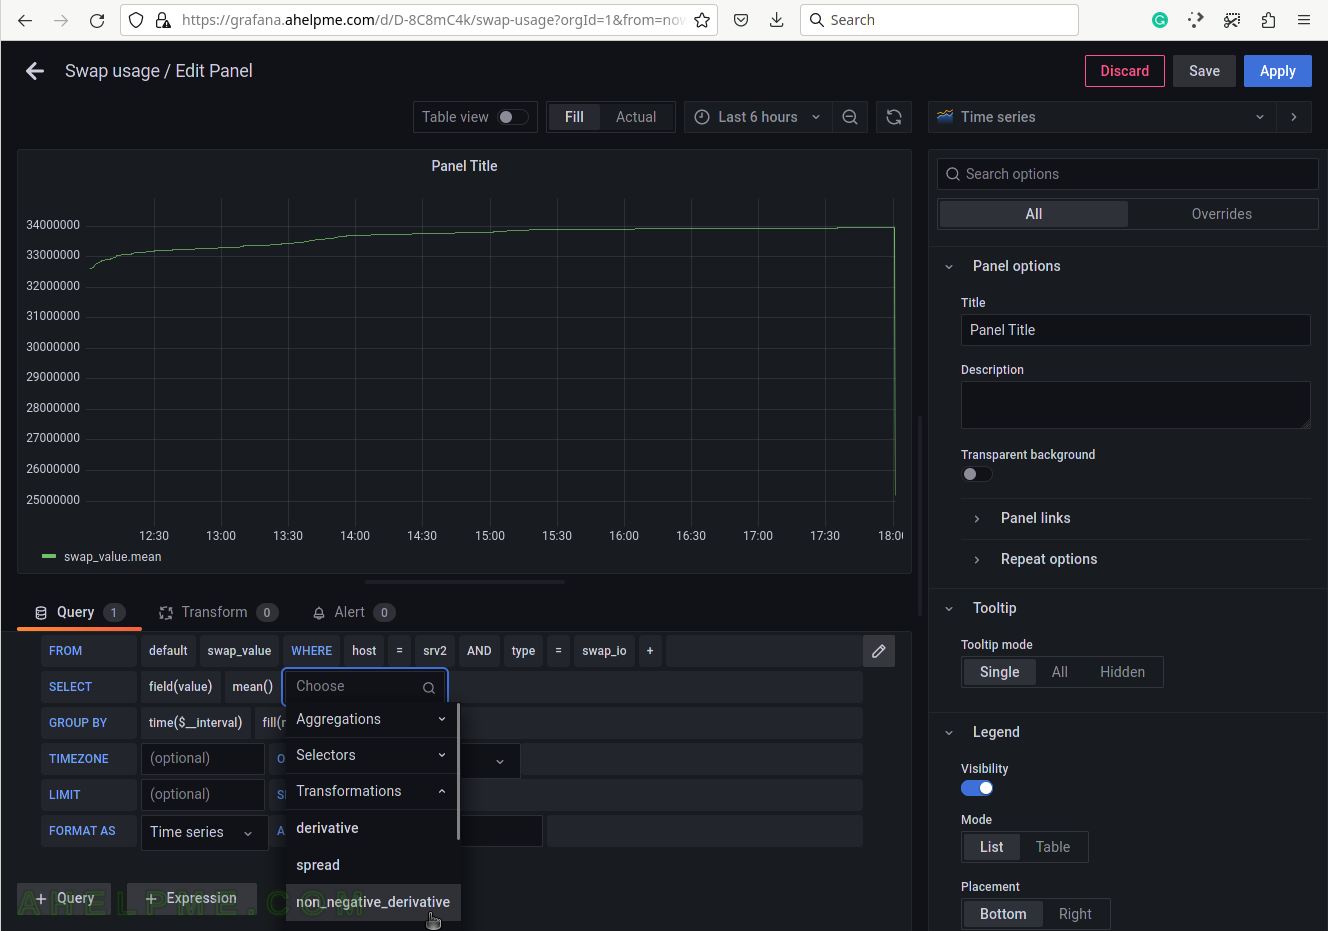
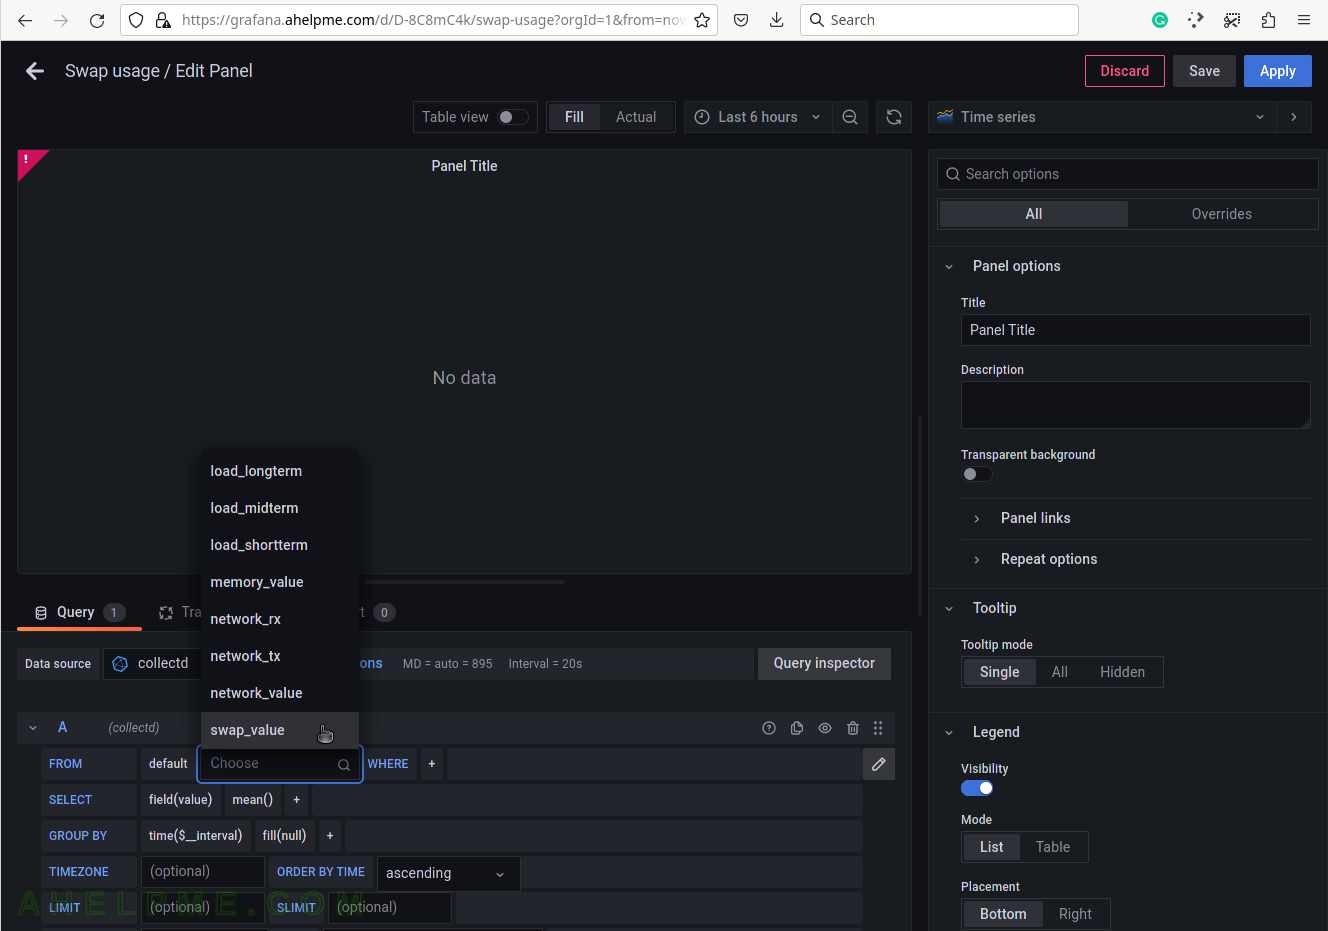
SCREENSHOT 39) Add a simple match function to multiply the value by 4.
The collectd swap option “ReportBytes” is false by default and it is not set to true in this example, so the values in swap_io are the number of pages since the last reboot. This is a Linux box with a 4K page size, so the number in swap_io counters should be multiple by 4*1024 or by 4 and set the data to be in Kilobytes later in the Panel options.
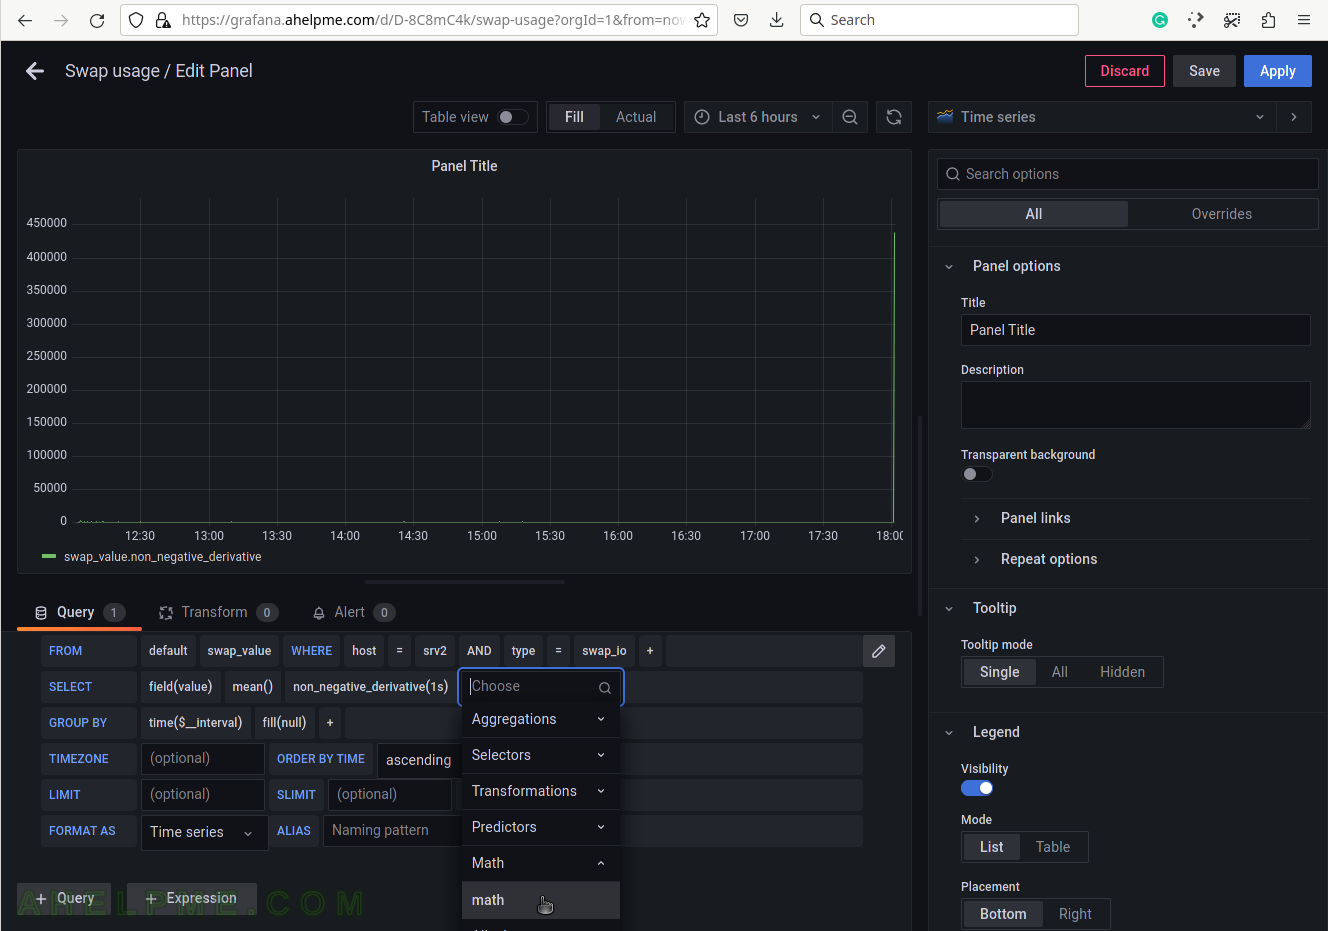
SCREENSHOT 40) Multiply the result by 4 because the Linu page size is 4Kbytes.
