This article shows how to make a graph showing a Linux machine’s memory. This plugin gathers physical memory utilization – used, buffered, cached, and free. In general, this module collects simple data for the physical memory like the Linux command free or top command. The purpose of this article is to make a graph showing memory usage and consumption.
The Linux machine is using collectd to gather the memory statistics and send them to the time series back-end – InfluxDB. Grafana is used to visualize the data stored in the time series back-end InfluxDB and organize the graphs in panels and dashboards. Check out the previous articles on the subject to install and configure such software to collect, store and visualize data – Monitor and analyze with Grafana, influxdb 1.8 and collectd under CentOS Stream 9, Monitor and analyze with Grafana, influxdb 1.8 and collectd under Ubuntu 22.04 LTS and Create graph for Linux CPU usage using Grafana, InfluxDB and collectd
The collectd daemon is used to gather data on the Linux system and to send it to the back-end InfluxDB.
Key knowledge for the Memory collectd plugin
- The collectd plugin Memory official page – https://collectd.org/wiki/index.php/Plugin:Memory
- The Memory plugin options – https://collectd.org/documentation/manpages/collectd.conf.5.shtml#plugin_memory
- to enable the Memory plugin, load the plugin with the load directive in /etc/collectd.conf
LoadPlugin memory
- The Memory plugin collects data every 10 seconds.
- memory_value – a single Gauge value – a metric, which value that can go up and down. It is used to count the memory occupancy for the different categories (the category is saved in a tag value of one record, and the categories are Used, Free and etc.). So there are multiple gauge values with different tags for the different memory categories at a given time.
tag key tag value description host server hostname The name of the source this measurement was recorded. type memory memory is the type, which will group the memory categories. type_instance memory categories The categories are buffered, cached, free, slab_recl, slab_unrecl, used. - A Gauge value – a metric, which value that can go up and down. More on the topic – Data sources.
A GAUGE value is simply stored as-is. This is the right choice for values which may increase as well as decrease, such as temperatures or the amount of memory used.
- To cross-check the value, the user can use the /proc/meminfo
[root@srv ~]# cat /proc/meminfo |egrep -e "^(MemTotal|MemFree|Buffers|Cached|Slab|SReclaimable|SUnreclaim)"
MemTotal:        3726476 kB
MemFree:         2869736 kB
Buffers:            5248 kB
Cached:           400740 kB
Slab:              67700 kB
SReclaimable:      29200 kB
SUnreclaim:        38500 kB
Some of the lines are pretty clear about what they mean by “MemTotal“, “MemFree“, “Buffers” and so on.
The InfluxQL queries for the Linux Memory plugin are grouped by where the memory is used (buffered, cached, free, used, etc.)
The queries are Grafana generated.
SELECT mean("value") FROM "memory_value" WHERE ("host" = 'srv2' AND "type" = 'memory') AND $timeFilter GROUP BY time(10s), "type_instance" fill(null)
The mean function will compute the mean if there is more than one value in the database for every 10 minutes (this is the “group by” logic here). Probably the most accurate query might be to use the last() function instead of mean() and to group by time(10s) (or the time interval, of which the data is written in the database). As mentioned above, the collectd interval is 10 seconds. The function non_negative_derivative is needed to compute the difference between the values.
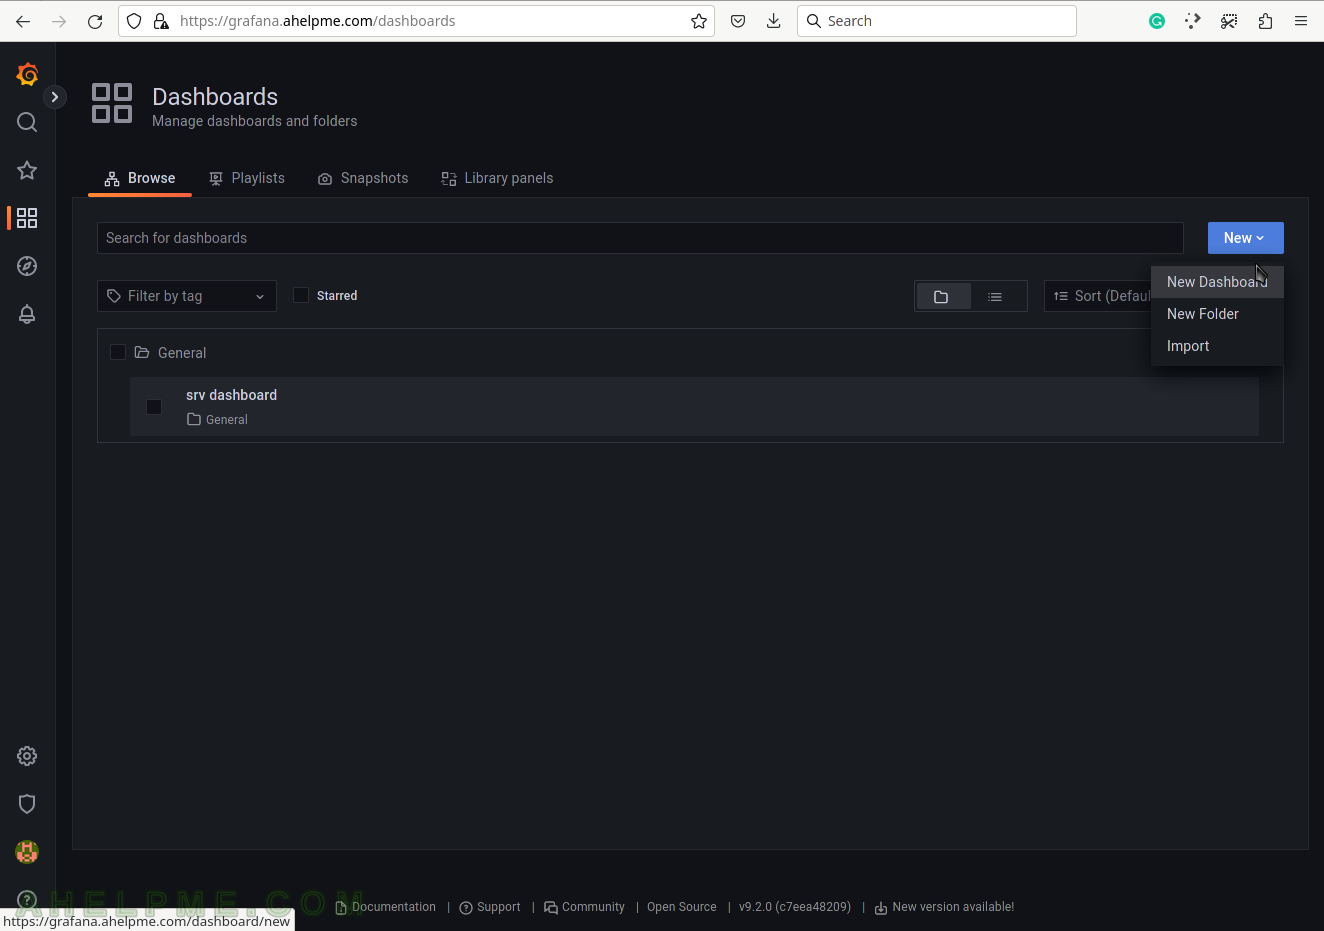
SCREENSHOT 1) Create a new dashboard, which will contain the Physical memory usage graph.
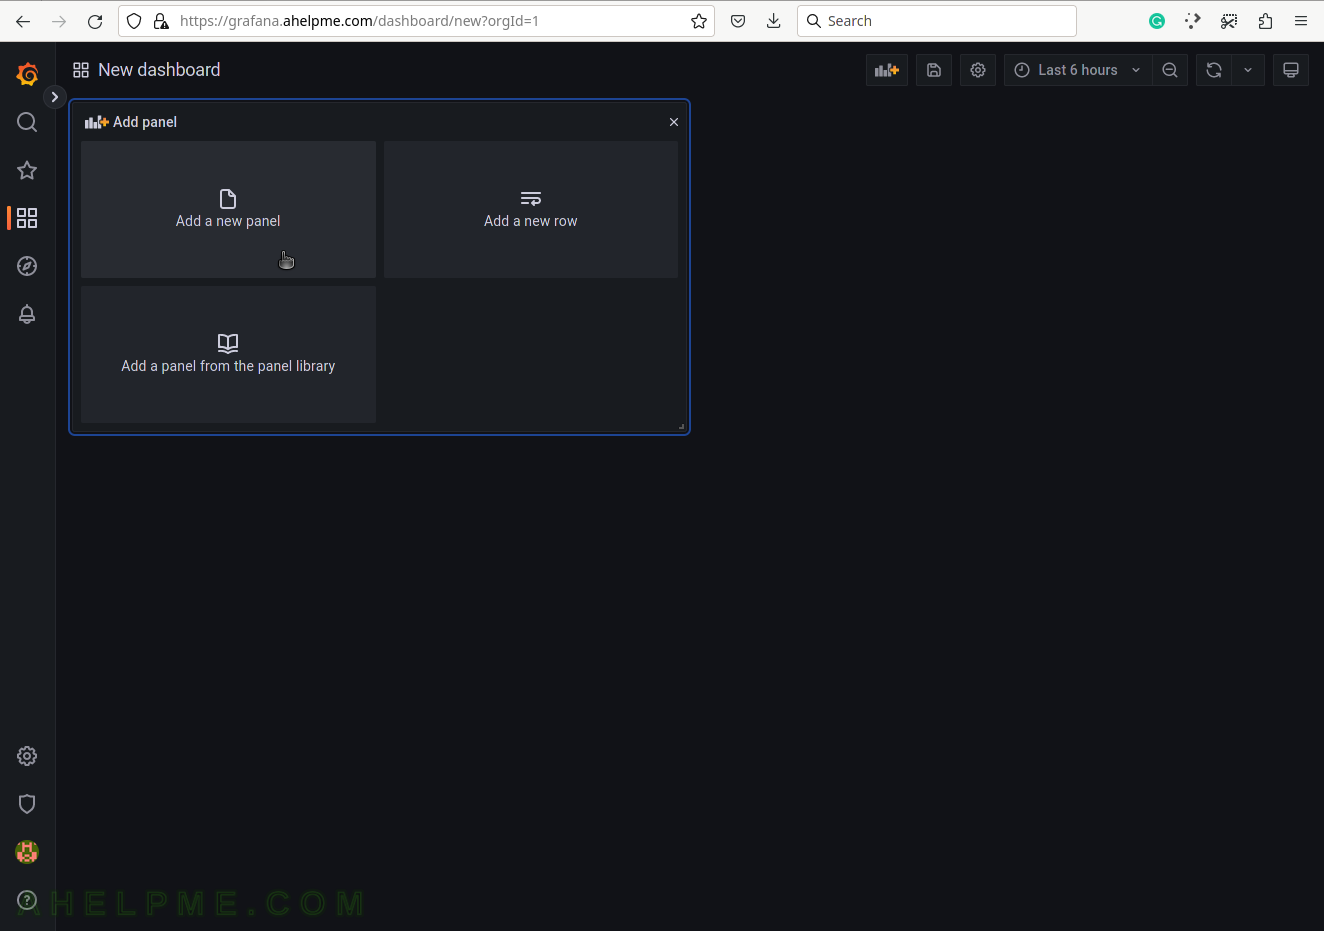
SCREENSHOT 2) Add a new panel in the new dashboard, which will contain the Physical memory usage graph.
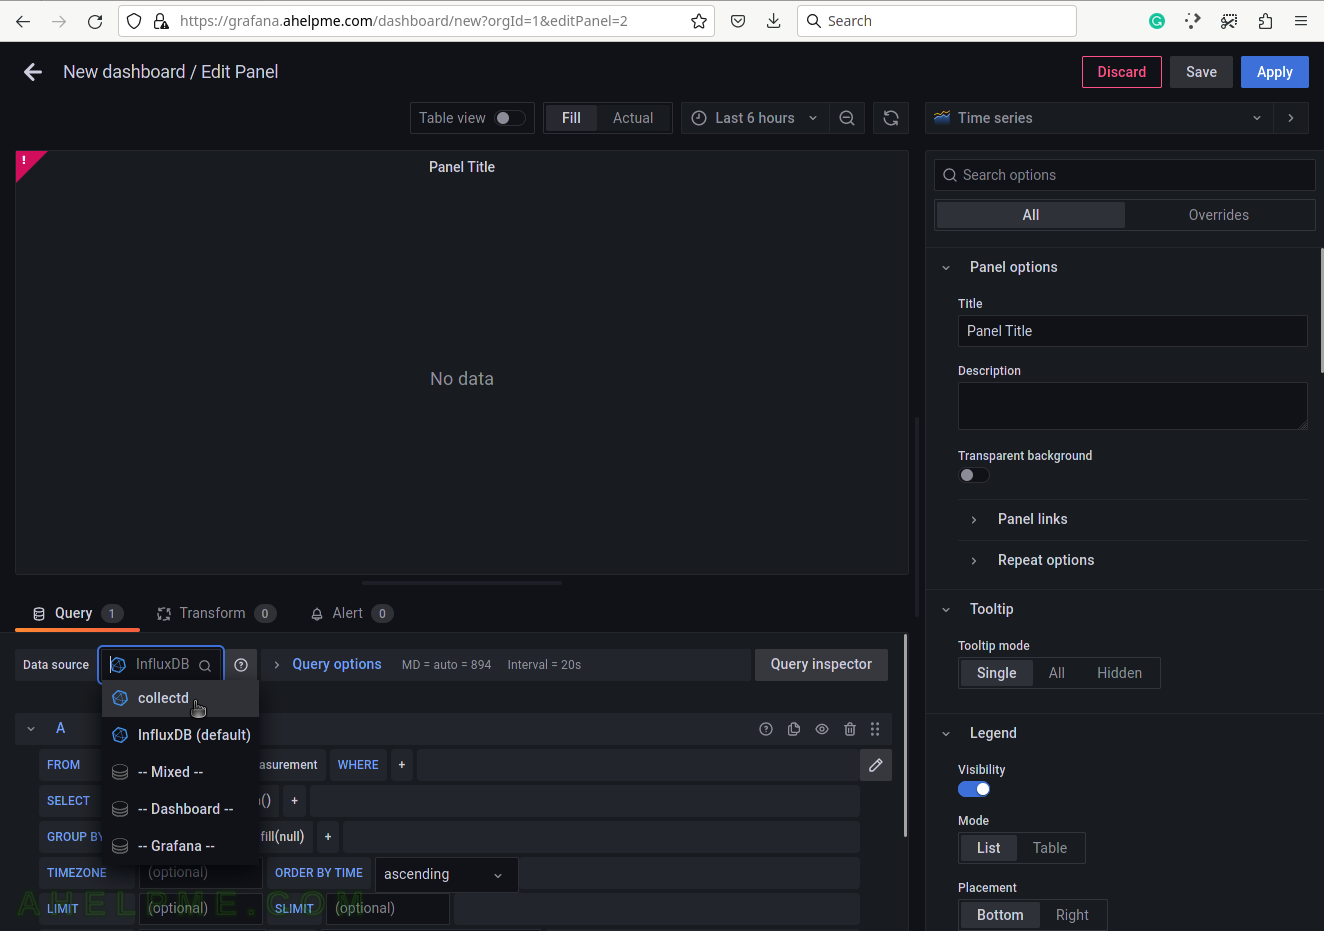
SCREENSHOT 3) Change the “Data Source” to the collectd (InfluxDB) database and ensure on the right top the graph type is “Time series”.
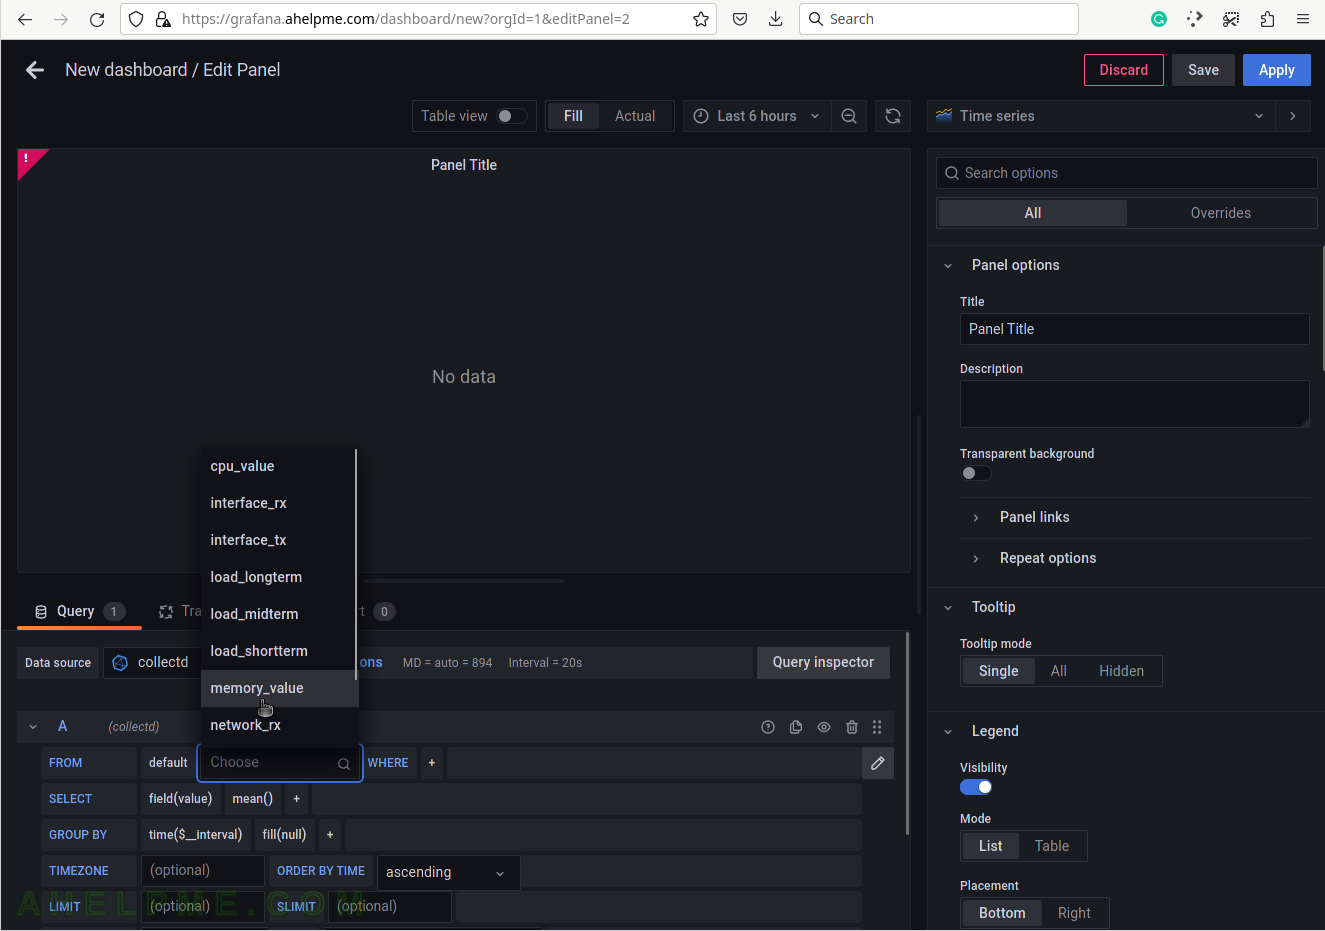
SCREENSHOT 4) Choose the memory_value from the measurement drop-down list.
There are all measurements in the drop-down list in the database collectd.
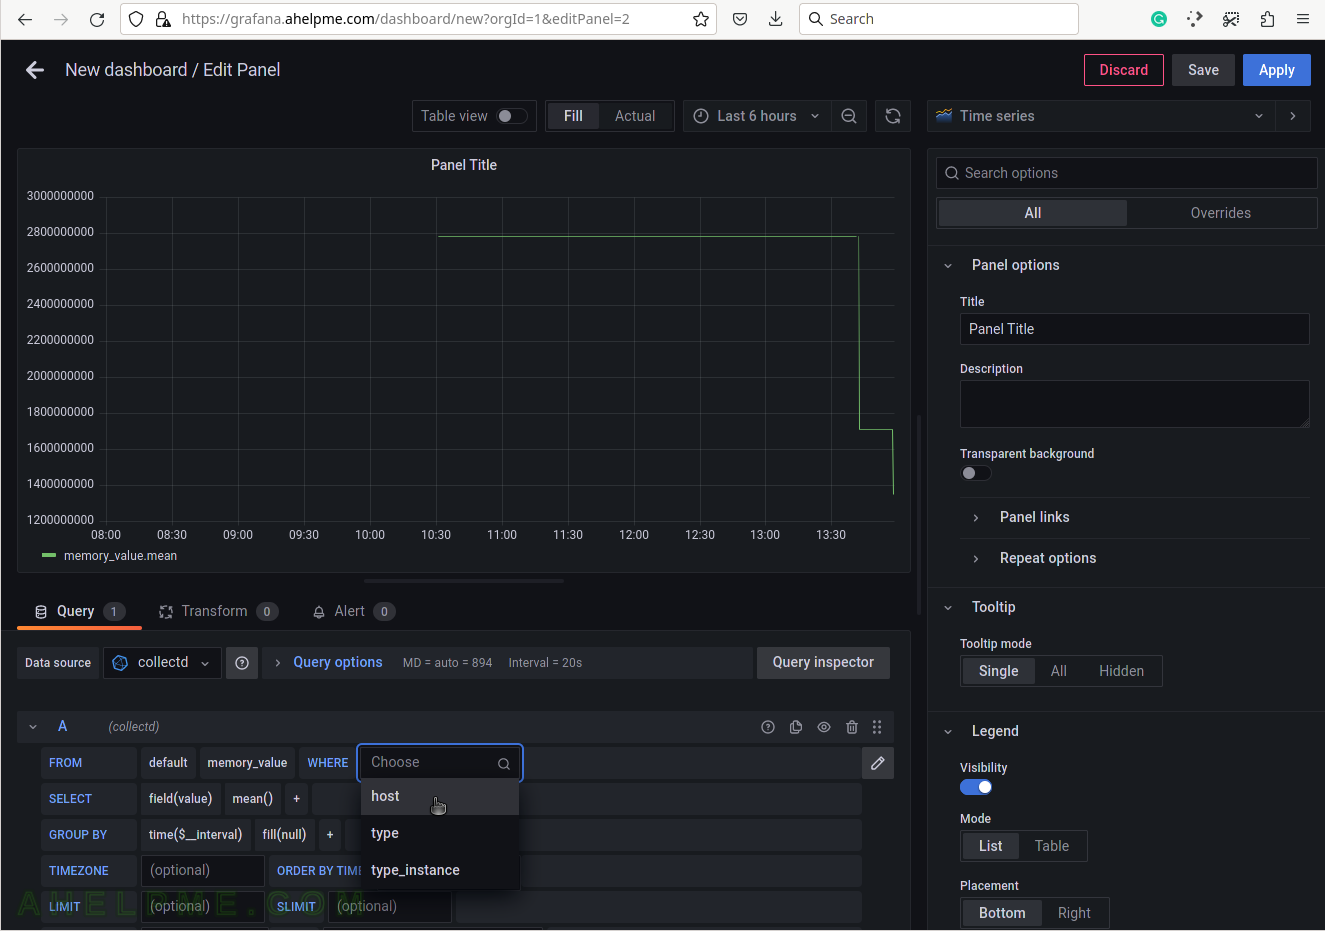
SCREENSHOT 5) Select the tag name “host” to limit the query for a selected hostname.
A tag is a key-value pair, which represents the metadata of a measurement record. For example, a measurement record consists of the actual measurement value and some metadata for it such as which did the measurement and where. The server hostname “srv2” is the tag value and the tag key is the “host” name of the tag.
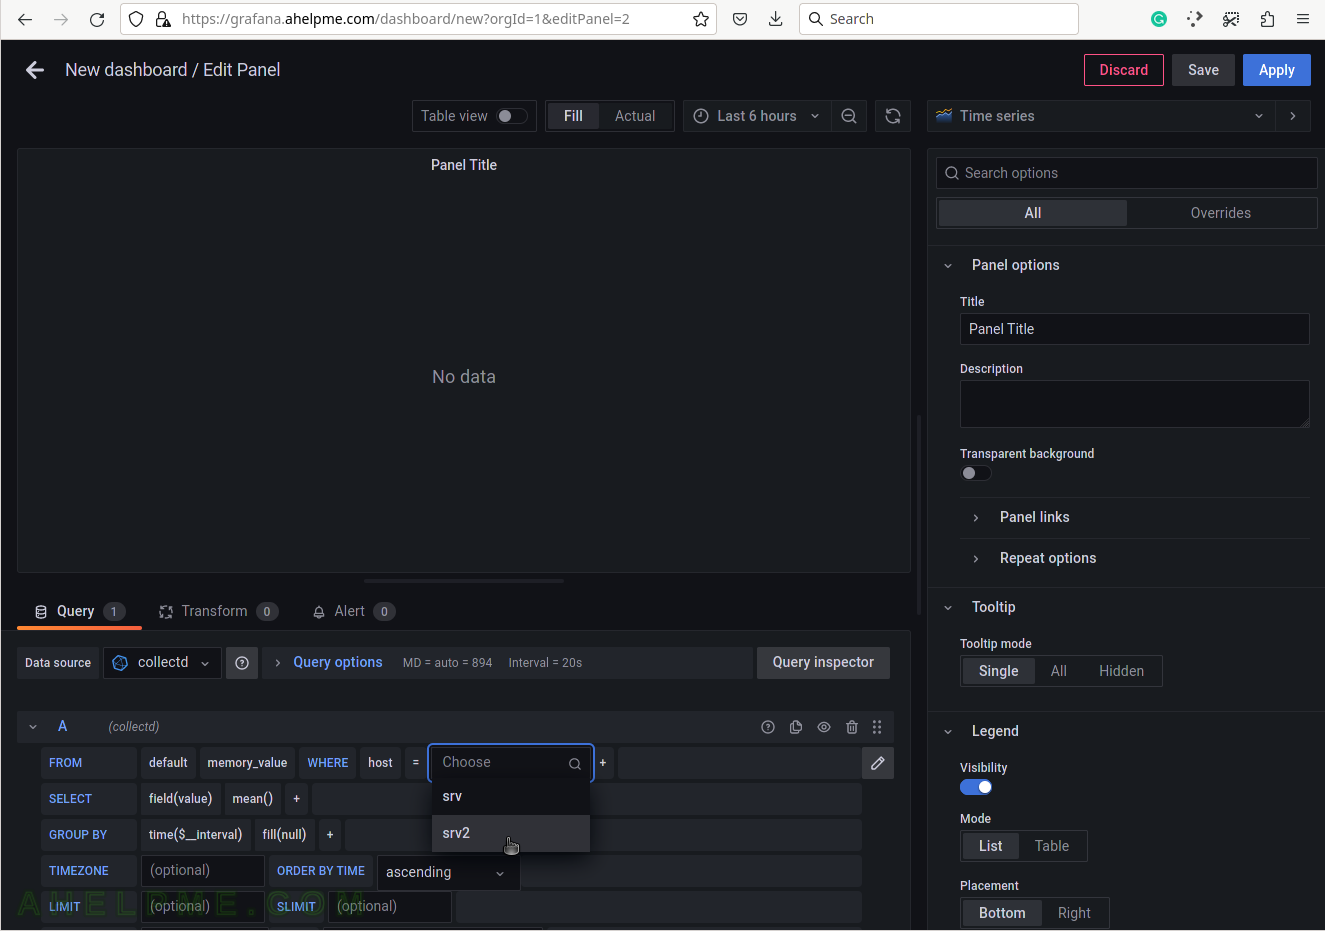
SCREENSHOT 6) Select the tag value “srv2”.
This setup has only one server, so no other servers’ hostnames are shown.
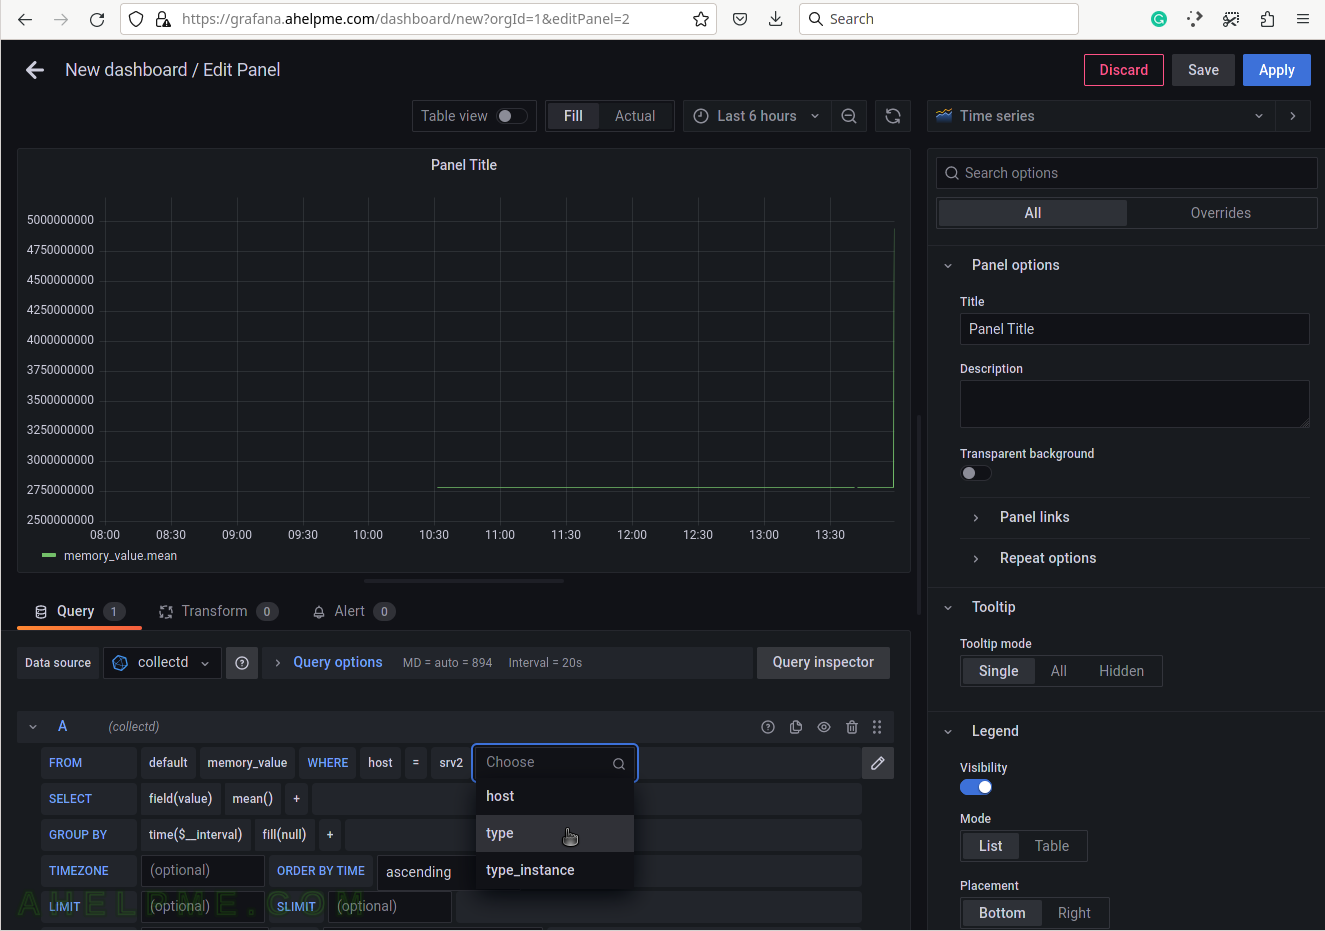
SCREENSHOT 7) Select the type of measurement.
Yet another measurement metadata. The type of measurement is memory, i.e. physical memory.
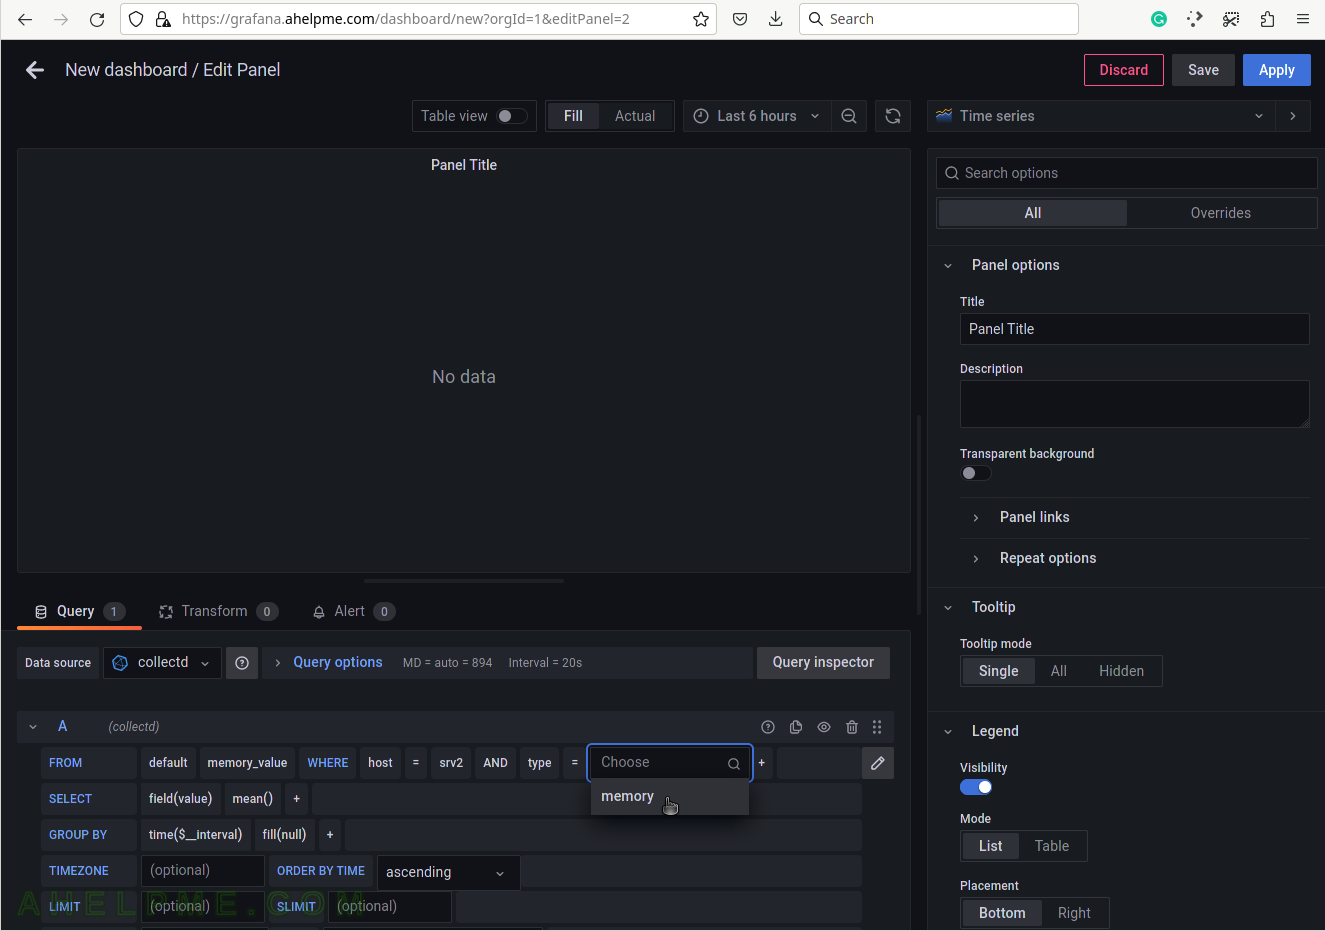
SCREENSHOT 8) Select memory for the tag value to draw physical memory in the graph.
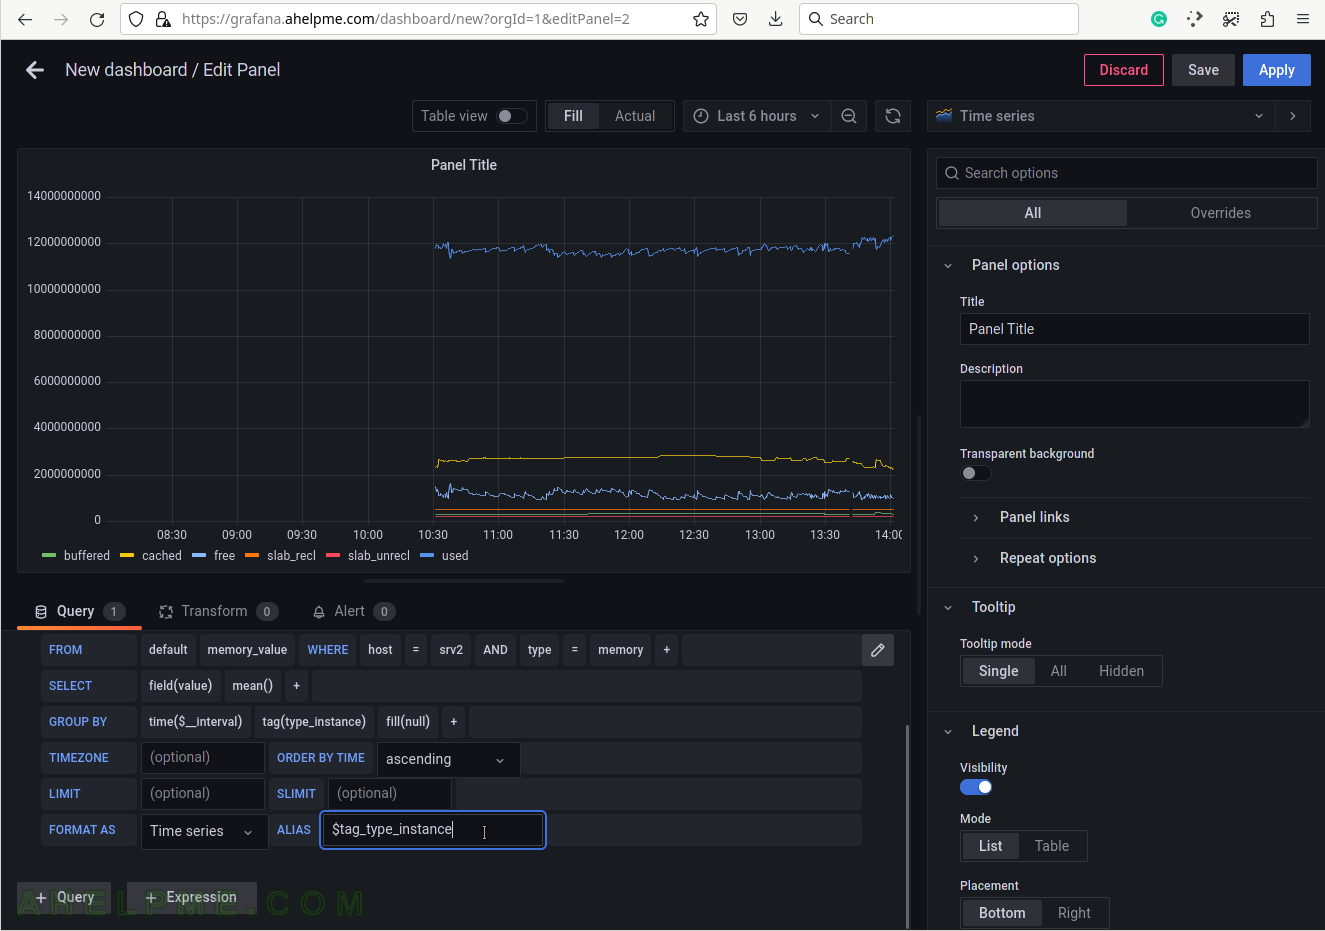
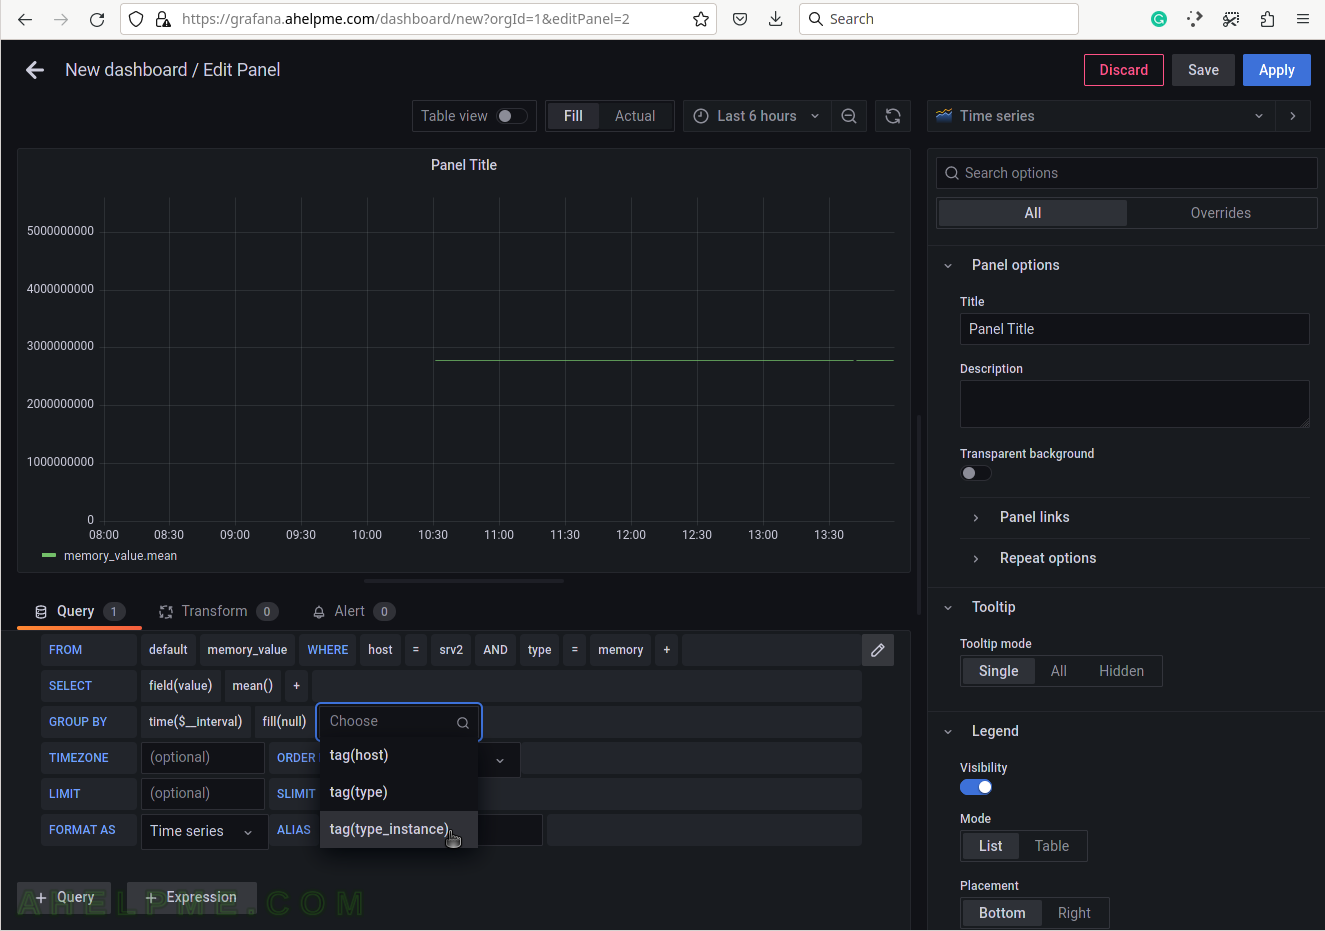
SCREENSHOT 9) Add a group by tag_instance to split the different tags in the graph.
The tag_instance shows the memory usage, which could be: buffered, cached, free, slab_recl, slab_unrecl, and used.
SCREENSHOT 10) To give pretty names to the tags in the graph’s legend add to the ALIAS a variable $tag_[tag_key] and in this case, the tag key is type_instance so that the variable will be $tag_type_instance.
There is an important variable “$__interval“, which may be edited and set to the rate of the original data (if applicable, not really for the physical memory) or left as is to be computed each time based on the selected time frame of the graph (6 hours for this example).