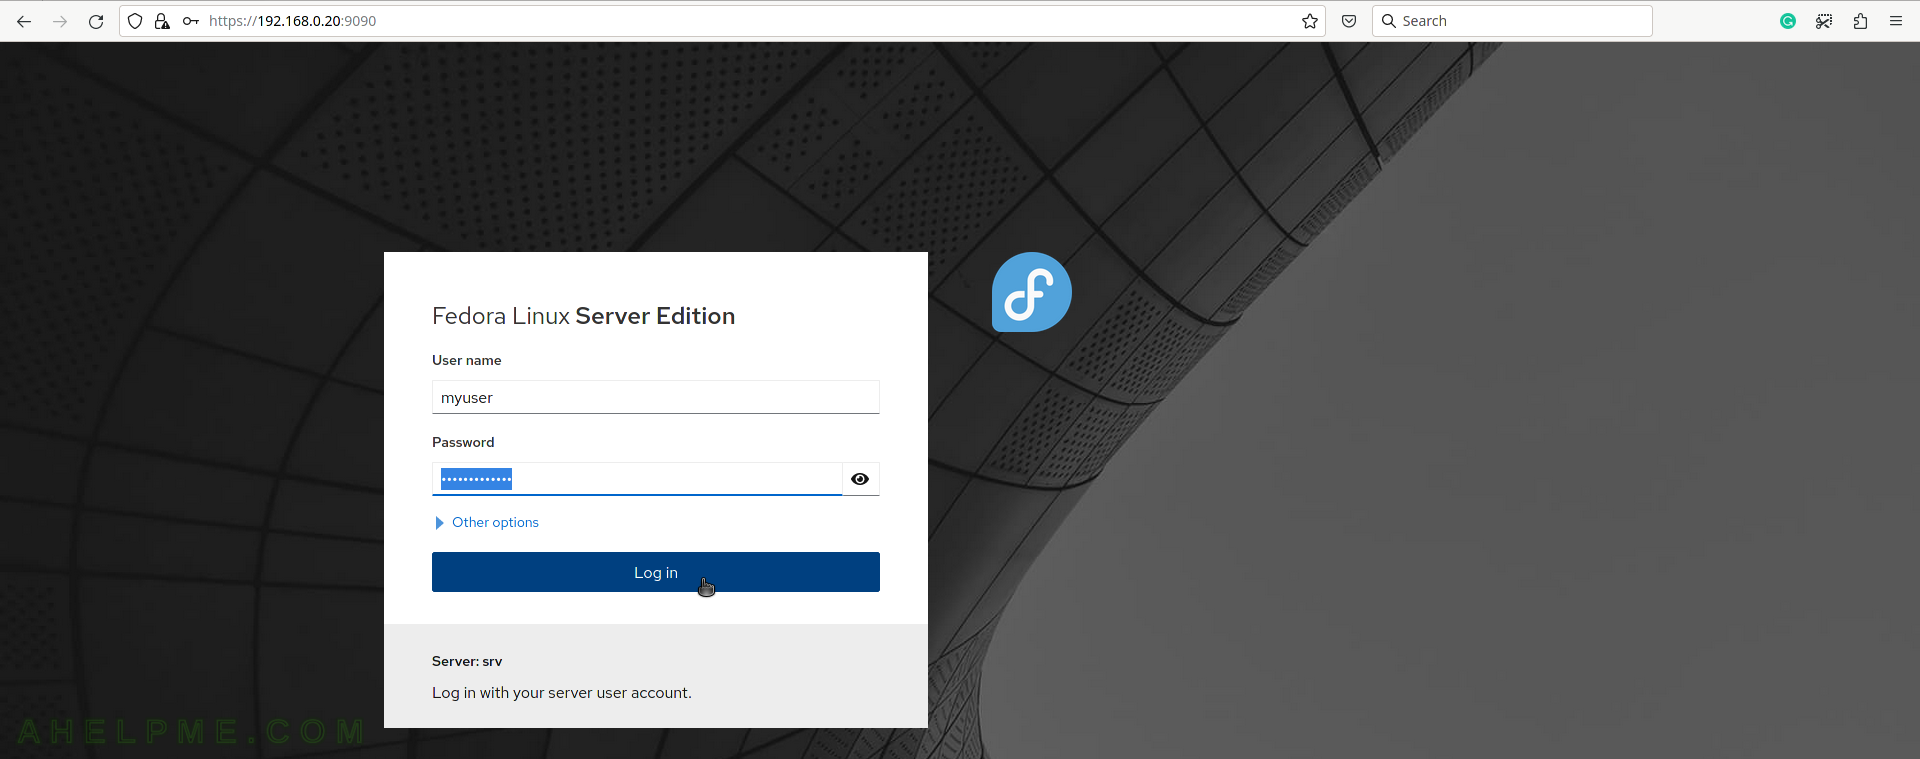
SCREENSHOT 1) The cockpit login page.
Use an administrative user to log in successfully. If the root is not permitted to remote log in using SSH, the root user could not log in.
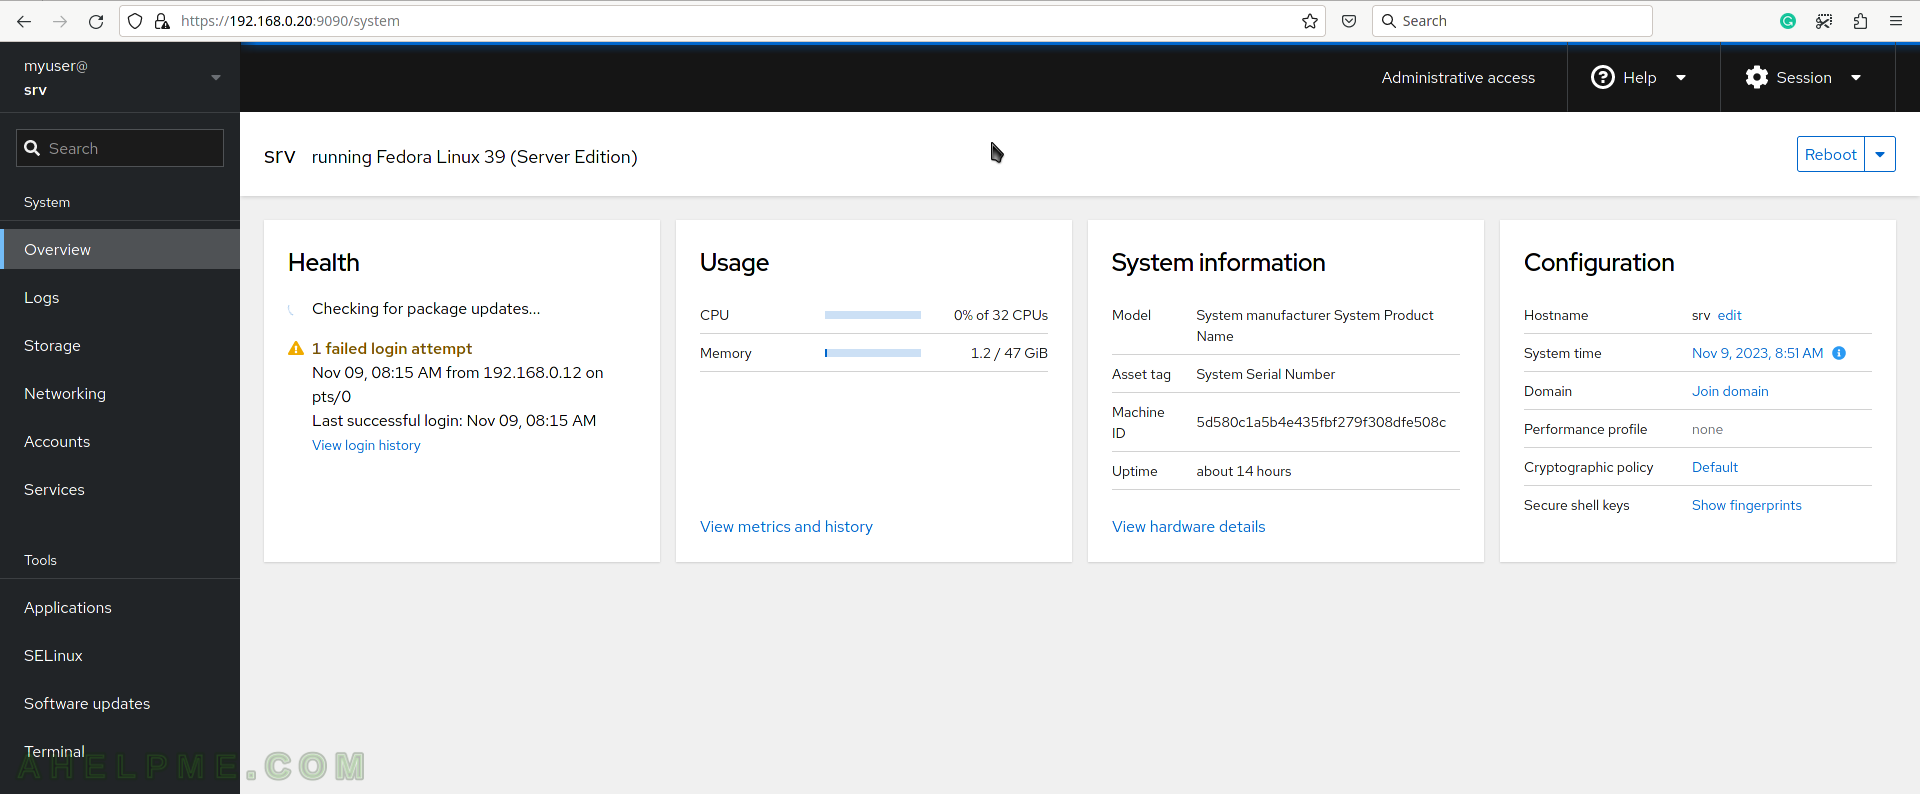
SCREENSHOT 2) After successful login, the System overview screen is shown.
It resembles a dashboard with brief information about the system’s Health, Usage, System Information, and Configuration. There is a “Administrative access” link to limit privileges or to escalate privileges if needed. This user is with administrative privileges and it has access to all cockpit pages.
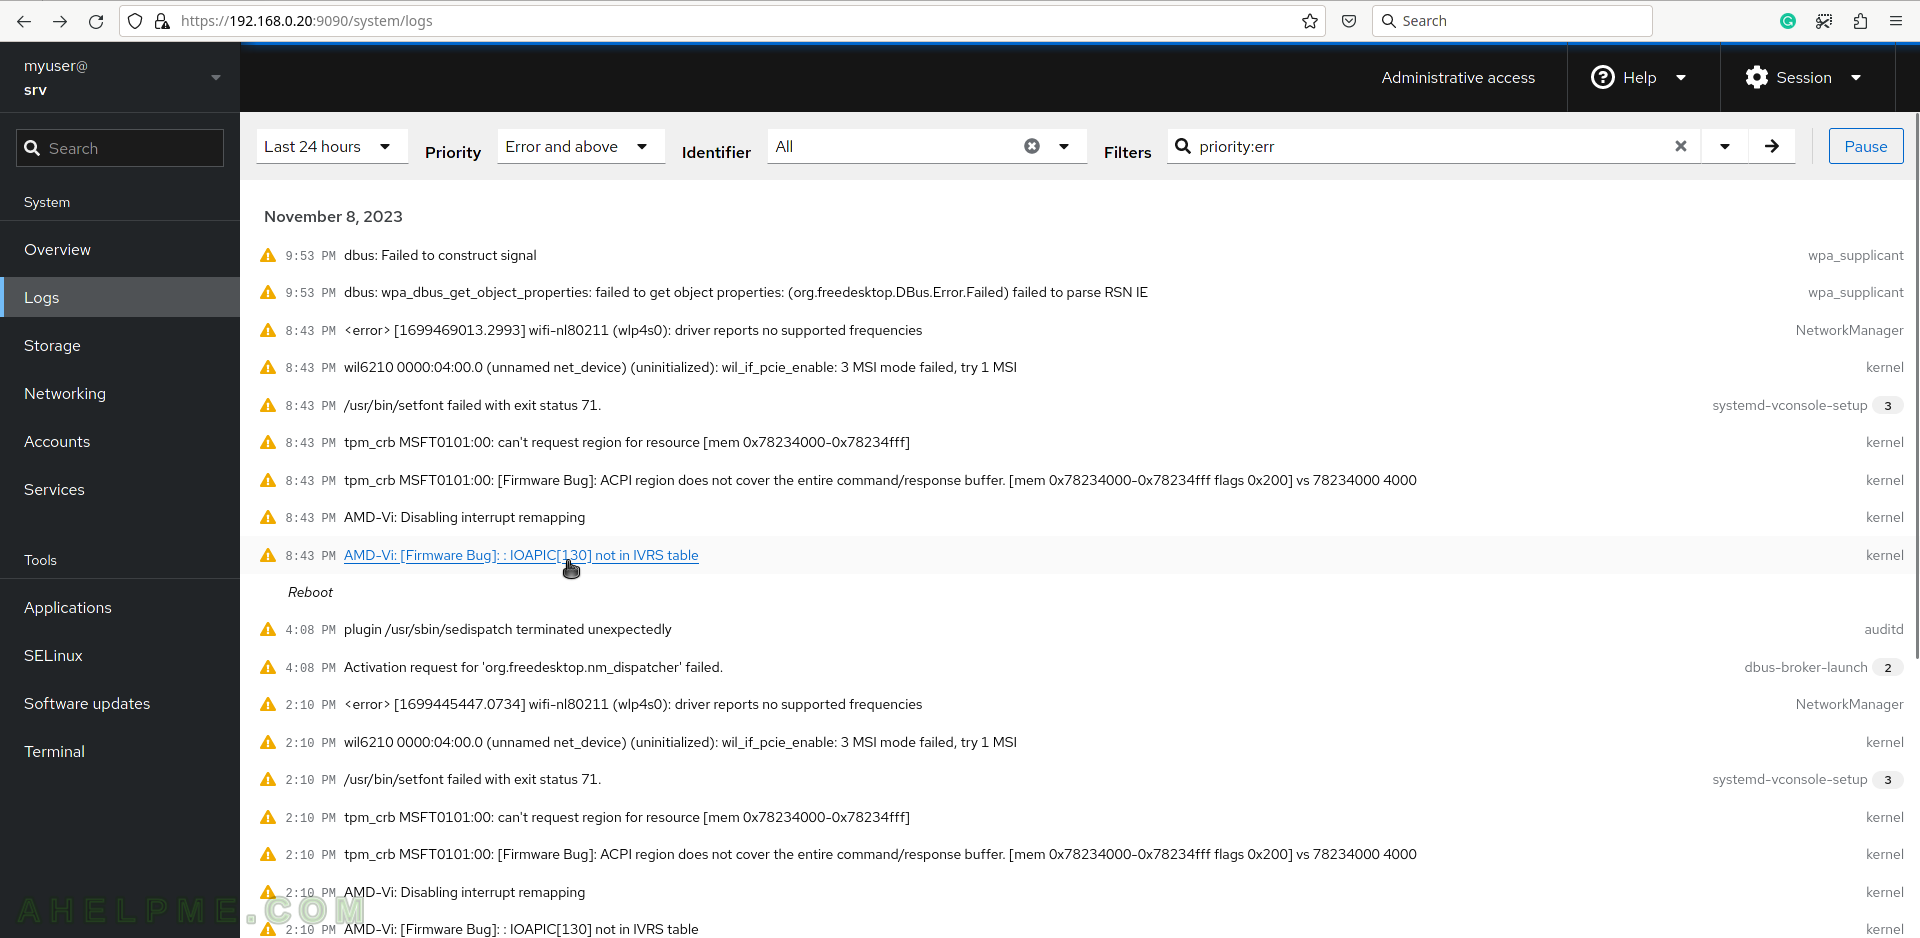
SCREENSHOT 3) The logs page shows the last 24 hours’ logs with priority “error”.
There are multiple filters – Hours, Priority, Identifier, and editable filter fields.
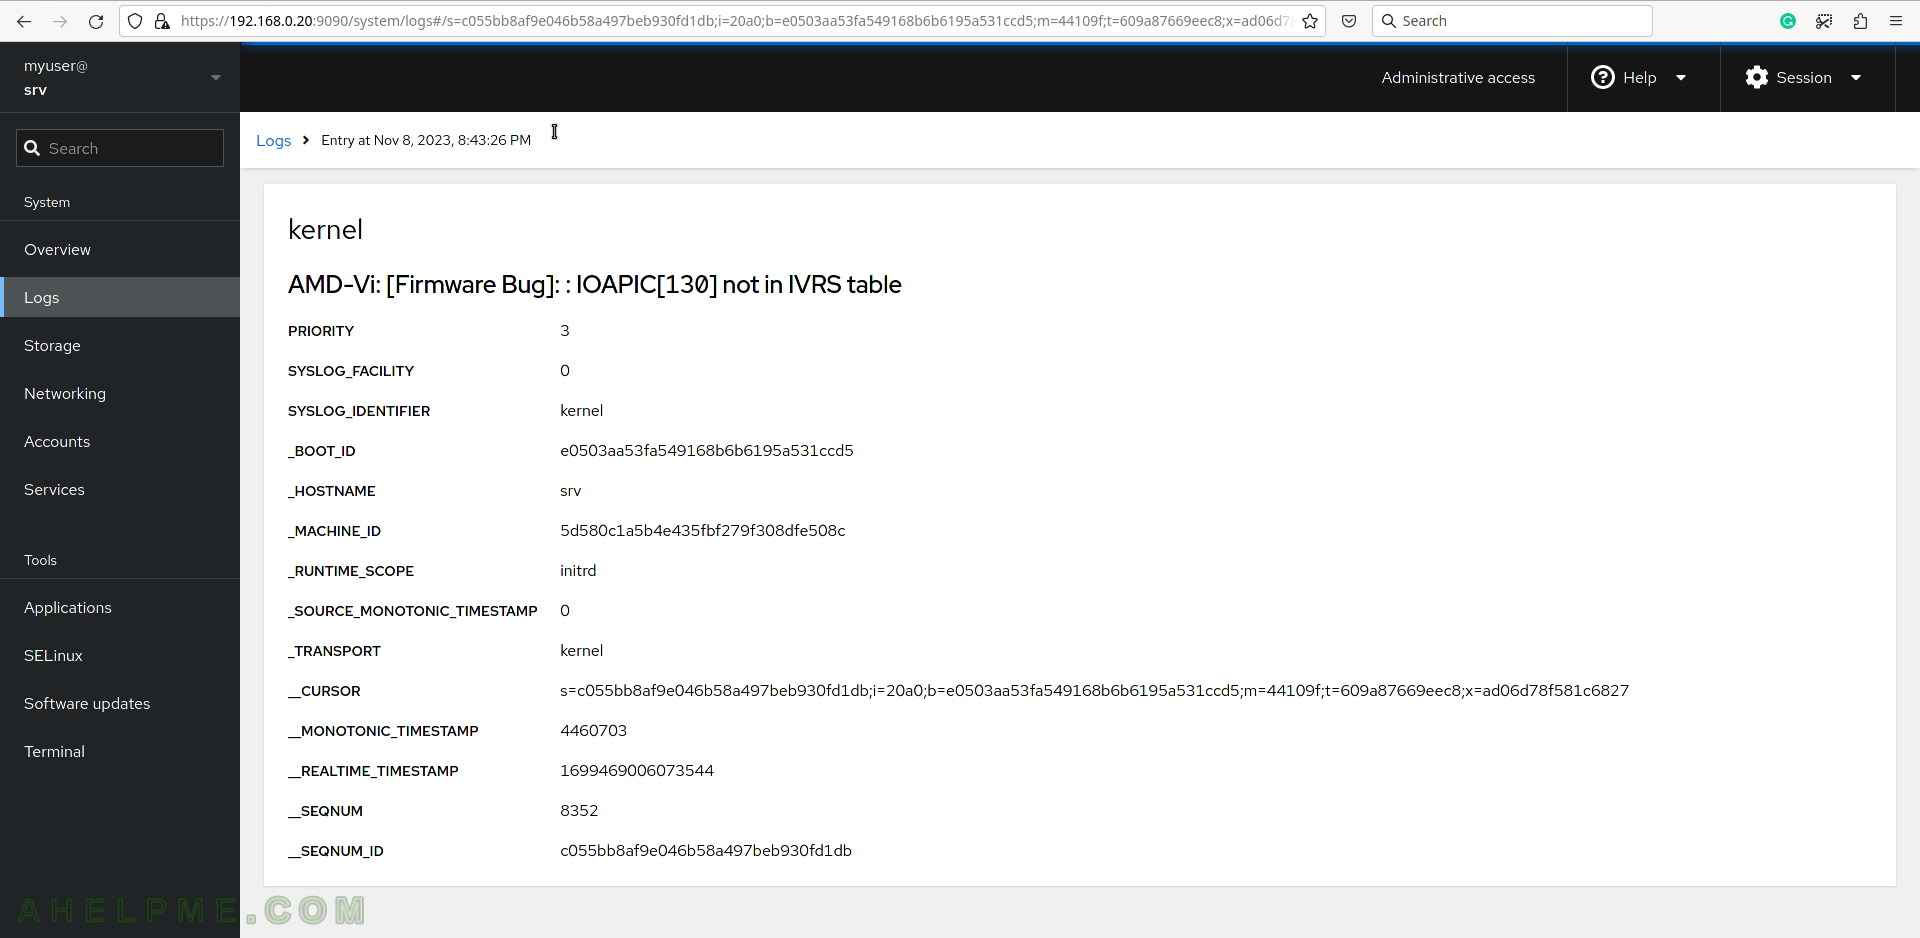
SCREENSHOT 4) Clicking on a log entry will display a detailed page for the error.
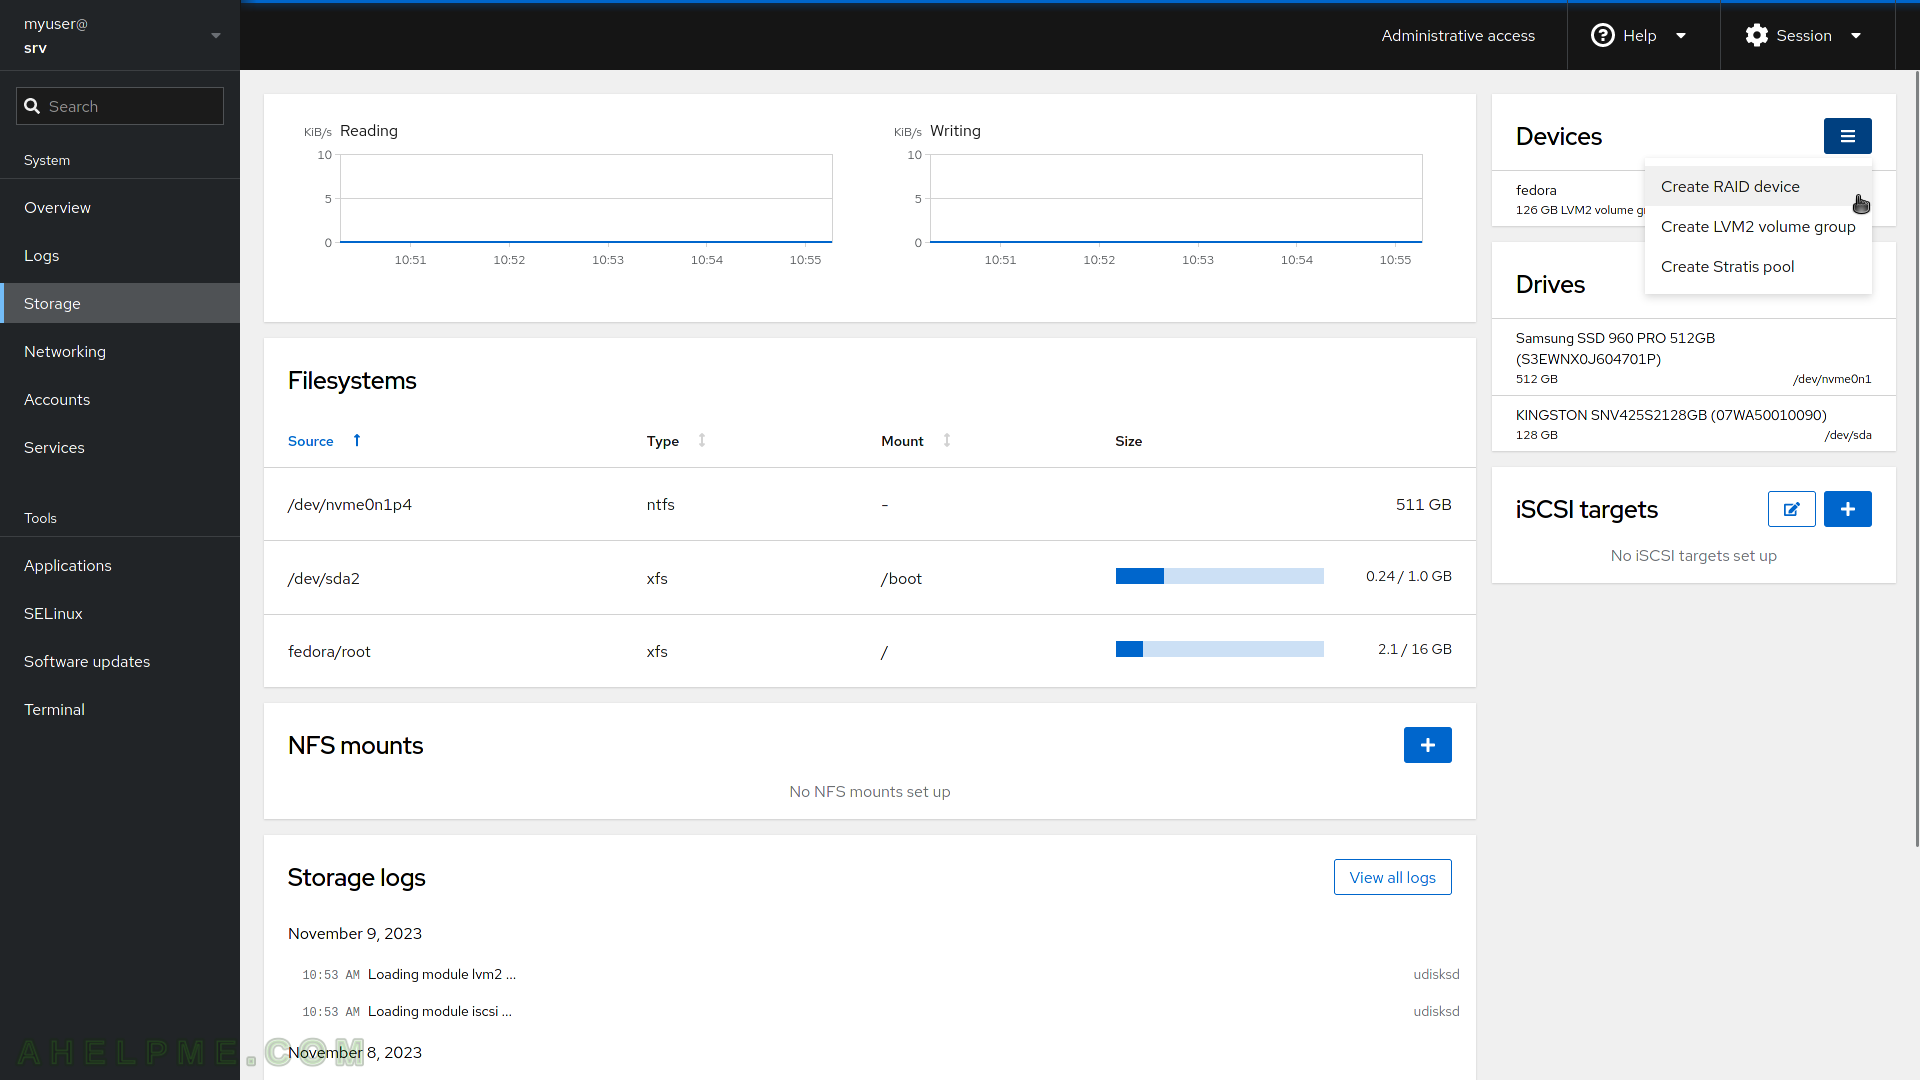
SCREENSHOT 5) The Storage page shows real time read and write statistics, information for the filesystems, drives, devices (there is a RAID functionality), iSCSI targets, and NFS mounts and functionality to add and manage ones.
In addition, there are Storage logs at the bottom of the page.
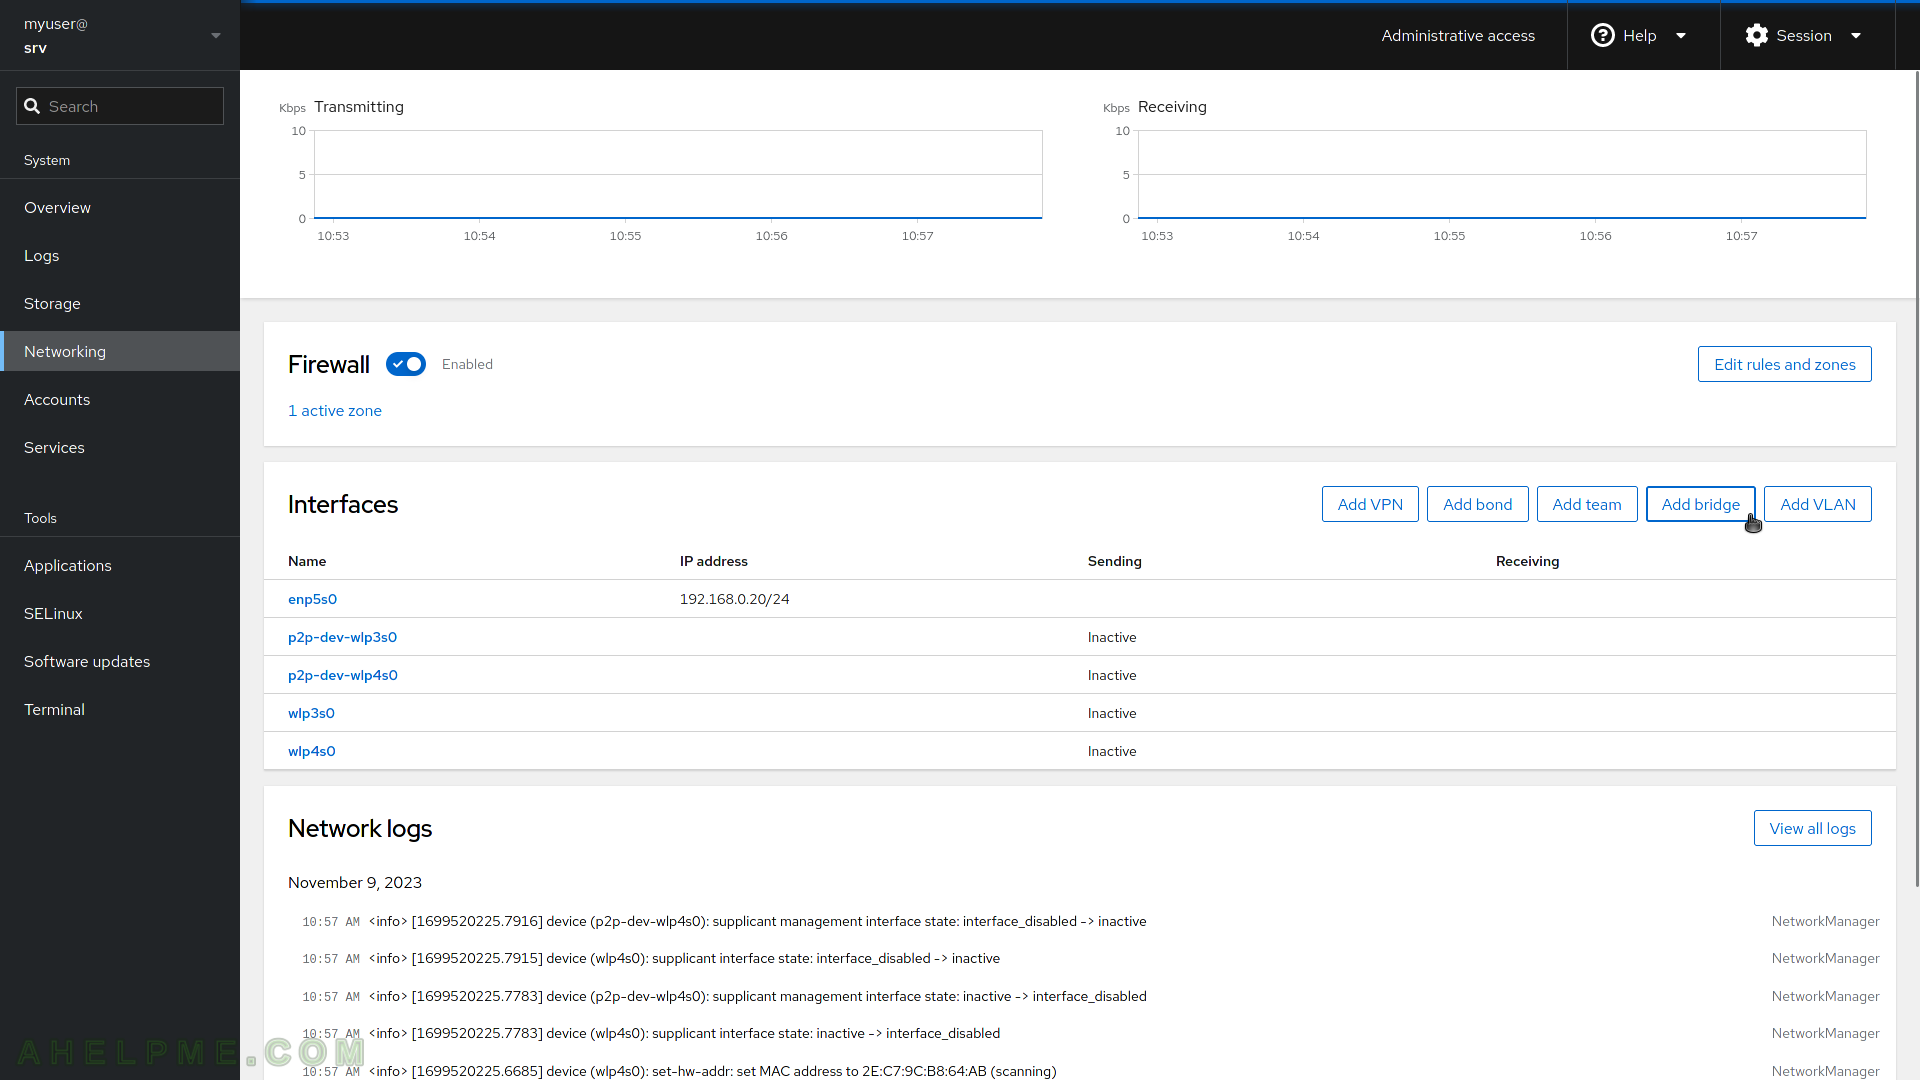
SCREENSHOT 6) The Networking page includes information for real-time Transmitting and Receiving bandwidth.
Firewall rules, which can be added or deleted. All interfaces and the current IP and bandwidth and at the bottom, there are the last records of the Network logs. Networking configurations such as IPv4, IPv6, DNS, MTU, and MAC could be modified.
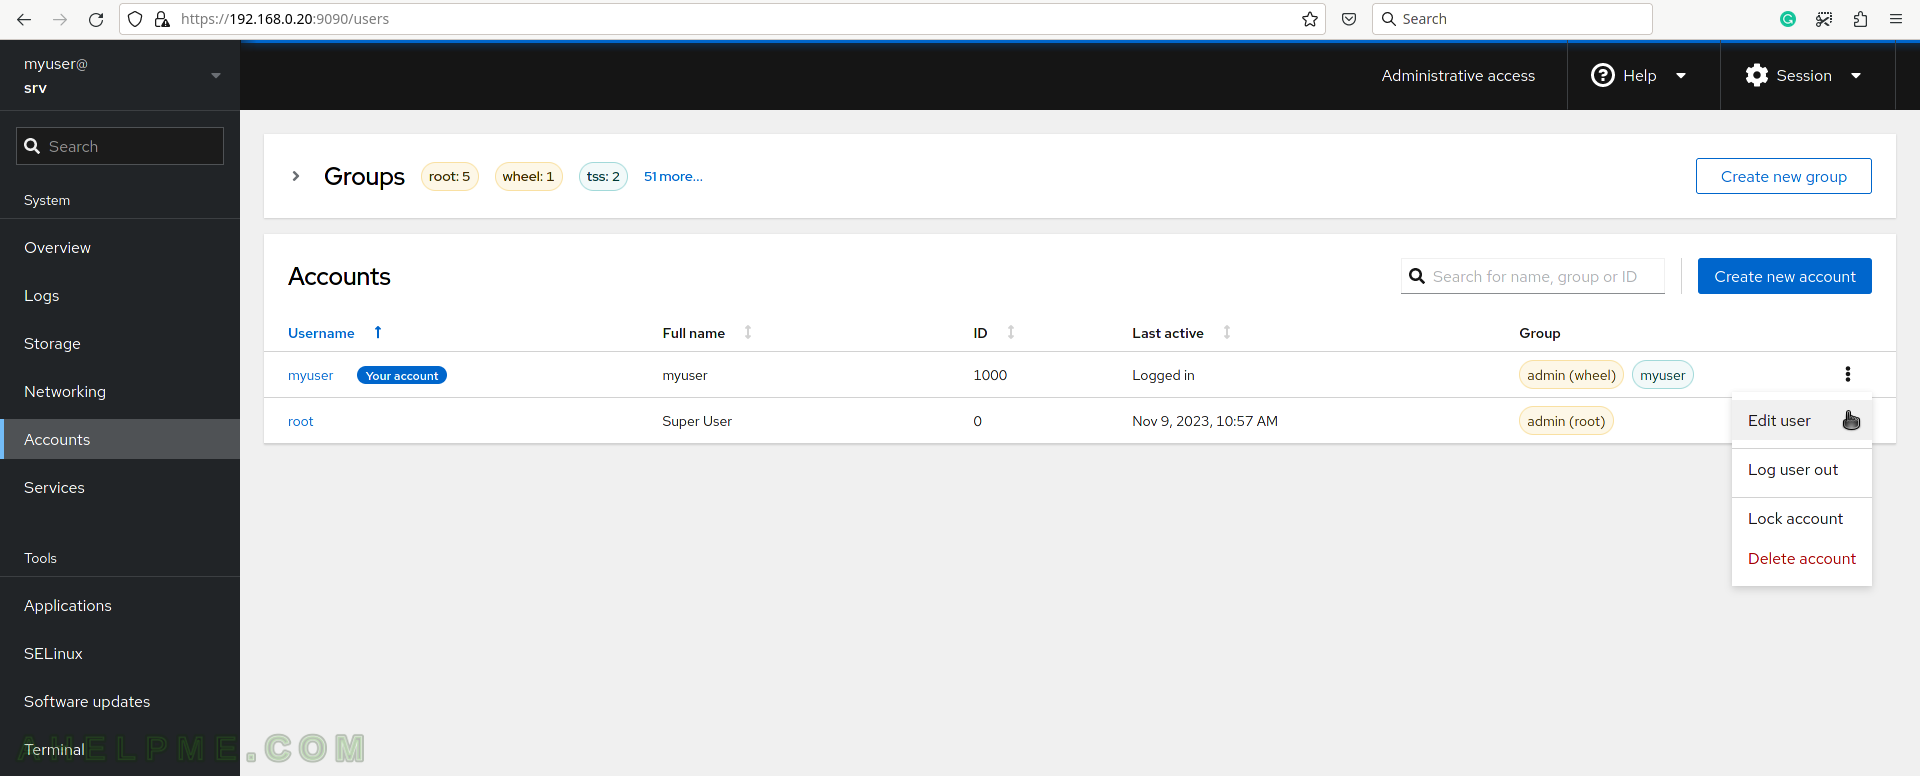
SCREENSHOT 7) All user accounts and simple management such as create, update, delete, lock and Login history.
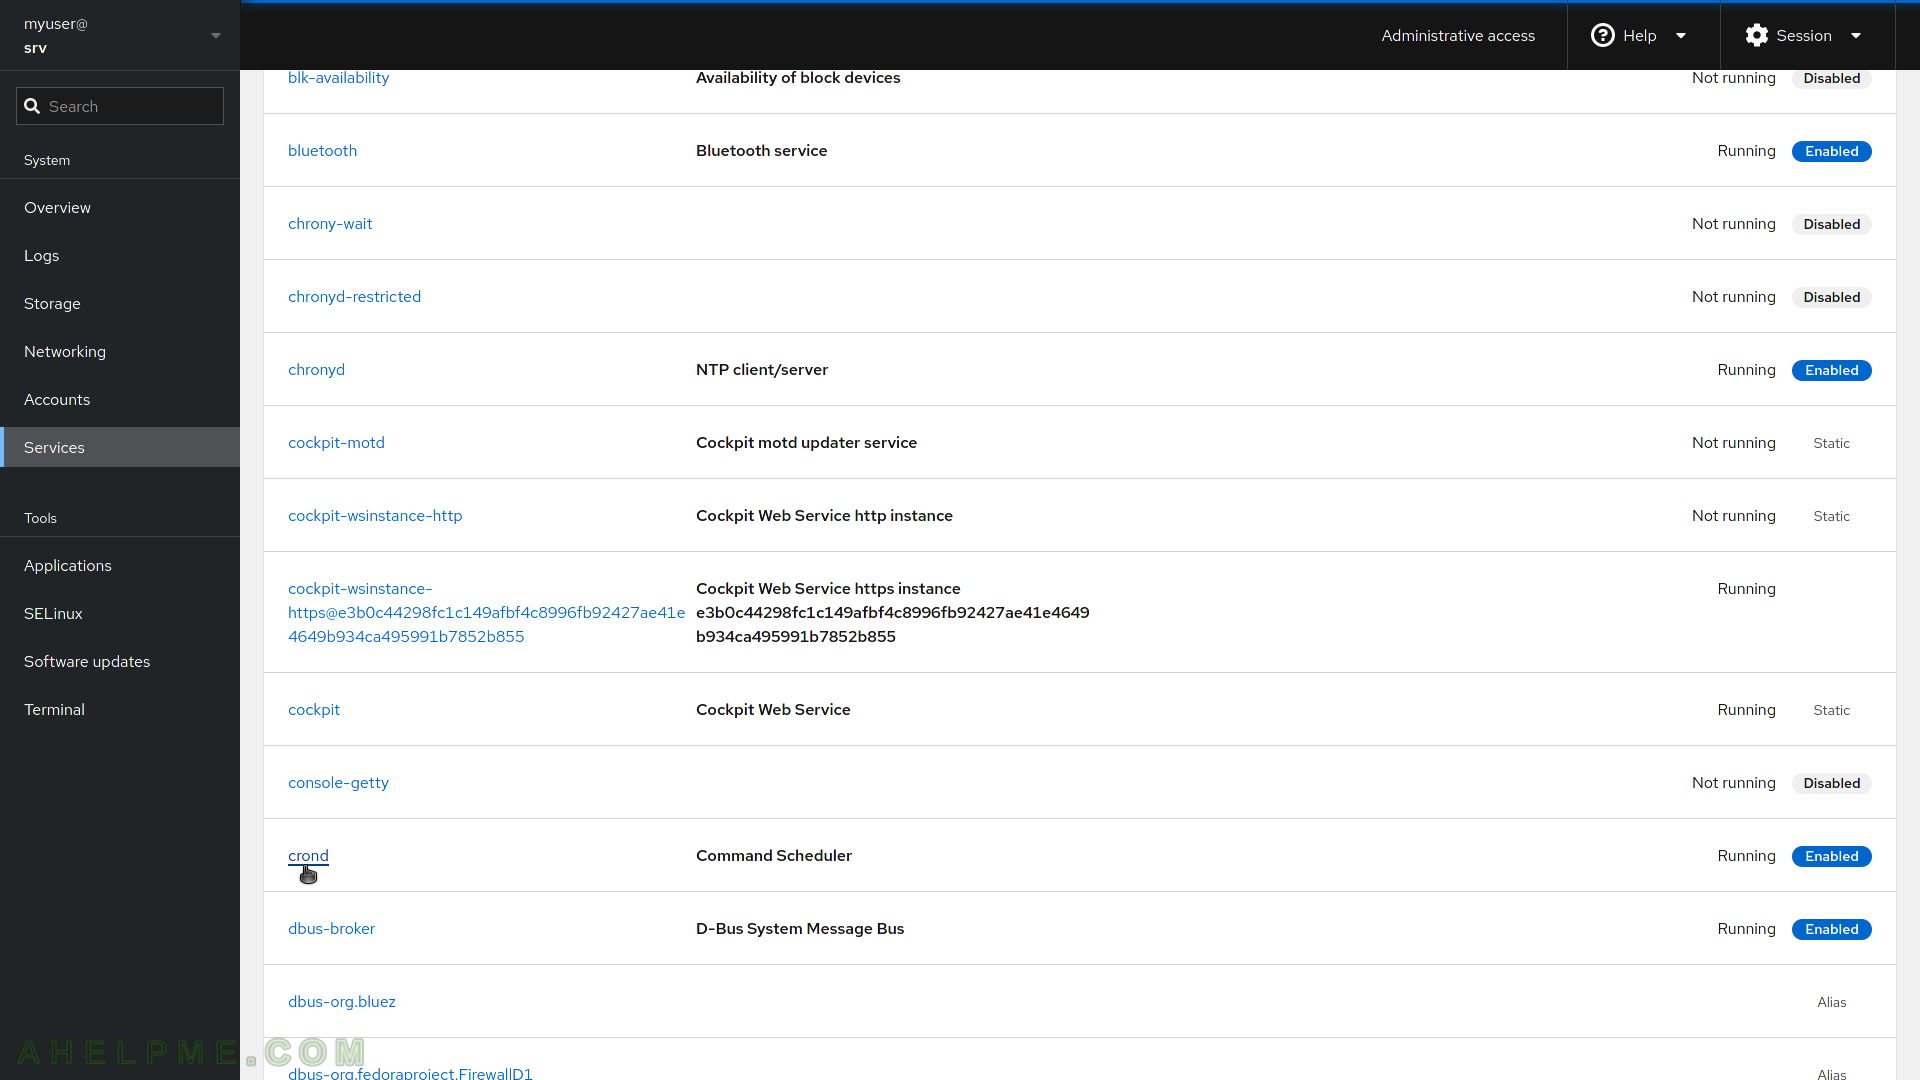
SCREENSHOT 8) Services pages offer management of the systemd services, targets, sockets, timers, and paths.
CLick on a service to show relationships, path, memory, and the last logs.
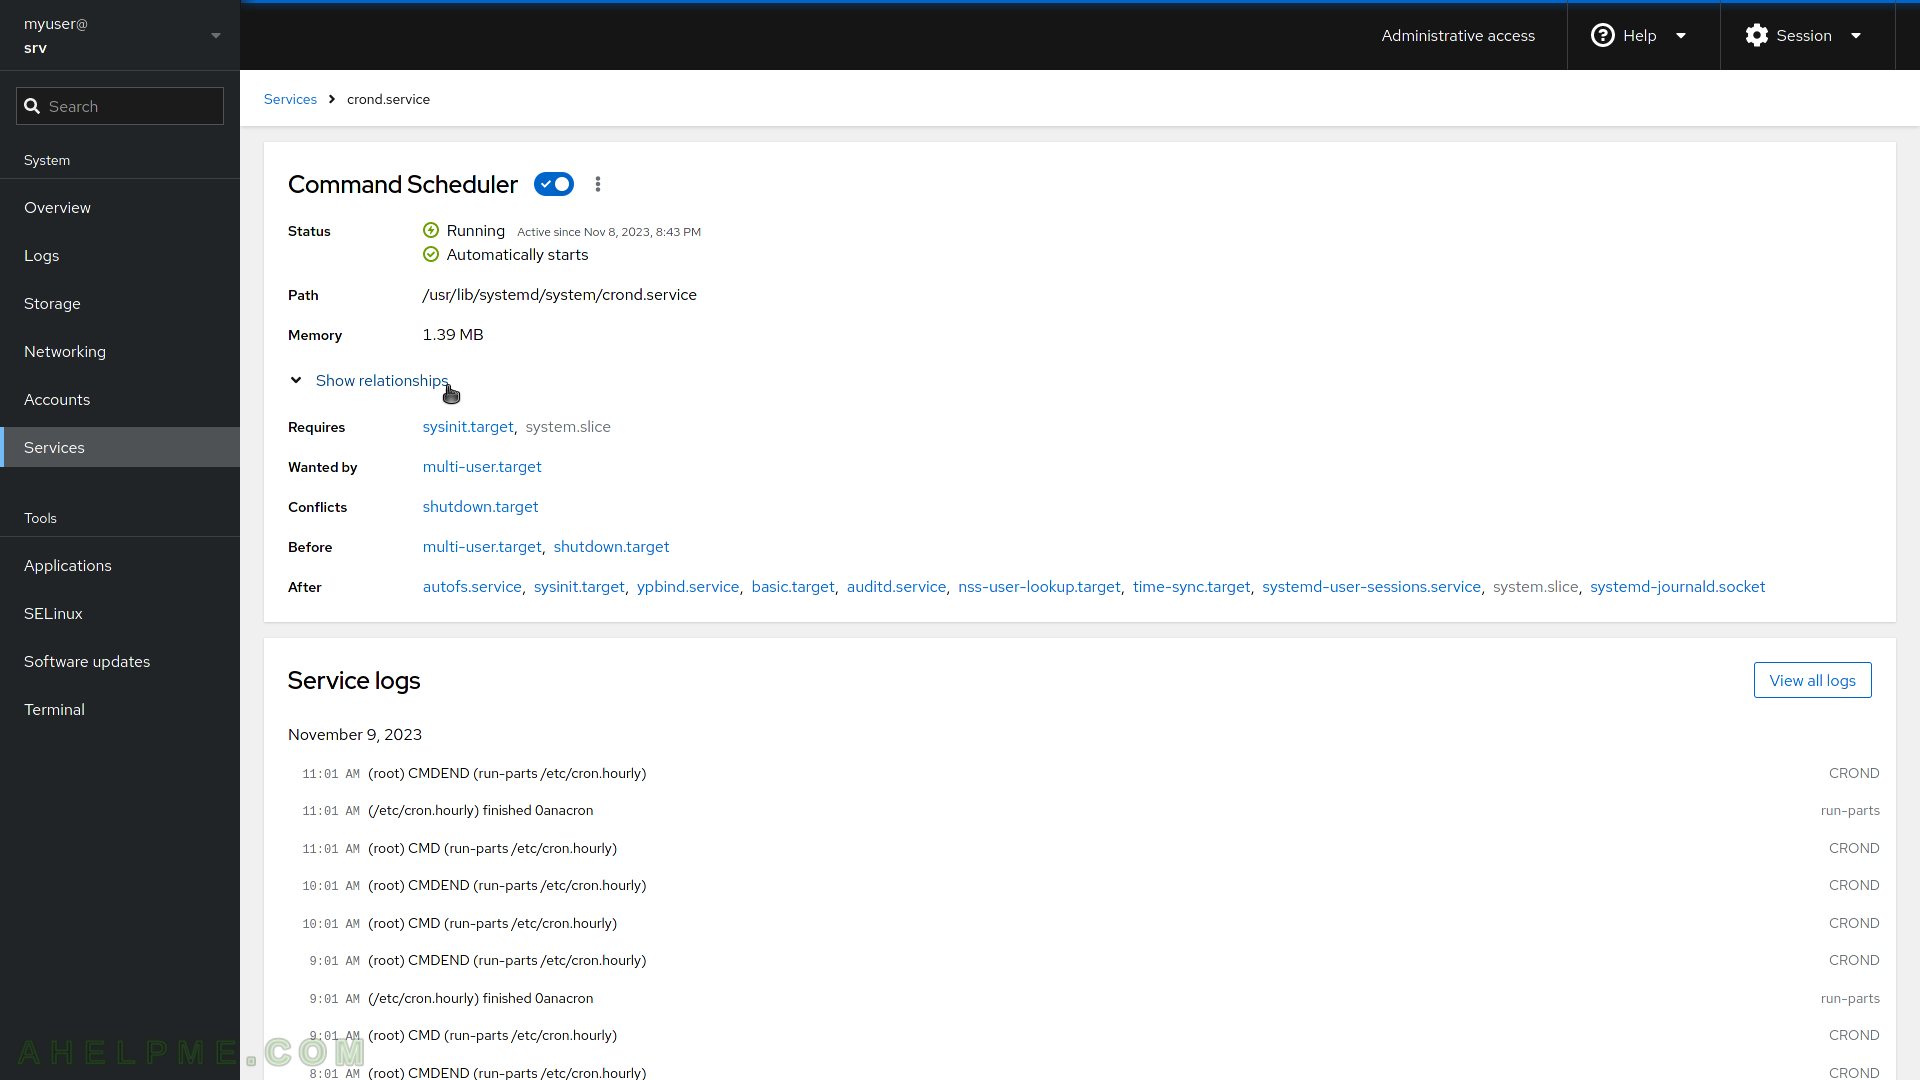
SCREENSHOT 9) Details for each service.
crond, the command scheduler is selected. The page offers a good deal of information – Status, Path, Memory (it is using now), many service related information such as Requires, Wanted By, Conflicts, Before and After. The last entries in the log are also included. It is a good place to learn how the services are related to each other.
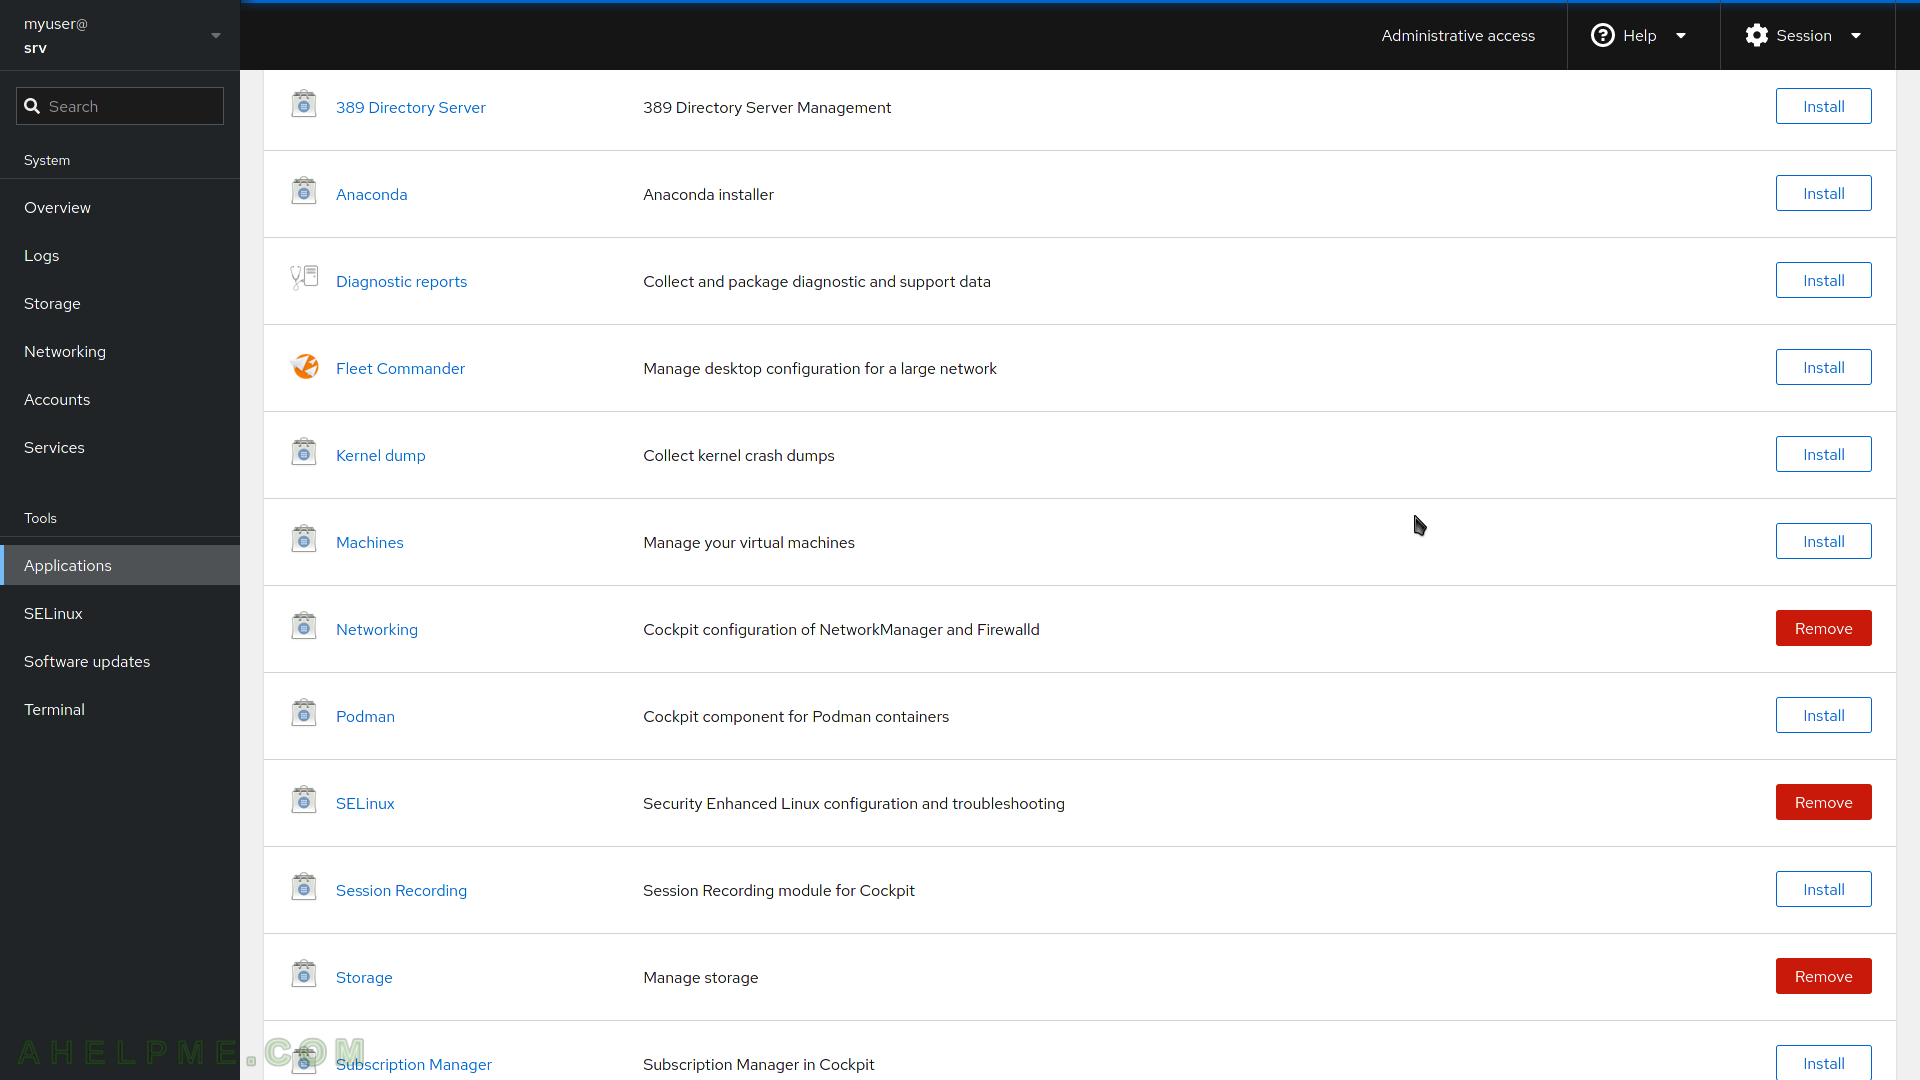
SCREENSHOT 10) To show all applications check if there are new ones with the top left button for a refresh.
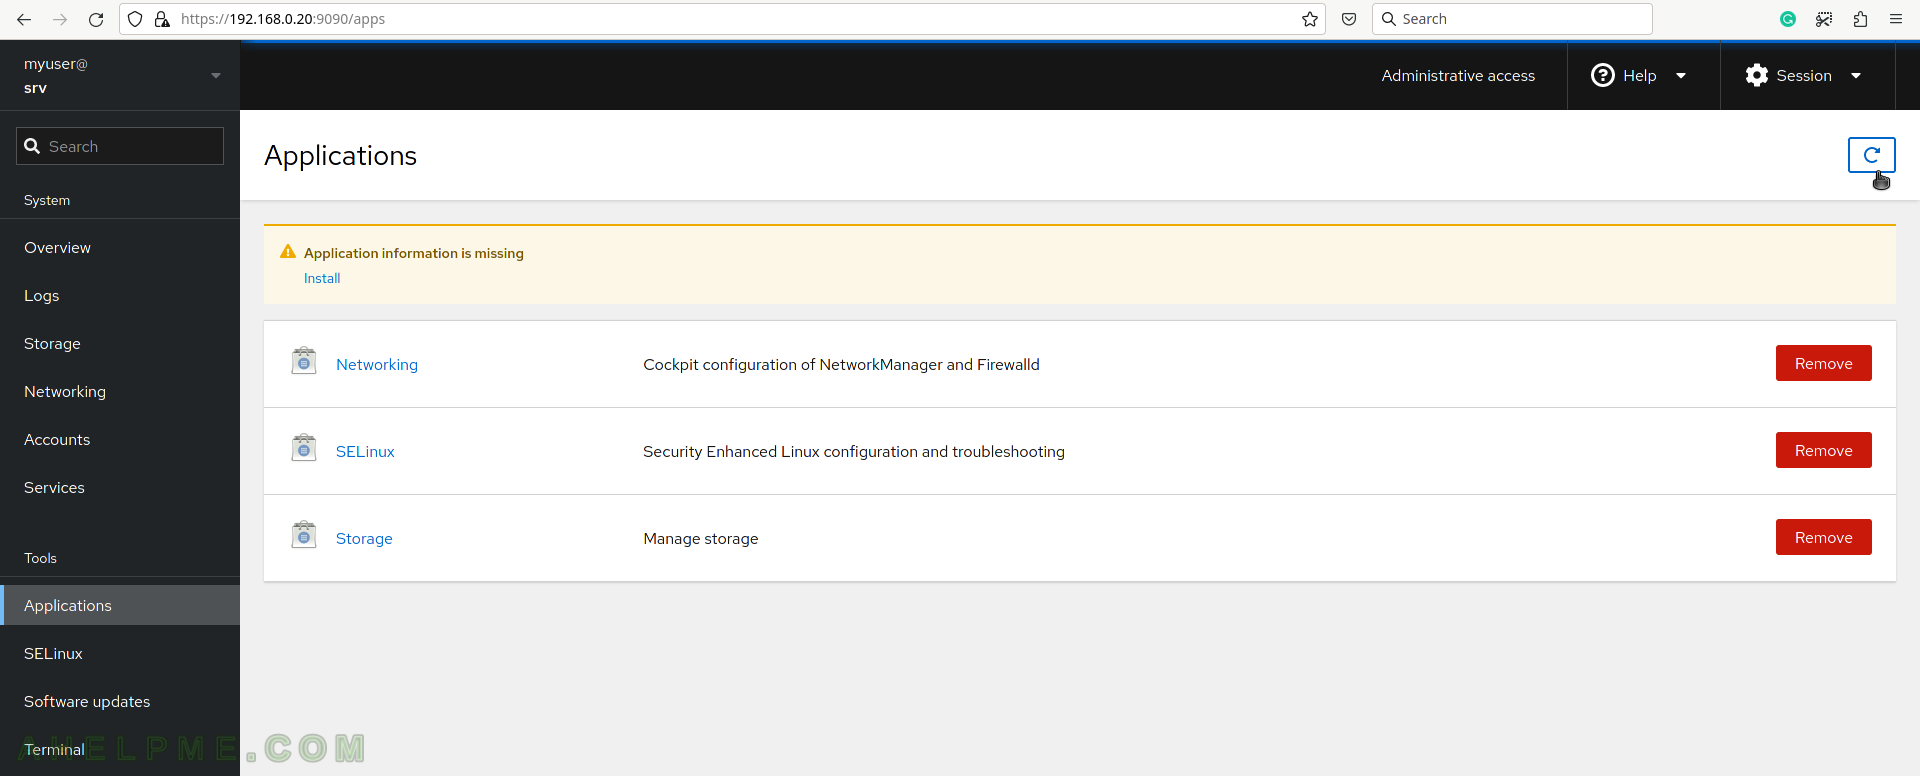
SCREENSHOT 11) In fact, Applications are the cockpit plugins.
The Applications extend the cockpit with new functionality and features. By default, three applications are installed – Networking, SELinux and Storage. Currently, there are around 12 Applications such as container management podman (Red Hat’s docker), Machines, which use libvirt and QEMU to start full virtualized machines, logs, diagnostics, and more.
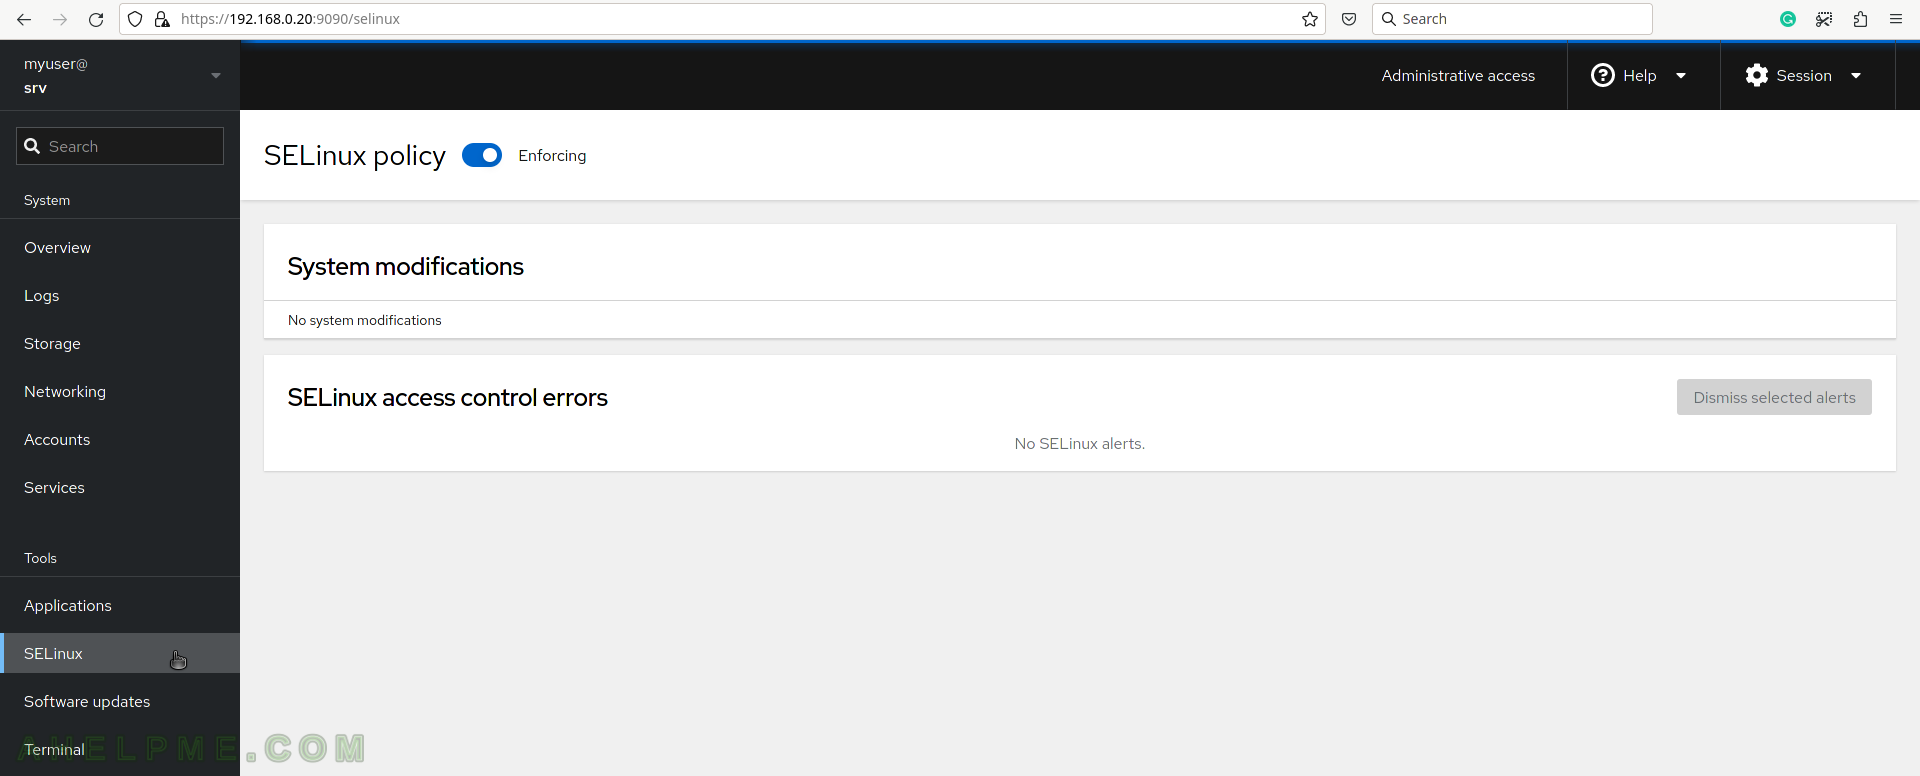
SCREENSHOT 12) SELinux application provides the ability to switch to Enforcing and Permissive modes and there is logging functionality, too.
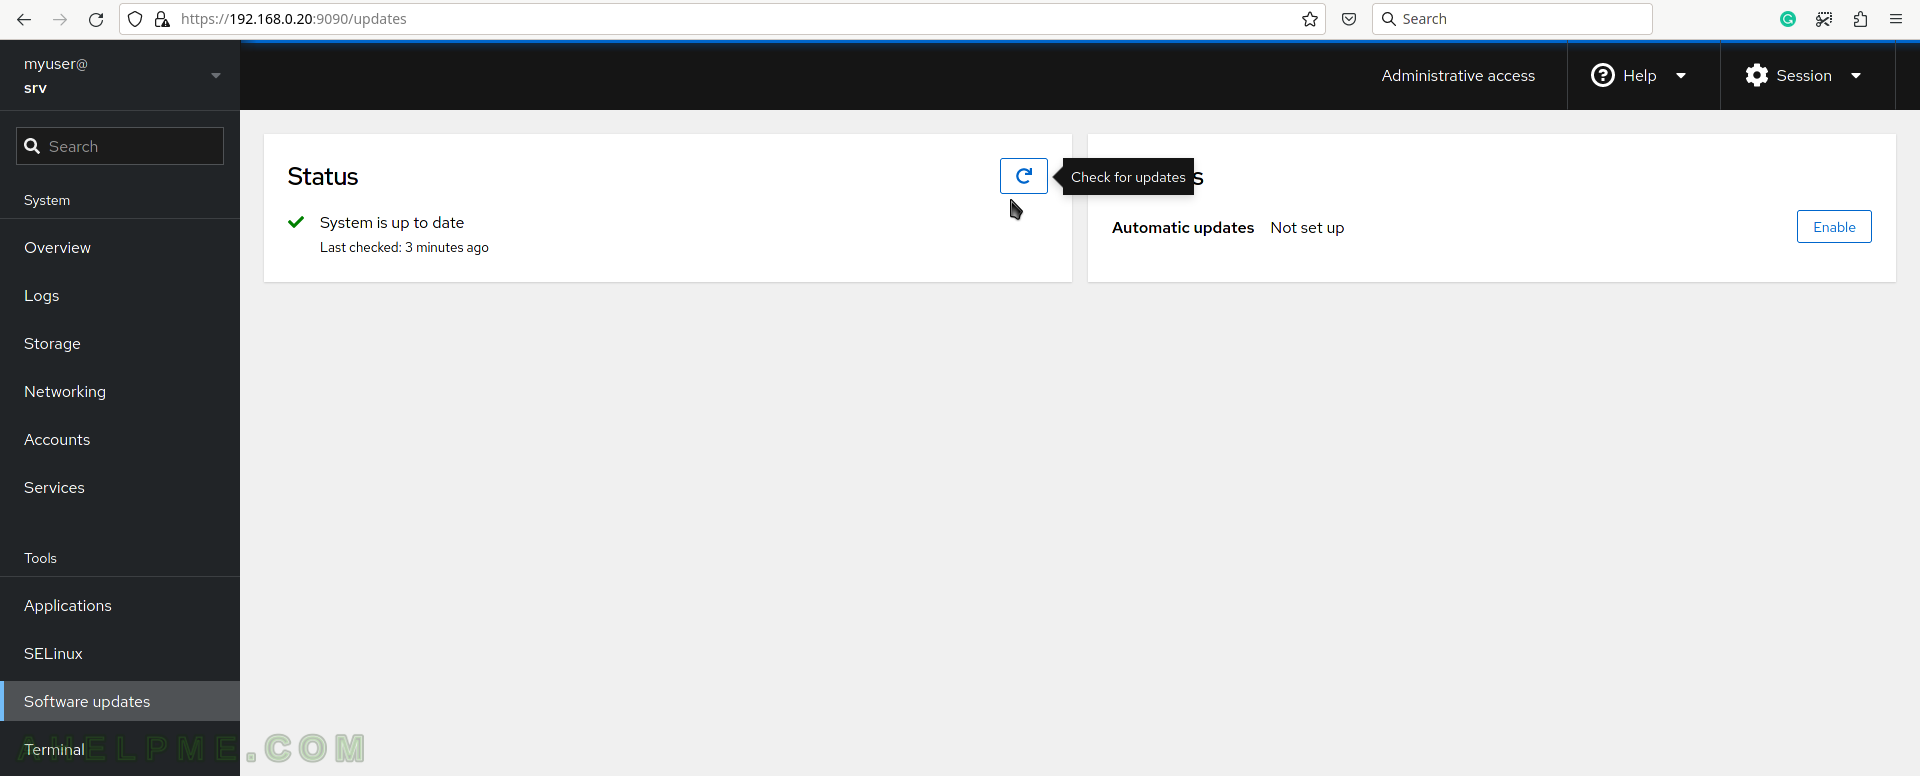
SCREENSHOT 13) The software updates page offers a detailed view of the updates and what kind of updates are pending – critical or not.
There are two main types of choices to install updates – to install only the security ones or all. Click on “Check for updates” to check if there are new updates.
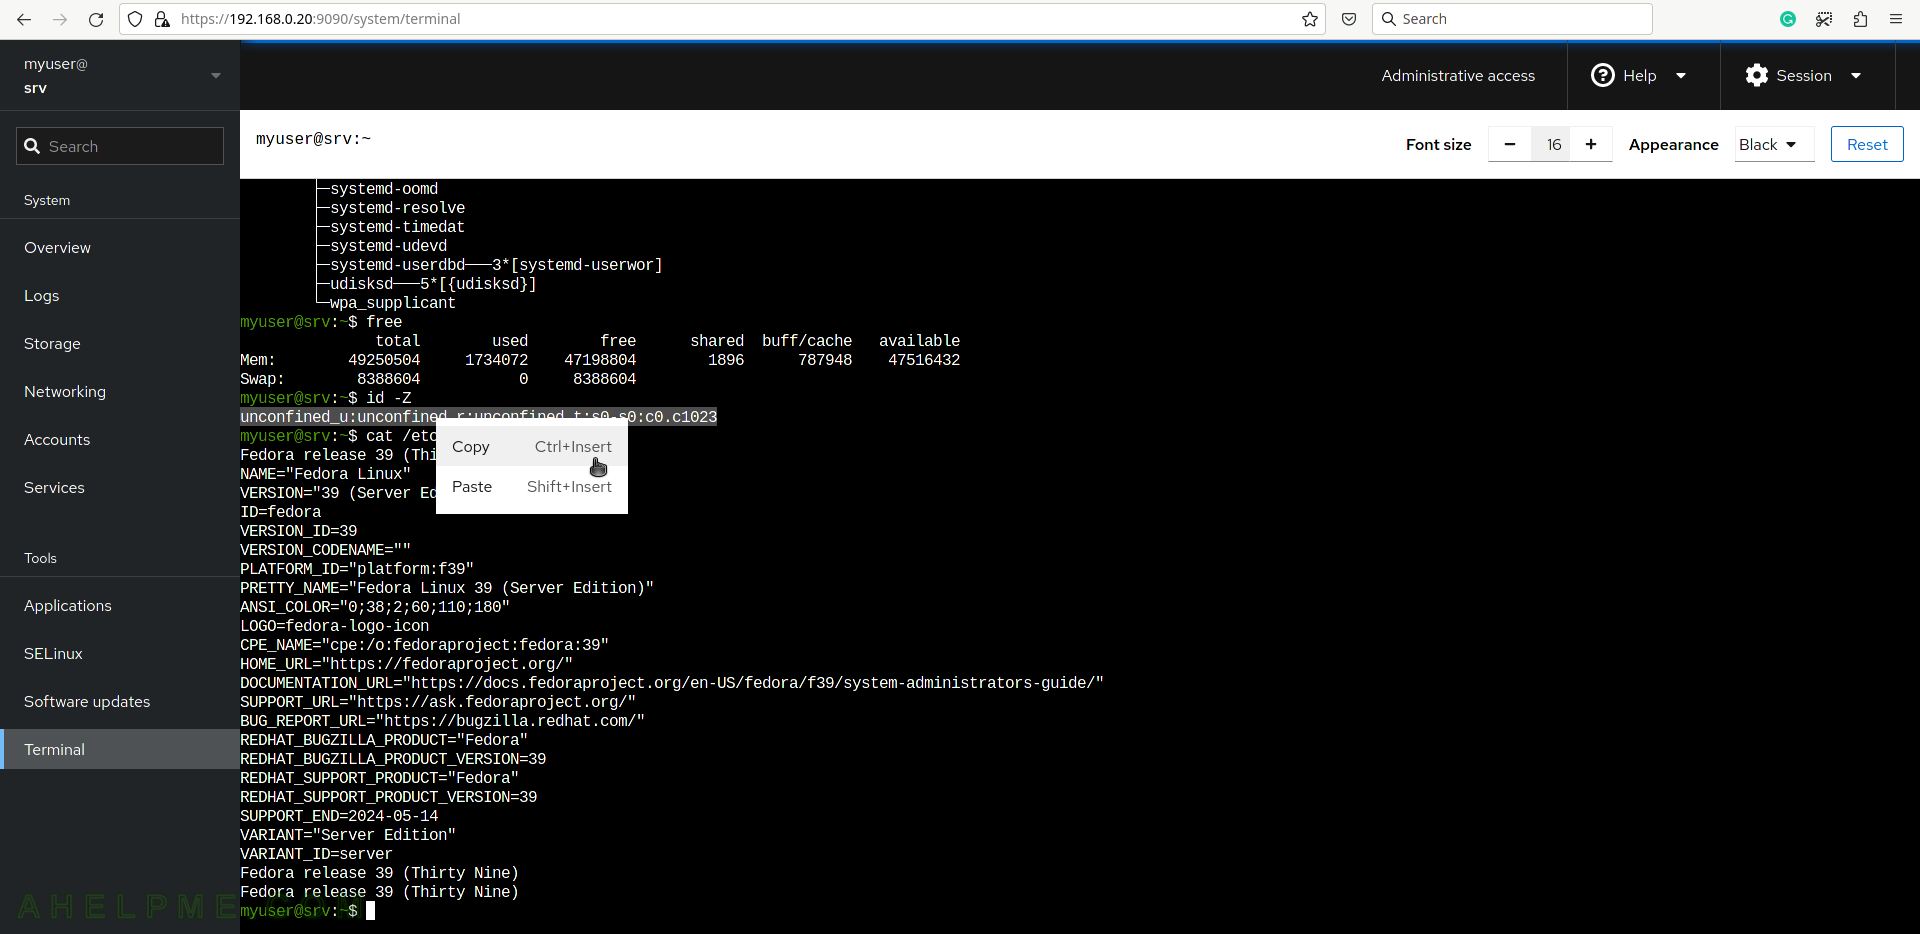
SCREENSHOT 14) There is a terminal application on the web page.
Escalating to the root user is possible. There are COPY and PASTE functionality.