This article is a follow up after the Run podman/docker InfluxDB 1.8 container to collect statistics from collectd, where the time series database InfluxDB stores data and by using Grafana in another container it is easy and lightweight enough to visualize the collected data.
Containerizing the Grafana service is simple enough with docker/podman, but there are several tips and steps to consider before doing it. These steps will significantly ease the maintainer’s life, making upgrading, moving to another server, or backup important data really easy – just stop and start another container with the same options except name and container version.
Here are the important points to mind when running Grafana 9 in a docker/podman container:
- Mount the Grafana configuration directory into the container not only the /etc/grafana/grafana.ini file. It is better than only the configuration file, because it may include the SSL certificate file and key. Download the official example grafana.ini from the source code and put it in a separate directory, which will be mounted in the container.
- Mount the Grafana data directory /var/lib/grafana into the docker/podman container. The data should be out of the container to preserve it over containers’ upgrades and deletes. The same logic is for the Grafana configuration.
- Redirect the ports needed for the current setup. The current default HTTP port is 3000. Use IP only if one IP should expose port 3000.
- Start the docker container on every docker/machine restart (–restart=always).
- Use the daemon (-d), i.e. background, option to run the container without blocking the terminal, i.e. as a background process.
- Prepare a directory for the container, something like /srv/[container-name]. This article will use the /srv/grafana folder. This folder will host the two sub-folders conf for configuration files, the data for InfluxDB data files, and the log directory, which will be mounted into the container.
- It is better to mount the log directory out of the container to preserve the logs after upgrades, for example.
To start the container under CentOS Stream 9 execute with podman.
STEP 1) Install podman and prepare the configuration.
First, install the podman software.
dnf install -y podman
Second, prepare the configuration.
Download the Grafana 9.2 sources and extract the sample configuration and copy it under /srv/grafana/conf, which will be mounted into the container. Or download the files from the Grafana official source code repository – https://github.com/grafana/grafana/tree/main/conf.
[root@srv files]# mkdir -p /srv/grafana/files
[root@srv files]# mkdir /srv/grafana/data
[root@srv files]# mkdir /srv/grafana/logs
[root@srv files]# cd /srv/grafana/files
root@srv files]# wget https://dl.grafana.com/oss/release/grafana-9.2.20.linux-amd64.tar.gz
--2023-08-14 12:48:17--  https://dl.grafana.com/oss/release/grafana-9.2.20.linux-amd64.tar.gz
Resolving dl.grafana.com (dl.grafana.com)... 199.232.194.217, 199.232.198.217, 2a04:4e42:4c::729, ...
Connecting to dl.grafana.com (dl.grafana.com)|199.232.194.217|:443... connected.
HTTP request sent, awaiting response... 200 OK
Length: 70074116 (67M) [application/x-tar]
Saving to: ‘grafana-9.2.20.linux-amd64.tar.gz’

grafana-9.2.20.linux-amd64.tar 100%[=================================================>]  66.83M  11.7MB/s    in 5.7s

2023-08-14 12:48:30 (11.8 MB/s) - ‘grafana-9.2.20.linux-amd64.tar.gz’ saved [70074116/70074116]
[root@srv files]# tar xvf grafana-9.2.20.linux-amd64.tar.gz grafana-9.2.20/conf
grafana-9.2.20/conf
grafana-9.2.20/conf/defaults.ini
grafana-9.2.20/conf/ldap.toml
grafana-9.2.20/conf/ldap_multiple.toml
grafana-9.2.20/conf/provisioning
grafana-9.2.20/conf/provisioning/access-control
grafana-9.2.20/conf/provisioning/access-control/sample.yaml
grafana-9.2.20/conf/provisioning/alerting
grafana-9.2.20/conf/provisioning/alerting/sample.yaml
grafana-9.2.20/conf/provisioning/dashboards
grafana-9.2.20/conf/provisioning/dashboards/sample.yaml
grafana-9.2.20/conf/provisioning/datasources
grafana-9.2.20/conf/provisioning/datasources/sample.yaml
grafana-9.2.20/conf/provisioning/notifiers
grafana-9.2.20/conf/provisioning/notifiers/sample.yaml
grafana-9.2.20/conf/provisioning/plugins
grafana-9.2.20/conf/provisioning/plugins/sample.yaml
grafana-9.2.20/conf/sample.ini
[root@srv files]# mv grafana-9.2.20/conf/defaults.ini grafana-9.2.20/conf/grafana.ini
[root@srv files]# mv grafana-9.2.20/conf ../
[root@srv files]# cd ..
STEP 2) Start the Grafana container and configure the firewall.
The Grafana docker image is maintained by Grafana organization and is verified publisher, so it is safe to pull it from this location. For more tags (i.e. different Grafana versions) use https://hub.docker.com/r/grafana/grafana/tags?page=1
Run the container with:
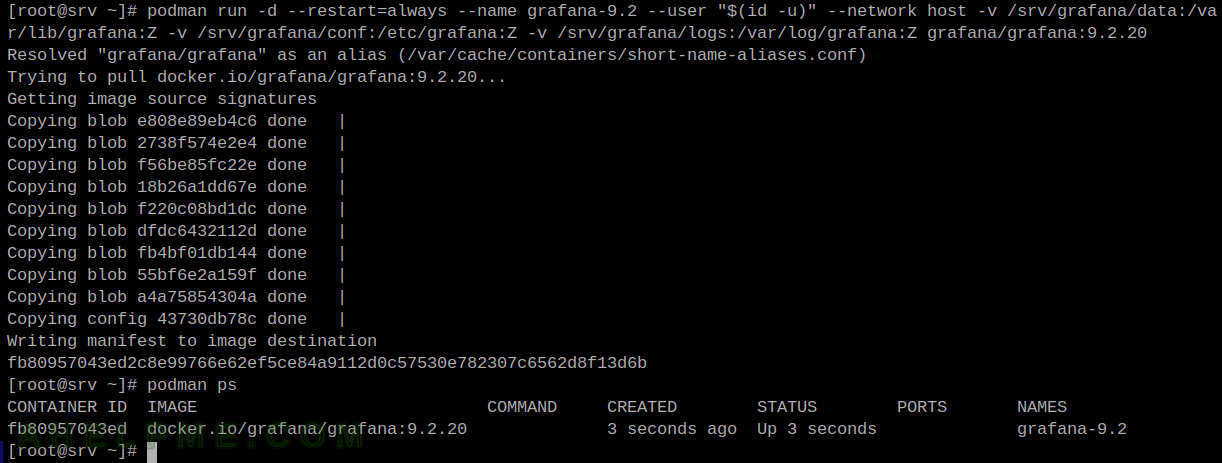
[root@srv ~]# podman run -d --restart=always --name grafana-9.2 --user "$(id -u)" -p 192.168.0.20:3000:3000 -v /srv/grafana/data:/var/lib/grafana:Z -v /srv/grafana/conf:/etc/grafana:Z -v /srv/grafana/logs:/var/log/grafana:Z grafana/grafana:9.2.20
Resolved "grafana/grafana" as an alias (/var/cache/containers/short-name-aliases.conf)
Trying to pull docker.io/grafana/grafana:9.2.20...
Getting image source signatures
Copying blob 2738f574e2e4 done   |
Copying blob e808e89eb4c6 done   |
Copying blob f220c08bd1dc done   |
Copying blob 18b26a1dd67e done   |
Copying blob dfdc6432112d done   |
Copying blob f56be85fc22e done   |
Copying blob fb4bf01db144 done   |
Copying blob 55bf6e2a159f done   |
Copying blob a4a75854304a done   |
Copying config 43730db78c done   |
Writing manifest to image destination
fee223bd60fb35275c983fe7dca5fcc4f4839ba904905a3fb2dc30ed02772bb9
[root@srv ~]# podman ps
CONTAINER ID  IMAGE                             COMMAND     CREATED        STATUS        PORTS                        NAMES
fee223bd60fb  docker.io/grafana/grafana:9.2.20              4 seconds ago  Up 4 seconds  192.168.0.20:3000->3000/tcp  grafana-9.2
The Grafana is started and it could be verified by reading the logs – /srv/grafana/logs/grafana.log or podman/docker logs command. A simple network configuration would be to add the “–network host” to the podman/docker options (and remove the mappings of the IPs/ports) to execute the container in the network stack of the host computer. So the host’s internal (or external) network is visible for the programs (Grafana server) in the container.
[root@srv ~]# podman run -d --restart=always --name grafana-9.2 --user "$(id -u)" --network host -v /srv/grafana/data:/var/lib/grafana:Z -v /srv/grafana/conf:/etc/grafana:Z -v /srv/grafana/logs:/var/log/grafana:Z grafana/grafana:9.2.20
835084d4a402727249acc782bb048a710db0f07edddcca9a5b0250808df0be78
[root@srv ~]# podman logs grafana-9.2
Grafana server is running with elevated privileges. This is not recommended
logger=settings t=2023-08-15T13:15:20.217441916Z level=info msg="Starting Grafana" version=9.2.20 commit=8d9c05a160 branch=HEAD compiled=2023-06-07T06:27:34Z
logger=settings t=2023-08-15T13:15:20.218692978Z level=info msg="Config loaded from" file=/usr/share/grafana/conf/defaults.ini
logger=settings t=2023-08-15T13:15:20.218736257Z level=info msg="Config loaded from" file=/etc/grafana/grafana.ini
logger=settings t=2023-08-15T13:15:20.218744668Z level=info msg="Config overridden from command line" arg="default.paths.data=/var/lib/grafana"
logger=settings t=2023-08-15T13:15:20.218751718Z level=info msg="Config overridden from command line" arg="default.paths.logs=/var/log/grafana"
logger=settings t=2023-08-15T13:15:20.21875845Z level=info msg="Config overridden from command line" arg="default.paths.plugins=/var/lib/grafana/plugins"
logger=settings t=2023-08-15T13:15:20.218764753Z level=info msg="Config overridden from command line" arg="default.paths.provisioning=/etc/grafana/provisioning"
logger=settings t=2023-08-15T13:15:20.218771242Z level=info msg="Config overridden from command line" arg="default.log.mode=console"
logger=settings t=2023-08-15T13:15:20.21929801Z level=info msg="Config overridden from Environment variable" var="GF_PATHS_DATA=/var/lib/grafana"
logger=settings t=2023-08-15T13:15:20.219325577Z level=info msg="Config overridden from Environment variable" var="GF_PATHS_LOGS=/var/log/grafana"
logger=settings t=2023-08-15T13:15:20.219333199Z level=info msg="Config overridden from Environment variable" var="GF_PATHS_PLUGINS=/var/lib/grafana/plugins"
logger=settings t=2023-08-15T13:15:20.219340137Z level=info msg="Config overridden from Environment variable" var="GF_PATHS_PROVISIONING=/etc/grafana/provisioning"
logger=settings t=2023-08-15T13:15:20.219351845Z level=info msg="Path Home" path=/usr/share/grafana
logger=settings t=2023-08-15T13:15:20.219639836Z level=info msg="Path Data" path=/var/lib/grafana
logger=settings t=2023-08-15T13:15:20.219654831Z level=info msg="Path Logs" path=/var/log/grafana
logger=settings t=2023-08-15T13:15:20.219661772Z level=info msg="Path Plugins" path=/var/lib/grafana/plugins
logger=settings t=2023-08-15T13:15:20.219668623Z level=info msg="Path Provisioning" path=/etc/grafana/provisioning
logger=settings t=2023-08-15T13:15:20.219676379Z level=info msg="App mode production"
logger=sqlstore t=2023-08-15T13:15:20.222519528Z level=info msg="Connecting to DB" dbtype=sqlite3
logger=migrator t=2023-08-15T13:15:20.260646803Z level=info msg="Starting DB migrations"
logger=migrator t=2023-08-15T13:15:20.268597278Z level=info msg="migrations completed" performed=0 skipped=452 duration=739.259µs
logger=plugin.finder t=2023-08-15T13:15:20.405510083Z level=warn msg="Skipping finding plugins as directory does not exist" path=/usr/share/grafana/plugins-bundled
logger=secrets t=2023-08-15T13:15:20.406053386Z level=info msg="Envelope encryption state" enabled=true currentprovider=secretKey.v1
logger=query_data t=2023-08-15T13:15:20.419201932Z level=info msg="Query Service initialization"
logger=live.push_http t=2023-08-15T13:15:20.437333171Z level=info msg="Live Push Gateway initialization"
logger=infra.usagestats.collector t=2023-08-15T13:15:20.588076101Z level=info msg="registering usage stat providers" usageStatsProvidersLen=2
logger=provisioning.alerting t=2023-08-15T13:15:20.589142568Z level=info msg="starting to provision alerting"
logger=provisioning.alerting t=2023-08-15T13:15:20.589180843Z level=info msg="finished to provision alerting"
logger=ngalert t=2023-08-15T13:15:20.605473171Z level=info msg="warming cache for startup"
logger=grafanaStorageLogger t=2023-08-15T13:15:20.608645867Z level=info msg="storage starting"
logger=http.server t=2023-08-15T13:15:20.609035987Z level=info msg="HTTP Server Listen" address=[::]:3000 protocol=http subUrl= socket=
logger=ticker t=2023-08-15T13:15:20.649492166Z level=info msg=starting first_tick=2023-08-15T13:15:30Z
logger=ngalert.multiorg.alertmanager t=2023-08-15T13:15:20.649683631Z level=info msg="starting MultiOrg Alertmanager"
Note, the Grafana is running by root, using podman under CentOS Stream 9 it may be running within an unprivileged container by a user.
Do not forget to configure the firewall (firewalld in CentOS Stream 9) to accept port 3000.
[root@srv grafana]# firewall-cmd --permanent --zone=public --add-rich-rule="rule family="ipv4" source address="192.168.0.0/24" port protocol="tcp" port="3000" accept"
success
[root@srv influxdb]# firewall-cmd --reload
success
[root@srv influxdb]# firewall-cmd --list-all
public (active)
  target: default
  icmp-block-inversion: no
  interfaces: enp0s3
  sources:
  services: cockpit dhcpv6-client ssh
  ports:
  protocols:
  forward: yes
  masquerade: no
  forward-ports:
  source-ports:
  icmp-blocks:
  rich rules:
        rule family="ipv4" source address="192.168.0.0/24" port port="3000" protocol="tcp" accept
And after allowing the IPs from the 192.168.1.0/24 network to access the Grafana web interface on port 3000.
STEP 3) Enable the Grafana container to autoboot on restart of the system.
The last step is to make a systemd service, which will start the podman container on boot (unfortunately, the –restart option will not work for podman, only for docker!).
[root@srv ~]# podman generate systemd --new --name grafana-9.2 > /etc/systemd/system/grafana-9.2.service
[root@srv ~]# systemctl daemon-reload
[root@srv ~]# systemctl start grafana-9.2
[root@srv ~]# systemctl enable grafana-9.2
Created symlink /etc/systemd/system/default.target.wants/grafana-9.2.service → /etc/systemd/system/grafana-9.2.service.
[root@srv ~]# systemctl status grafana-9.2
● grafana-9.2.service - Podman container-grafana-9.2.service
     Loaded: loaded (/etc/systemd/system/grafana-9.2.service; enabled; vendor preset: disabled)
     Active: active (running) since Tue 2023-08-15 13:21:58 UTC; 11s ago
       Docs: man:podman-generate-systemd(1)
   Main PID: 6396 (conmon)
      Tasks: 1 (limit: 23020)
     Memory: 708.0K
        CPU: 265ms
     CGroup: /system.slice/grafana-9.2.service
             └─6396 /usr/bin/conmon --api-version 1 -c aba7f30beaf1d8e777eb1da8a0d7101aad1cc486898b901ec6bf2a7a87853c47 -u aba7f30beaf1d8e777eb1da8a0d7101aad1cc486898b901ec6bf2a7a87853c47 >

Aug 15 13:21:59 srv grafana-9.2[6396]: logger=infra.usagestats.collector t=2023-08-15T13:21:59.173634242Z level=info msg="registering usage stat providers" usageStatsProvidersLen=2
Aug 15 13:21:59 srv grafana-9.2[6396]: logger=provisioning.alerting t=2023-08-15T13:21:59.174412191Z level=info msg="starting to provision alerting"
Aug 15 13:21:59 srv grafana-9.2[6396]: logger=provisioning.alerting t=2023-08-15T13:21:59.174453354Z level=info msg="finished to provision alerting"
Aug 15 13:21:59 srv grafana-9.2[6396]: logger=http.server t=2023-08-15T13:21:59.178655281Z level=info msg="HTTP Server Listen" address=[::]:3000 protocol=http subUrl= socket=
Aug 15 13:21:59 srv grafana-9.2[6396]: logger=ngalert t=2023-08-15T13:21:59.17918303Z level=info msg="warming cache for startup"
Aug 15 13:21:59 srv grafana-9.2[6396]: logger=grafanaStorageLogger t=2023-08-15T13:21:59.189484745Z level=info msg="storage starting"
Aug 15 13:21:59 srv grafana-9.2[6396]: logger=ticker t=2023-08-15T13:21:59.225999025Z level=info msg=starting first_tick=2023-08-15T13:22:00Z
Aug 15 13:21:59 srv grafana-9.2[6396]: logger=ngalert.multiorg.alertmanager t=2023-08-15T13:21:59.226084319Z level=info msg="starting MultiOrg Alertmanager"
Aug 15 13:21:59 srv grafana-9.2[6396]: logger=context userId=1 orgId=1 uname=admin t=2023-08-15T13:21:59.651745606Z level=info msg="Request Completed" method=GET path=/api/live/ws status=->
Aug 15 13:21:59 srv grafana-9.2[6396]: logger=context userId=1 orgId=1 uname=admin t=2023-08-15T13:21:59.735982145Z level=info msg="Request Completed" method=GET path=/api/live/ws status=->
This is how to generate a root service, which will be controlled by the systemd. Because podman may execute unprivileged containers, podman generate systemd could be used to set a user systemd service, but this is beyond the scope of this article.
Under Ubuntu world
Under Ubuntu, use docker command instead of the podman in all of the above commands. Of course, podman is also available under Ubuntu Server 22.04, so podman should be good, too.
Note, under Ubuntu server 22.04.1 to install docker is:
apt update
apt install docker.io
systemctl enable docker
#or install podman with
apt install podman-docker
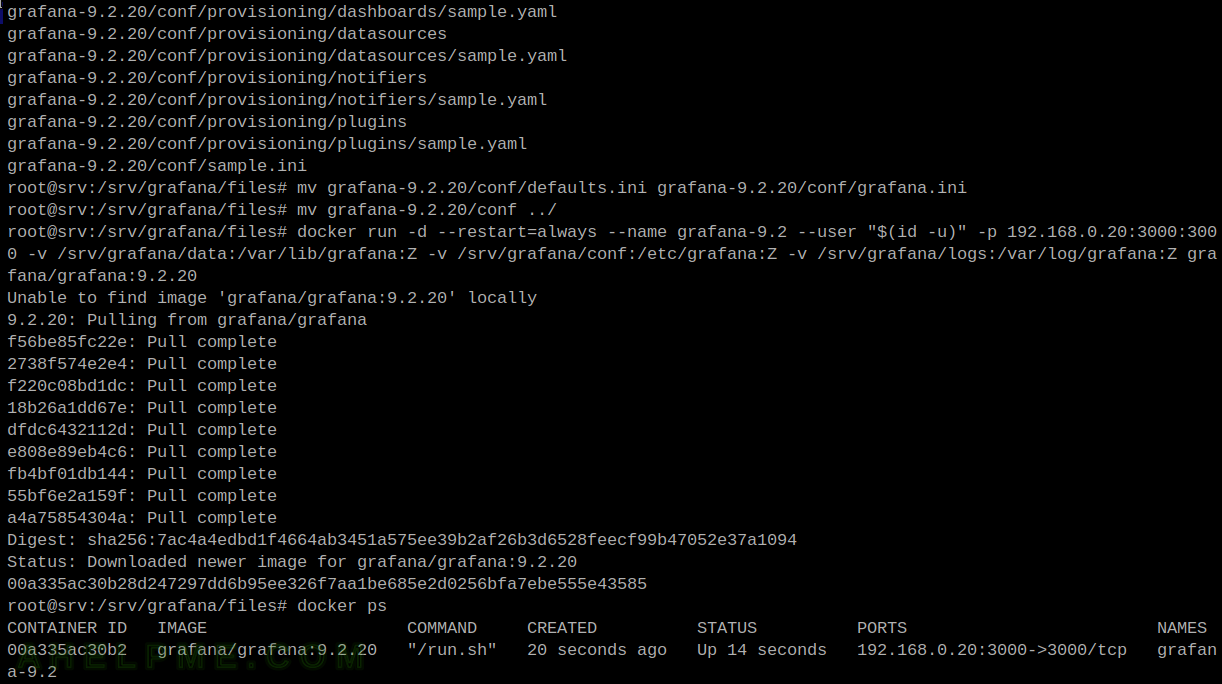
After following the above configuration with /srv/grafana directory, execute the docker command.
root@srv:/srv/grafana/files# docker run -d --restart=always --name grafana-9.2 --user "$(id -u)" -p 192.168.0.20:3000:3000 -v /srv/grafana/data:/var/lib/grafana:Z -v /srv/grafana/conf:/etc/grafana:Z -v /srv/grafana/logs:/var/log/grafana:Z grafana/grafana:9.2.20
Unable to find image 'grafana/grafana:9.2.20' locally
9.2.20: Pulling from grafana/grafana
f56be85fc22e: Pull complete
2738f574e2e4: Pull complete
f220c08bd1dc: Pull complete
18b26a1dd67e: Pull complete
dfdc6432112d: Pull complete
e808e89eb4c6: Pull complete
fb4bf01db144: Pull complete
55bf6e2a159f: Pull complete
a4a75854304a: Pull complete
Digest: sha256:7ac4a4edbd1f4664ab3451a575ee39b2af26b3d6528feecf99b47052e37a1094
Status: Downloaded newer image for grafana/grafana:9.2.20
00a335ac30b28d247297dd6b95ee326f7aa1be685e2d0256bfa7ebe555e43585
root@srv:/srv/grafana/files# docker ps
CONTAINER ID   IMAGE                    COMMAND     CREATED          STATUS          PORTS                         NAMES
00a335ac30b2   grafana/grafana:9.2.20   "/run.sh"   20 seconds ago   Up 14 seconds   192.168.0.20:3000->3000/tcp   grafana-9.2
root@srv:/srv/grafana/files# wget 192.168.0.20:3000
--2023-08-15 13:36:14--  http://192.168.0.20:3000/
Connecting to 192.168.0.20:3000... connected.
HTTP request sent, awaiting response... 302 Found
Location: /login [following]
--2023-08-15 13:36:14--  http://192.168.0.20:3000/login
Reusing existing connection to 192.168.0.20:3000.
HTTP request sent, awaiting response... 200 OK
Length: unspecified [text/html]
Saving to: ‘index.html’

index.html                         [ <=>                                              ]  29.23K  --.-KB/s    in 0.002s

2023-08-15 13:36:14 (14.1 MB/s) - ‘index.html’ saved [29932]

root@srv:/srv/grafana/files#
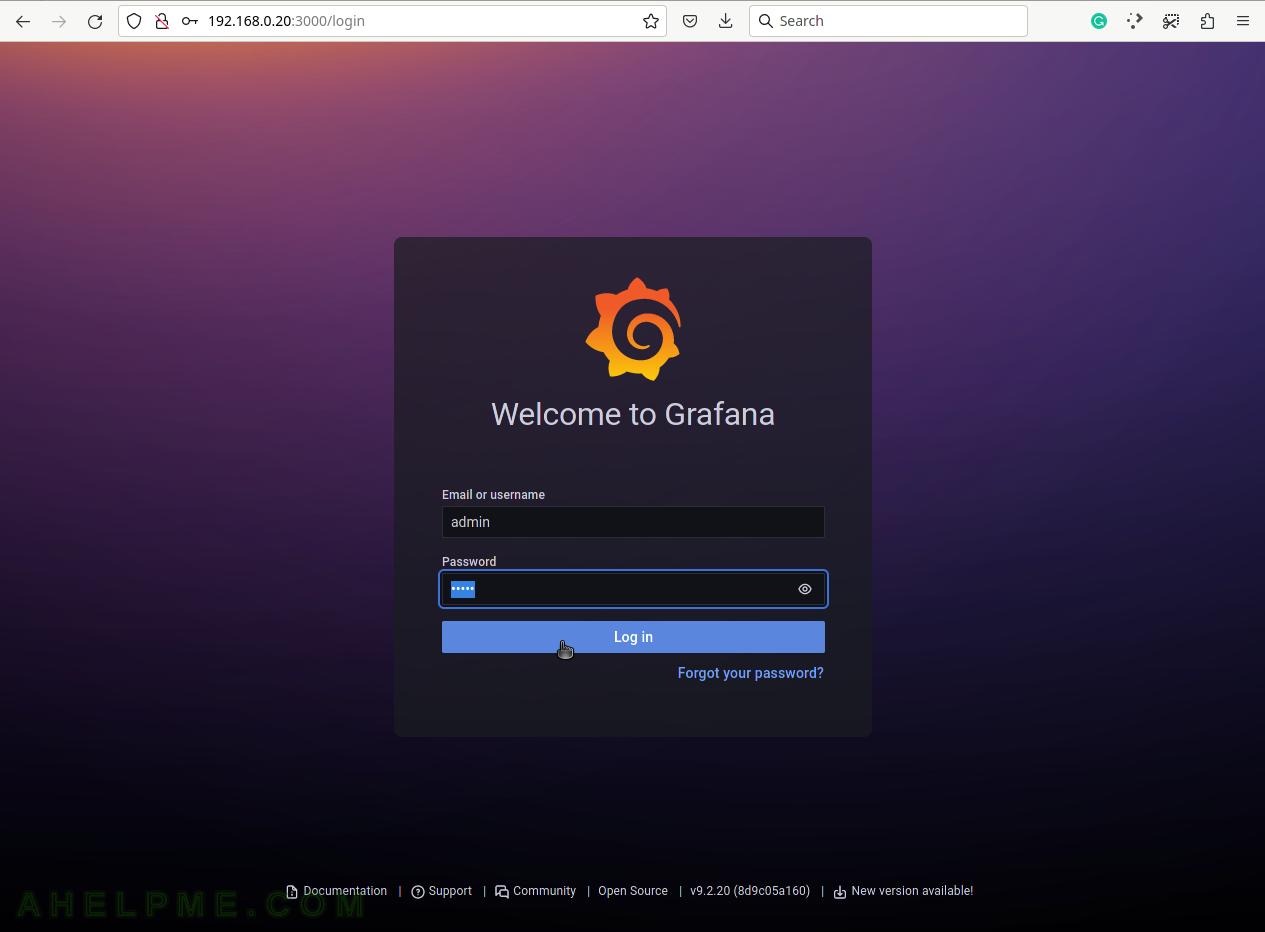
Grafana Web interface
SCREENSHOT 2) The Grafana web interface on the default port 3000.
The default credential is username – admin and password – admin.
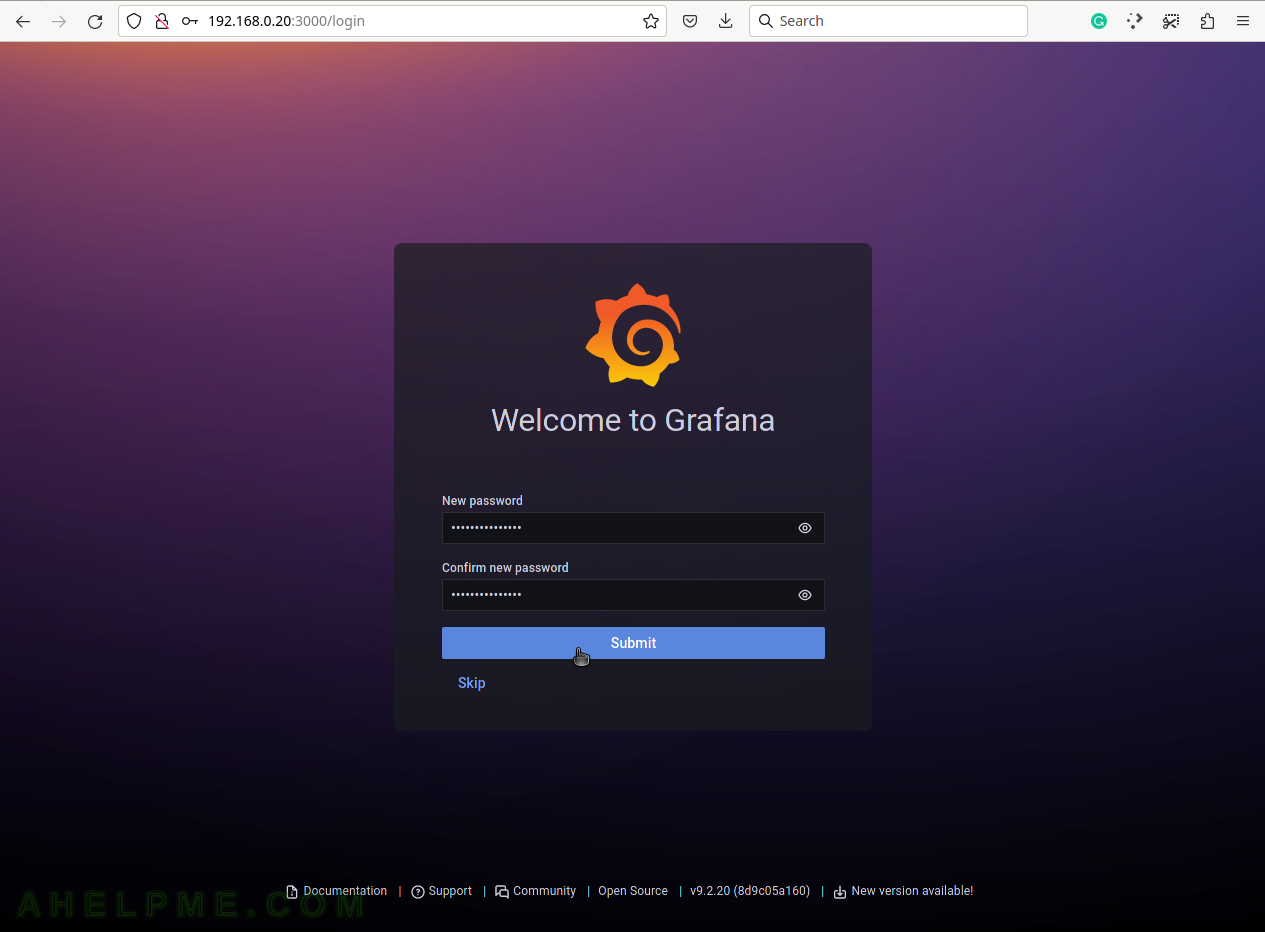
SCREENSHOT 3) Replace the default admin/admin password after the first login.
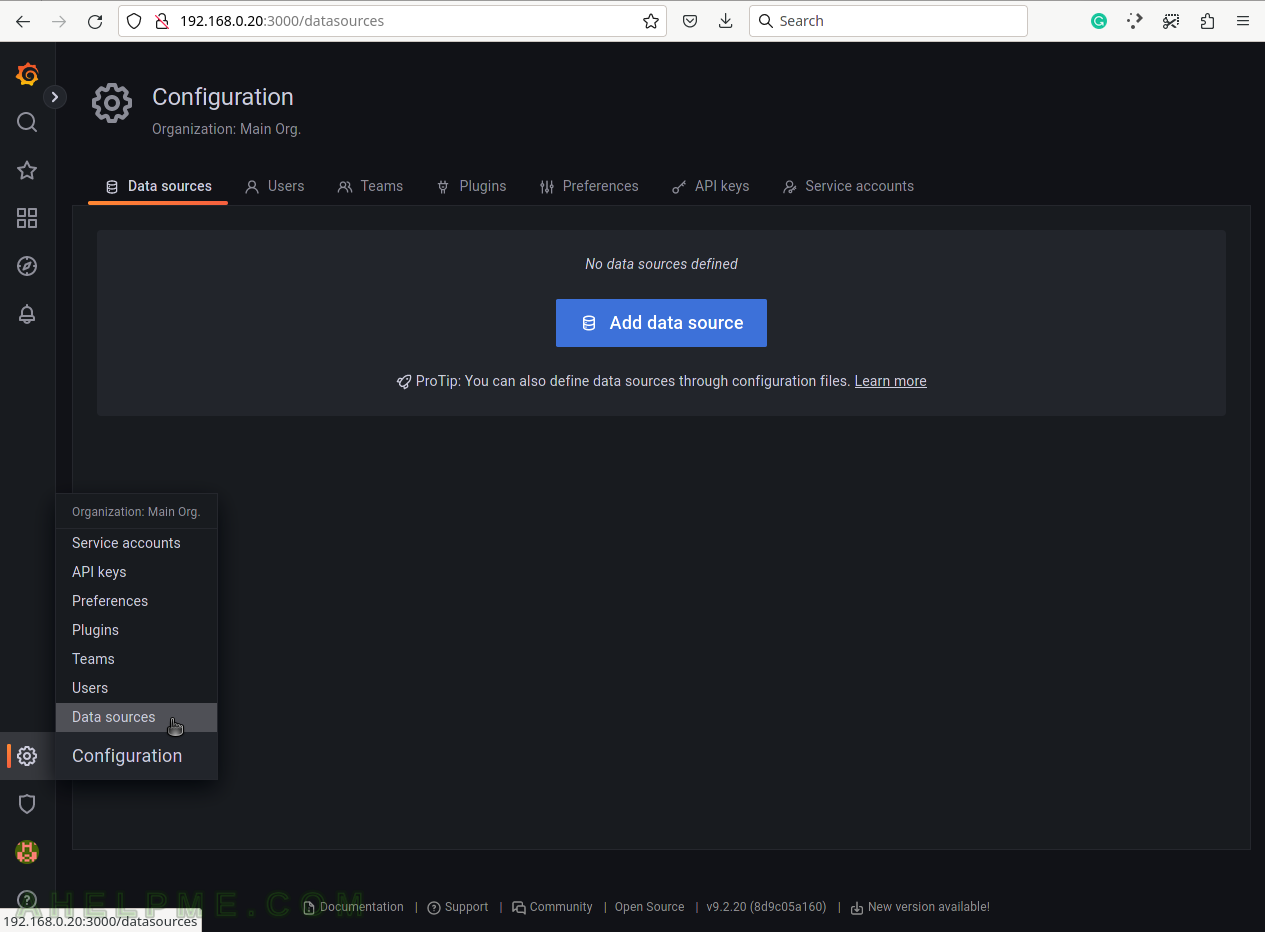
SCREENSHOT 4) Add a Data source.
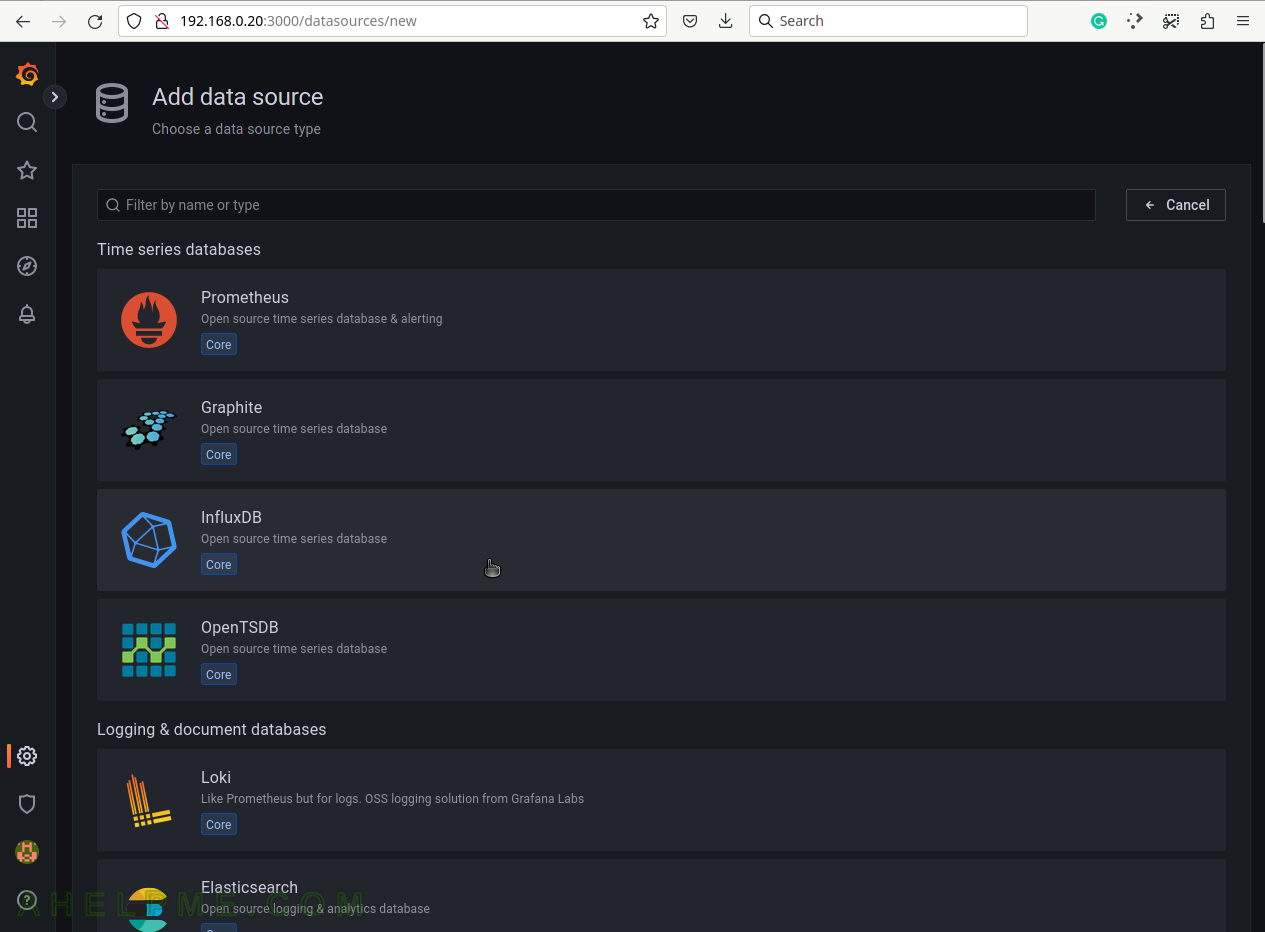
SCREENSHOT 5) Add the data source with the time series database – InfluxDB.
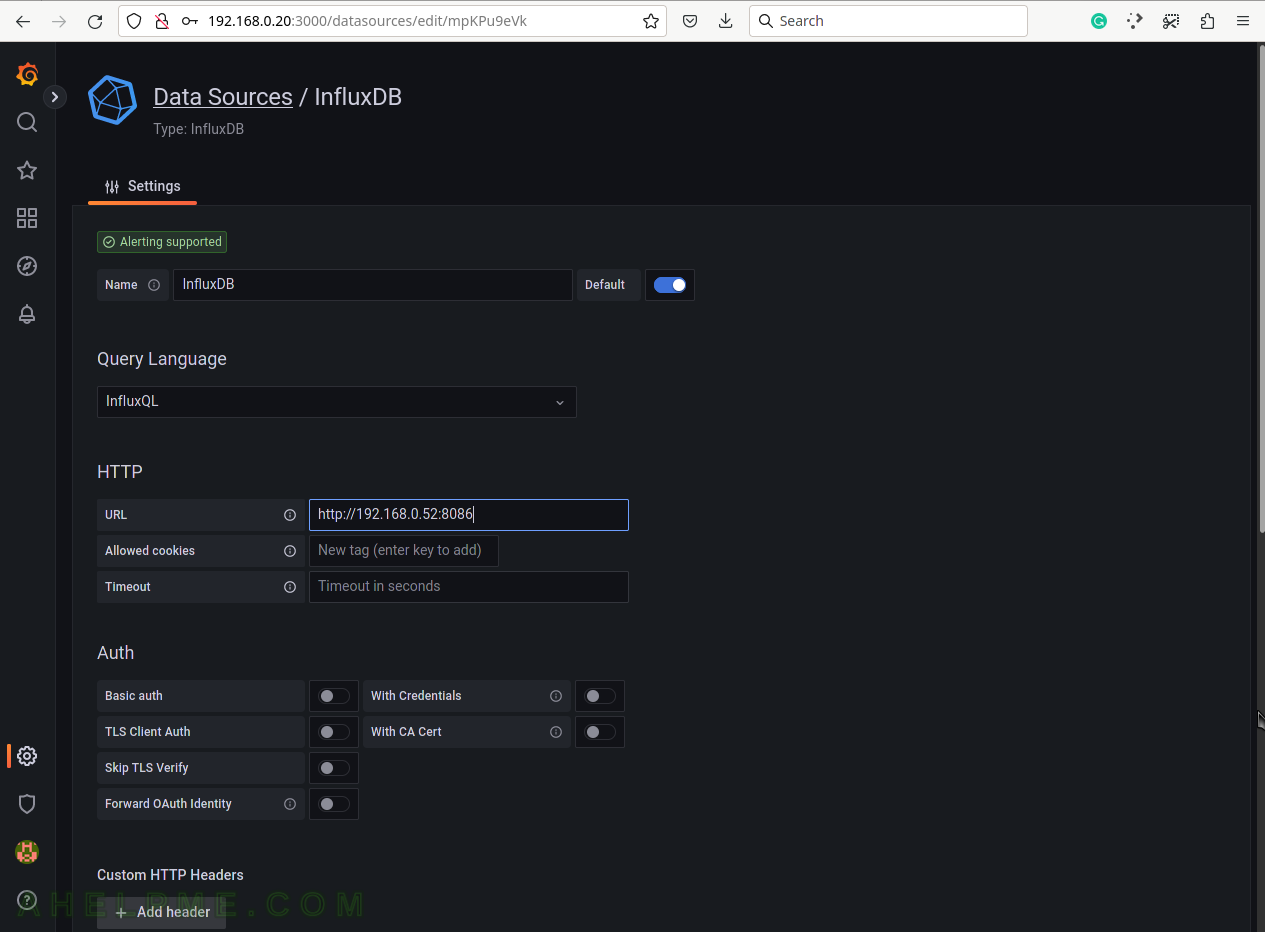
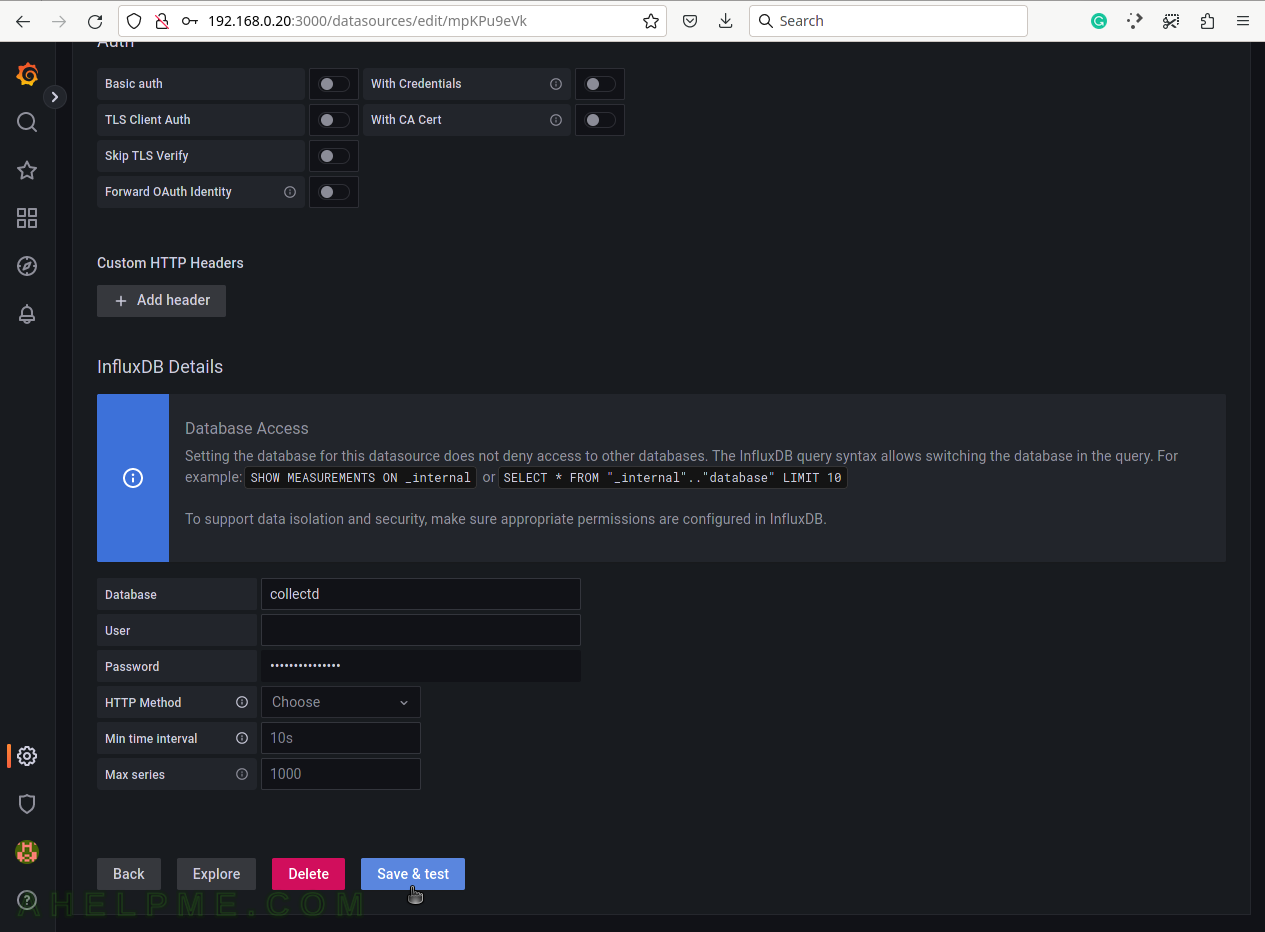
SCREENSHOT 6) Change the URL address to correspond to the location of the database.
Include HTTP/HTTPS and the port, which is 8086 for InfluxDB, by default.
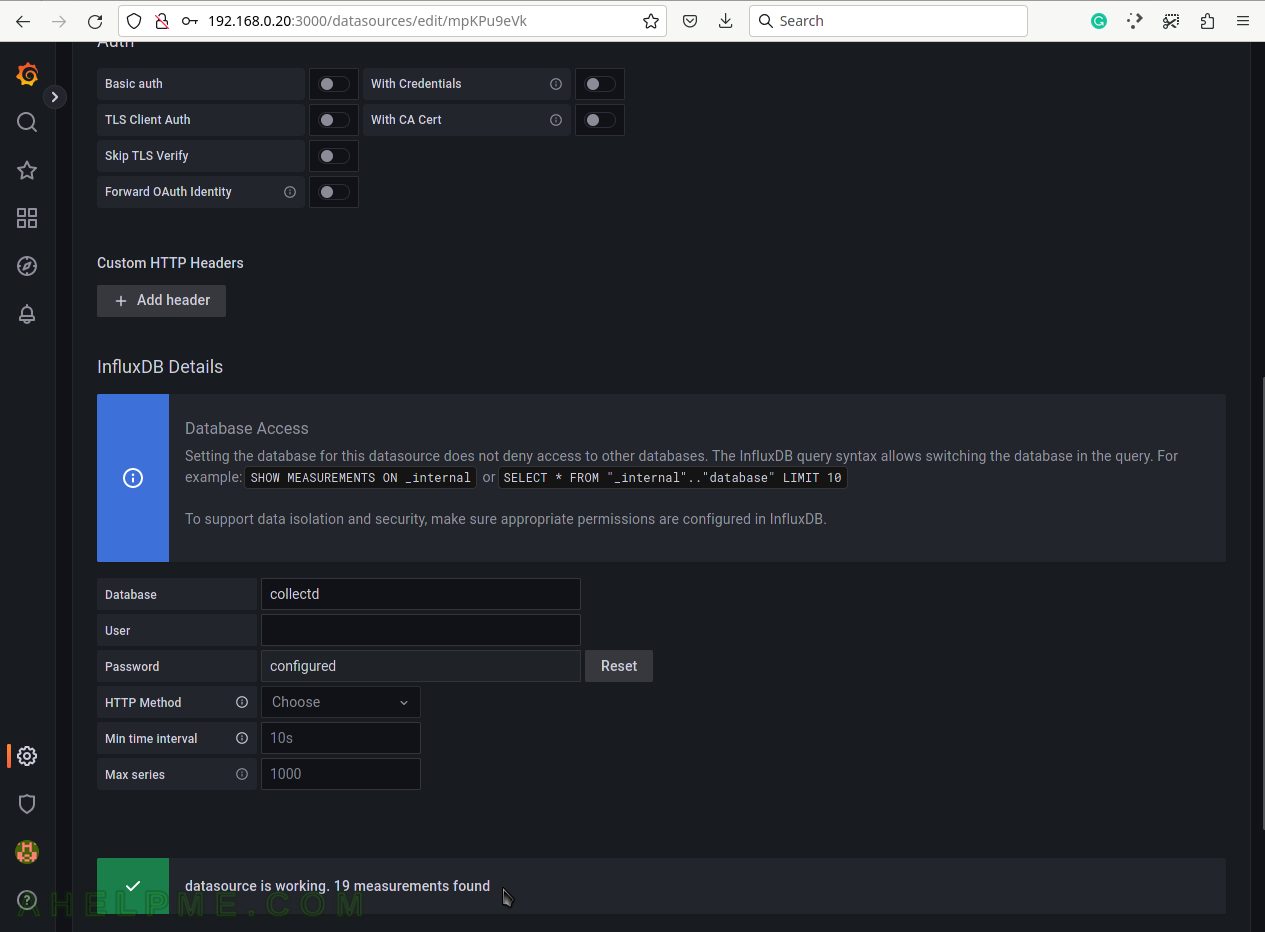
SCREENSHOT 7) Save and test the connection to the InfluxDB database.
SCREENSHOT 8) A green message on successful connection to the database InfluxDB.
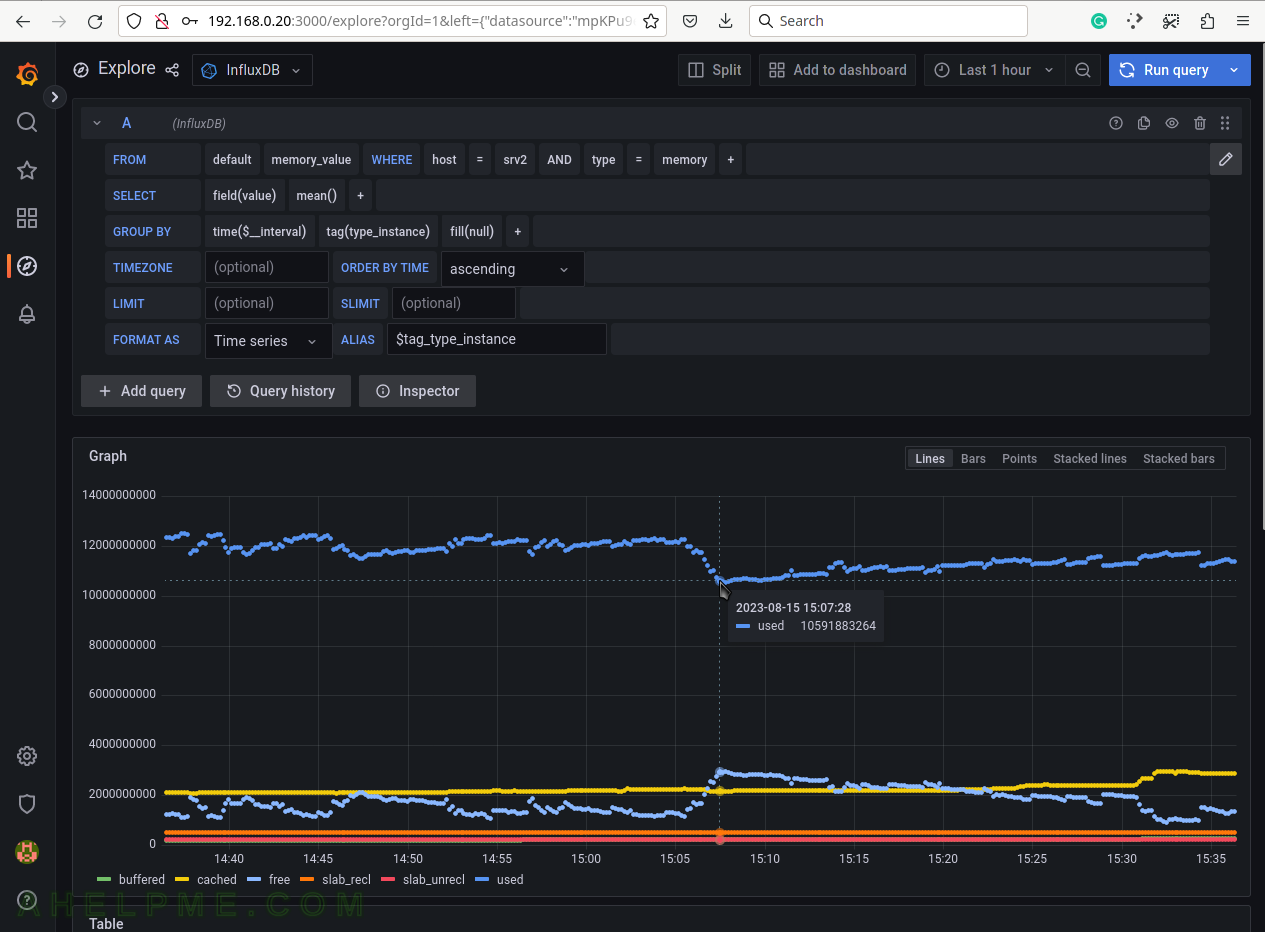
SCREENSHOT 9) Explore the measurements in the Explore menu.