Ever wonder what is the impact of write-through of an LSI controller in a real-world streaming server? Have no wonder anymore!
you can get several (multiple?) times slower with the write-through mode than if your controller were using the write-back mode of the cache
And it could happen any moment because when charging the battery of the LSI controller and you have set “No Write Cache if Bad BBU” the write-through would kick in. Of course, you can make a schedule for the battery charging/discharging process, but in general, it will happen and it will hurt your IO performance a lot!
In simple words a write operation is successful only if the controller confirms the write operation on all disks, no matter the data has already been in the cache.
This mode puts pressure on the disks and Write-Through is a known destroyer of hard disks! You can read a lot of administrator’s feedback on the Internet about crashed disks using write-through mode (and sometimes several simultaneously on one machine losing all your data even it would have redundancy with some of the RAID setups like RAID1, RAID5, RAID6, RAID10 and so).
srv ~ # sudo megacli -ldinfo -lall -aall

Adapter 0 -- Virtual Drive Information:
Virtual Drive: 0 (Target Id: 0)
Name                :system
RAID Level          : Primary-1, Secondary-0, RAID Level Qualifier-0
Size                : 13.781 TB
Sector Size         : 512
Mirror Data         : 13.781 TB
State               : Optimal
Strip Size          : 128 KB
Number Of Drives per span:2
Span Depth          : 6
Default Cache Policy: WriteBack, ReadAdaptive, Direct, No Write Cache if Bad BBU
Current Cache Policy: WriteThrough, ReadAdaptive, Direct, No Write Cache if Bad BBU
Default Access Policy: Read/Write
Current Access Policy: Read/Write
Disk Cache Policy   : Disk's Default
Encryption Type     : None
Bad Blocks Exist: No
Is VD Cached: Yes
Cache Cade Type : Read Only

Exit Code: 0x00
As you can see our default cache policy is WriteBack and “No Write Cache if Bad BBU”, the BBU is not bad, but charging!
So if your server with LSI just became completely overkilled by IO for no apparent reason check the cache policy of your controller and if it is write-through force it to write-backup:
srv ~ # sudo megacli -LDSetProp CachedBadBBU -LALL -aALL
srv ~ # sudo megacli -LDSetProp CachedBadBBU -LALL -aALL

Set Write Cache OK if bad BBU on Adapter 0, VD 0 (target id: 0) success
Set Write Cache OK if bad BBU on Adapter 0, VD 1 (target id: 1) success

Exit Code: 0x00
srv ~ # sudo megacli -ldinfo -lall -aall

Adapter 0 -- Virtual Drive Information:
Virtual Drive: 0 (Target Id: 0)
Name                :system
RAID Level          : Primary-1, Secondary-0, RAID Level Qualifier-0
Size                : 13.781 TB
Sector Size         : 512
Mirror Data         : 13.781 TB
State               : Optimal
Strip Size          : 128 KB
Number Of Drives per span:2
Span Depth          : 6
Default Cache Policy: WriteBack, ReadAdaptive, Direct, Write Cache OK if Bad BBU
Current Cache Policy: WriteBack, ReadAdaptive, Direct, Write Cache OK if Bad BBU
Default Access Policy: Read/Write
Current Access Policy: Read/Write
Disk Cache Policy   : Disk's Default
Encryption Type     : None
Bad Blocks Exist: No
Is VD Cached: Yes
Cache Cade Type : Read Only

Exit Code: 0x00
This property instructs the LSI controller to use write-back even the battery is in a bad state or missing (so when it is in charging mode it won’t change to write through).
Example of IO performance degradation
These are graphs of a streaming server, which is almost idle before the LSI controller switch to write-through because of charging battery unit.
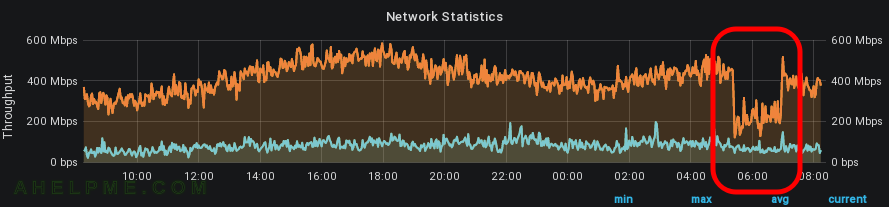
SCREENSHOT 1) The trasmitted traffic decreased from around 500Mbps to below 200Mps, which was more than 100% decrease.
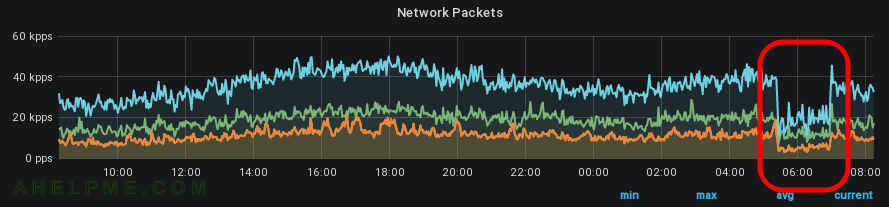
SCREENSHOT 2) Of course, there is a drop in the network packets transmitted and received.
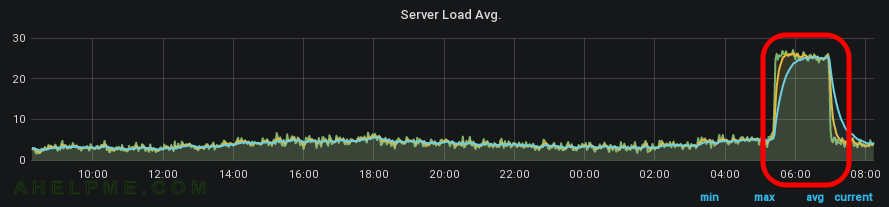
SCREENSHOT 3) The load avarage skyrocketed from 3 to 28, which is probably the maximum, because the nginx had 28 worker processes.
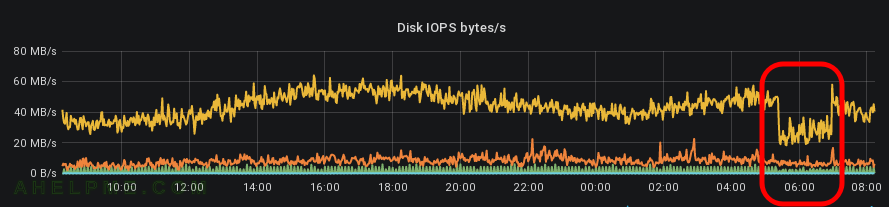
SCREENSHOT 4) Reading with almost 60Mbytes/s and dropping to 20Mbytes/s – almost 3 times decrease.
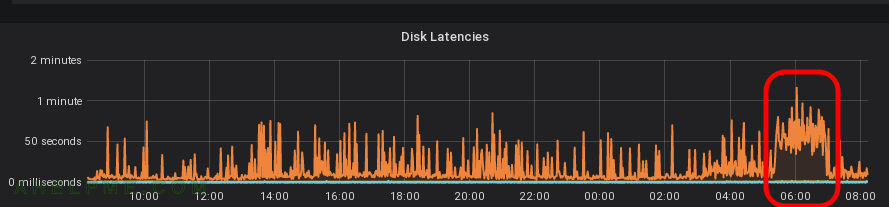
SCREENSHOT 5) Constant 50 seconds (total of all operations, that’s why this shocking number) disk latency from almost zero change!
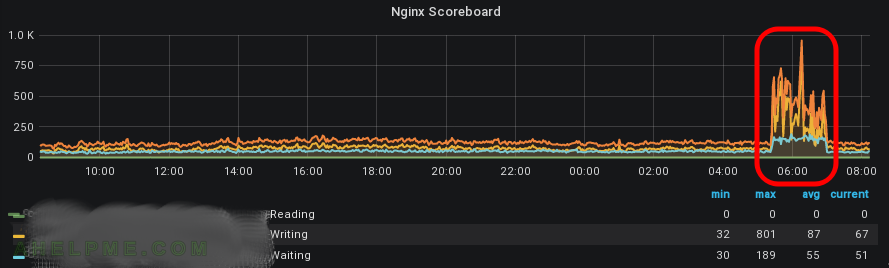
SCREENSHOT 6) As you can see nginx was stuggling. In such situations probably your clients feel the problem. Reading, writing and waiting are up!