A strange behavior has been monitored in a storage server holding more than 20 millions of files, which is not a really big figure, because we have storage with more than 300 millions of files. The server has a RAID5 of 4 x 10T HGST Ultrastar He10 and storage partition formatted with ext4 filesystem with total of 27T size. Despite the inodes are only 7% and the free space is at 80%, the server began to experience high load averages with almost no IO utilization across the disks and the RAID device.
So the numbers are:
- 20% free space.
- 93% free inodes.
- no IO disk utilization above 10-20% of any of the disks. In fact, the IO above 10% is very rear.
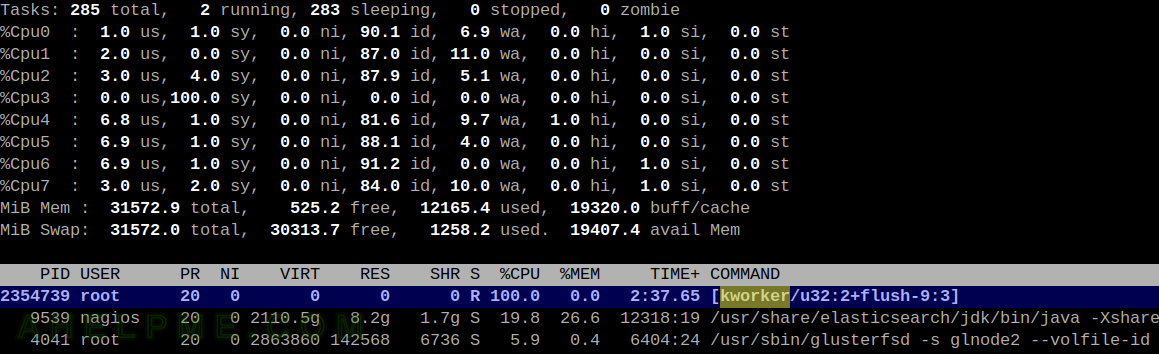
- really high loads above the number of the server’s cores. The server has 8 virtual processors under Linux and the loads are constantly above 10-14.
- no Disk Sleep blocked processes or Running to justify the high load.
- the top command reports one or two kernel processes with 100% running – kworker/u32:1+flush-9:3 (so flushing the data takes so many time?)
If the problem were related to the disks or hardware, it would probably have been seen a high utilization across the disks, because the physical operations would need more time to execute. The high IO utilization across any disk, in deed, may result in a high system time (i.e. kernel time). Apparently, there is no high IO utilization across the disks and even no Disk Sleep blocked processes.
The FlameGraph tool may help to suggest the area where the problem related to.
First, install the git and perf tool (there are two interesting links about it with examples – link1 and link2):
dnf install -y perf git perl-open
git clone https://github.com/brendangregg/FlameGraph
Save a sample 60 second data with:
[root@srv ~]# perf record -F 99 -a -g -- sleep 60
[ perf record: Woken up 24 times to write data ]
[ perf record: Captured and wrote 7.132 MB perf.data (35687 samples) ]
And generate a SVG image of all the function, which are executed during this time frame of 60 seconds. It will give a good picture of what has been executed and how much time it took in the kernel and user space.
[root@srv ~]# cd FlameGraph
[root@srv FlameGraph]# ./stackcollapse-perf.pl ../out.perf > out.folded
[root@srv FlameGraph]# ./flamegraph.pl out.folded > kernel.svg
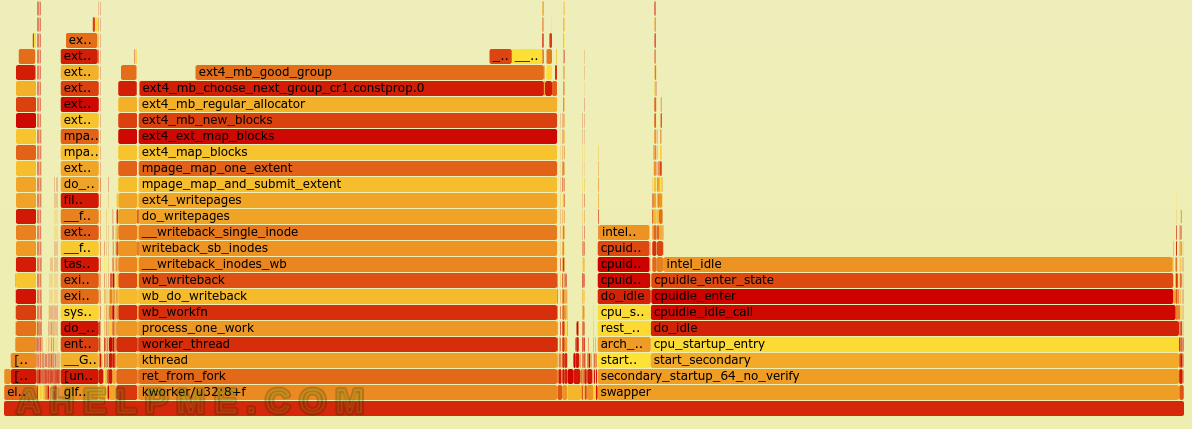
The SVG are shared bellow. It turned out most of the time during this sample period of 60 seconds, the Linux kernel was in ext4_mb_good_group, which is related to the EXT4 file system.
What fixed the problem (for now) – By removing files it was noticed the system time went down and the load went down, too. Then, after removing approximately a million files, the server performance returned to normal as the average other storage server (this one has unique hardware setup). So by removing files, i.e. INODES from the ext4 file system, the load average and the server ext4 performance were completely different from what it had been before.
The interesting part the inodes never went above 7% (around 24 million of 454 million available) and the free space never went down 20%, but when a good deal of files were removed, the bad ext4 performance disappeared. It still could be related to the physical disks or some strange ext4 bug, but this article is intended to report this behavior and to propose a some kind of a solution (even though a workaround).
SCREENSHOT 1) The kernel process running at 100% – kworker/u32:2-flush-9:3.
SCREENSHOT 2) Almost half of the time was spent at ext4 related calls.
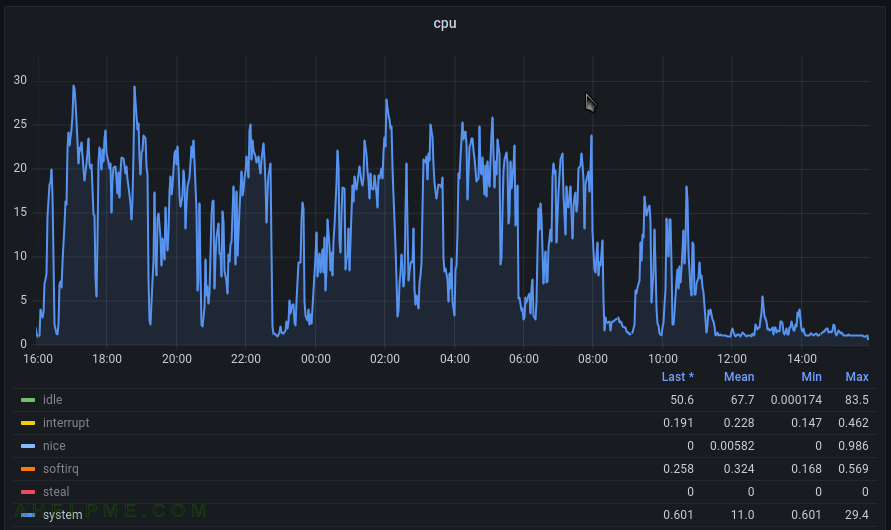
SCREENSHOT 3) The system time spent for the last 24 hours.
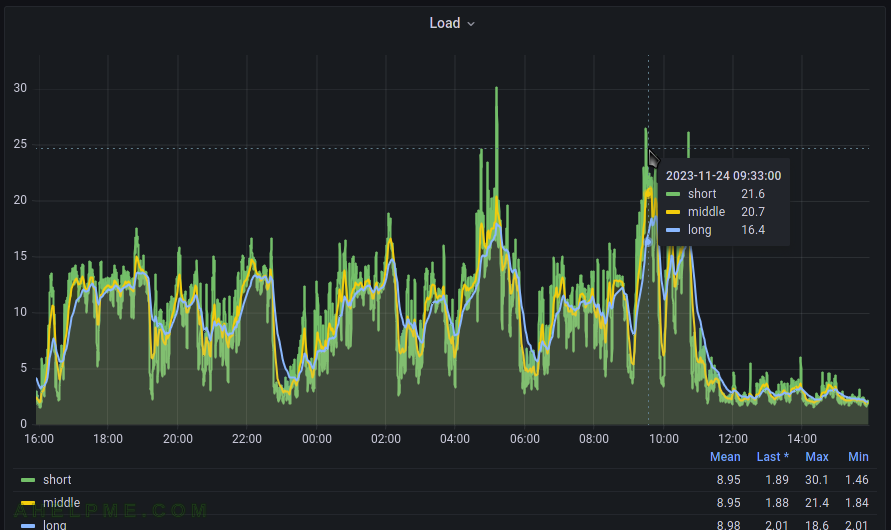
SCREENSHOT 4) The load average graph for the last 24 hours.
SCREENSHOT 5) In fact, after removing a million files, the load average and kernel time tanked and the disk utilization returned to normal higher levels, because the storage began to serve its purpose.
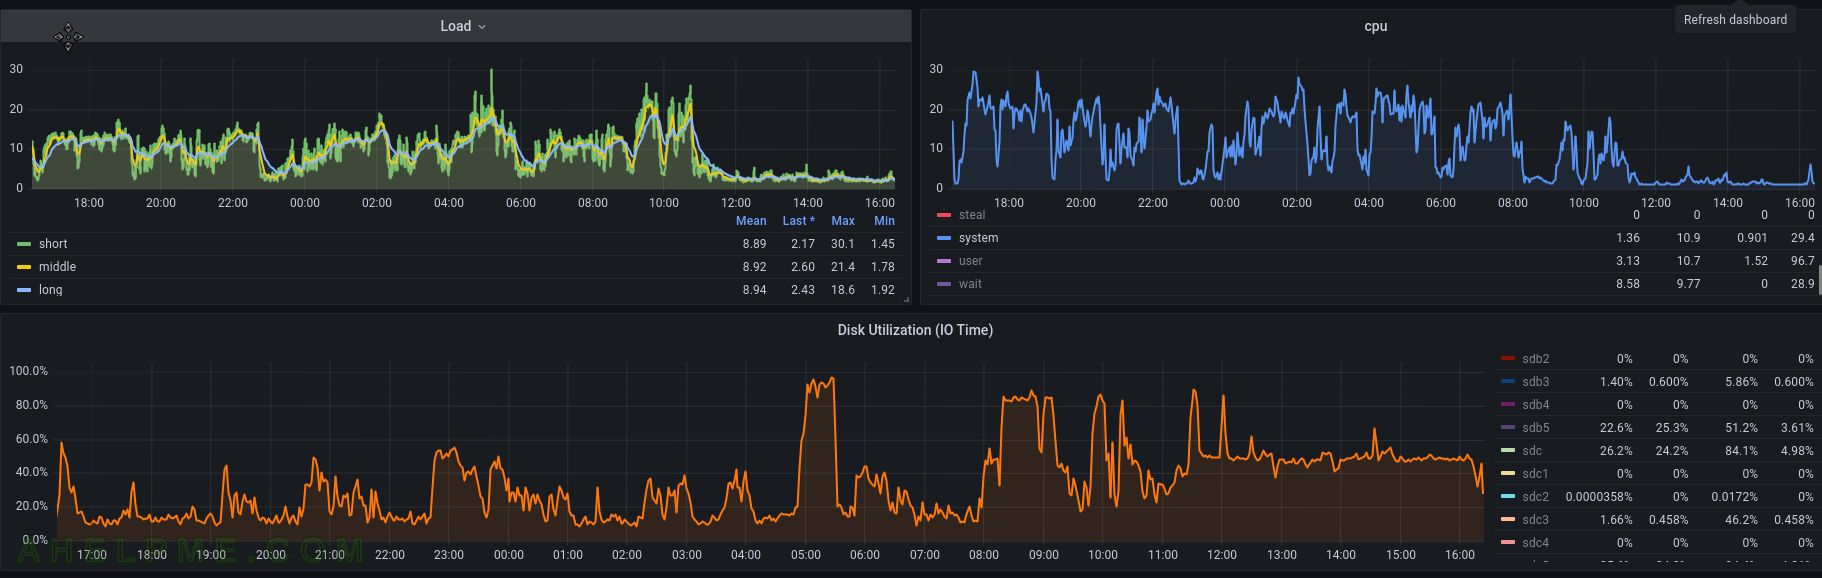
SCREENSHOT 6) This graph is related to the above one with the load average, kernel time and IO utilization.
Apparently, almost not IO till the 8 o’clock, but load average above 10. After 8 o’clock the file removal process began and after that the load average is below 2.
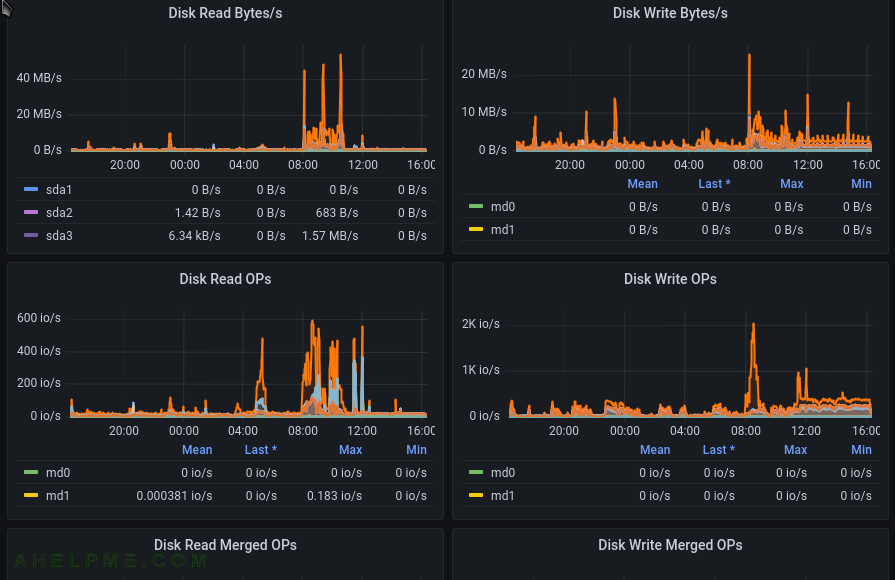
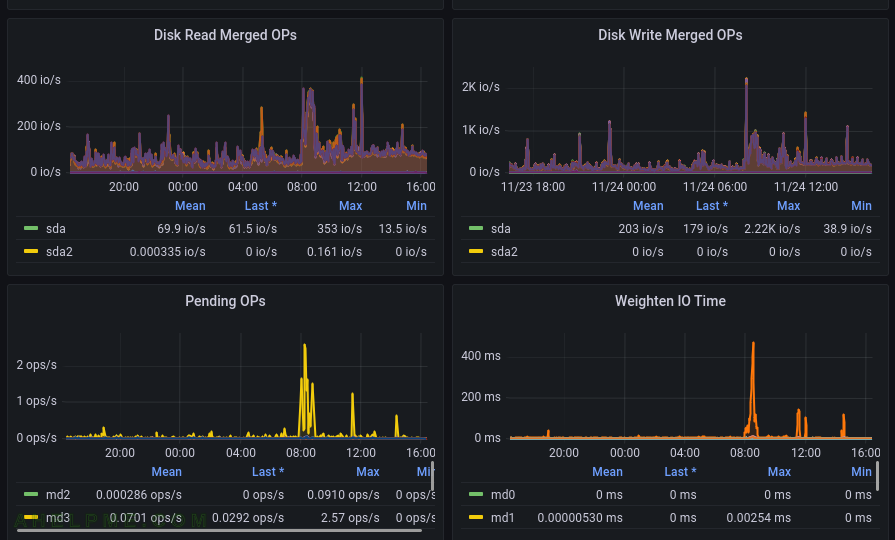
SCREENSHOT 7) One more graph for the IO showing the IO and the hardware was not the issue.
The SVG generated by the FlameGraph tool.
All the names could be selected and expanded in the SVG image.
No NFS server started.

NFS Server is serving and despite there is no NFS activity, the ext4_mb_good_group took all the time for ganesha.nfsd process.

More on Linux – https://ahelpme.com/tag/linux/.
I seem to be affected by something similar and happened to come across this post of yours.
You did not state which kernel version you are using, but I guess it is one of the newer ones, since your issue arises only now. Did you look into this bug report?
https://bugzilla.kernel.org/show_bug.cgi?id=217965
Its a lot of text to read, but there is a similar issue described.
Essentially, its a long running loop during allocation of blocks when flushing to disk.
The issue can be mitigated for now by changing the stripe value configured for ext4 partitions.
I’d recommend reading the whole discussion on the bug report, checking the mount options applied to your partition and perhaps changing the stripe to mitigate the issue.
Hopefully, a bugfix will be underway soon.
Thank you, it seems similar problem and I remounted with the stripe=0 and so far it looks good.