This article will show several handy MySQL commands for viewing the progress of MySQL 8 Cluster recovery and how the administrators may keep track of how much time will need a MySQL InnoDB Cluster node will need to complete the recovering procedure.
If the reader needs to recover from a node failure there is the other article – Recovery of MySQL 8 Cluster instance after server crash and corrupted data in log event. In this article, the MySQL commands are executed on a CentOS Stream 8 with MySQL InnoDB 8 Cluster (here is how it is installed – Install and deploy MySQL 8 InnoDB Cluster with 3 nodes under CentOS 8 and MySQL Router for HA), which one node had been offline for about several weeks. The node was powered off normally, so the MySQL instance on the server was shut down gracefully.
Initially, the cluster state after the power down was two nodes with a missing one.
Use MySQL Shell Console to view the MySQL InnoDB 8 Cluster status:
[root@db-cluster-1 ~]# mysqlsh
MySQL Shell 8.0.28

Copyright (c) 2016, 2022, Oracle and/or its affiliates.
Oracle is a registered trademark of Oracle Corporation and/or its affiliates.
Other names may be trademarks of their respective owners.

Type '\help' or '\?' for help; '\quit' to exit.
 MySQL  JS > \connect clusteradmin@db-cluster-1
Creating a session to 'clusteradmin@db-cluster-1'
Fetching schema names for autocompletion... Press ^C to stop.
Your MySQL connection id is 158633505 (X protocol)
Server version: 8.0.28 MySQL Community Server - GPL
No default schema selected; type \use <schema> to set one.
 MySQL  db-cluster-1:33060+ ssl  JS > var cluster = dba.getCluster()
 MySQL  db-cluster-1:33060+ ssl  JS > cluster.status()
{
    "clusterName": "mycluster1",
    "defaultReplicaSet": {
        "name": "default",
        "primary": "db-cluster-2:3306",
        "ssl": "REQUIRED",
        "status": "OK_NO_TOLERANCE",
        "statusText": "Cluster is NOT tolerant to any failures. 1 member is not active.",
        "topology": {
            "db-cluster-1:3306": {
                "address": "db-cluster-1:3306",
                "memberRole": "SECONDARY",
                "mode": "R/O",
                "readReplicas": {},
                "replicationLag": null,
                "role": "HA",
                "status": "ONLINE",
                "version": "8.0.28"
            },
            "db-cluster-2:3306": {
                "address": "db-cluster-2:3306",
                "memberRole": "PRIMARY",
                "mode": "R/W",
                "readReplicas": {},
                "replicationLag": null,
                "role": "HA",
                "status": "ONLINE",
                "version": "8.0.28"
            },
            "db-cluster-3:3306": {
                "address": "db-cluster-3:3306",
                "memberRole": "SECONDARY",
                "mode": "n/a",
                "readReplicas": {},
                "role": "HA",
                "shellConnectError": "MySQL Error 2003: Could not open connection to 'db-cluster-3:3306': Can't connect to MySQL server on 'db-cluster-3:3306' (111)",
                "status": "(MISSING)"
            }
        },
        "topologyMode": "Single-Primary"
    },
    "groupInformationSourceMember": "db-cluster-2:3306"
}
 MySQL  db-cluster-1:33060+ ssl  JS >
When the third server in the cluster is started (from a clean shutdown), the third node will be in a recovery state. Here is the same status command and the third node in recovery. Still, with the MySQL Shell Console:
 MySQL  db-cluster-1:33060+ ssl  JS > cluster.status()
{
    "clusterName": "mycluster1",
    "defaultReplicaSet": {
        "name": "default",
        "primary": "db-cluster-2:3306",
        "ssl": "REQUIRED",
        "status": "OK",
        "statusText": "Cluster is ONLINE and can tolerate up to ONE failure. 1 member is not active.",
        "topology": {
            "db-cluster-1:3306": {
                "address": "db-cluster-1:3306",
                "memberRole": "SECONDARY",
                "mode": "R/O",
                "readReplicas": {},
                "replicationLag": null,
                "role": "HA",
                "status": "ONLINE",
                "version": "8.0.28"
            },
            "db-cluster-2:3306": {
                "address": "db-cluster-2:3306",
                "memberRole": "PRIMARY",
                "mode": "R/W",
                "readReplicas": {},
                "replicationLag": null,
                "role": "HA",
                "status": "ONLINE",
                "version": "8.0.28"
            },
            "db-cluster-3:3306": {
                "address": "db-cluster-3:3306",
                "memberRole": "SECONDARY",
                "mode": "R/O",
                "readReplicas": {},
                "recoveryStatusText": "Recovery in progress",
                "role": "HA",
                "status": "RECOVERING",
                "version": "8.0.28"
            }
        },
        "topologyMode": "Single-Primary"
    },
    "groupInformationSourceMember": "db-cluster-2:3306"
}
To view the process of recovery connect to the third MySQL node with the MySQL command-line client and execute the following commands.
SHOW SLAVE STATUS or the new one SHOW REPLICA STATUS
To show how many seconds the current slave (replica or replication server if the new naming is used) and many more details including all the old “SHOW SLAVE STATUS” variables – for example, whether the SQLs/commands are running on the server an addition parameter CHANNEL name should be used. In the recovery state, the channel name is group_replication_recovery and the user may ensure the right name by selecting from performance_schema.replication_connection_status, which output is included after SHOW REPLICA command.
[root@db-cluster-3 ~]# mysql
Welcome to the MySQL monitor.  Commands end with ; or \g.
Your MySQL connection id is 35
Server version: 8.0.28 MySQL Community Server - GPL

Copyright (c) 2000, 2022, Oracle and/or its affiliates.

Oracle is a registered trademark of Oracle Corporation and/or its
affiliates. Other names may be trademarks of their respective
owners.

Type 'help;' or '\h' for help. Type '\c' to clear the current input statement.

mysql> SHOW REPLICA STATUS for CHANNEL 'group_replication_recovery'\G
*************************** 1. row ***************************
             Replica_IO_State: Waiting for source to send event
                  Source_Host: db-cluster-1
                  Source_User: mysql_innodb_cluster_2324239842
                  Source_Port: 3306
                Connect_Retry: 60
              Source_Log_File: binlog.000097
          Read_Source_Log_Pos: 613666843
               Relay_Log_File: db-cluster-3-relay-bin-group_replication_recovery.000017
                Relay_Log_Pos: 233016593
        Relay_Source_Log_File: binlog.000095
           Replica_IO_Running: Yes
          Replica_SQL_Running: Yes
              Replicate_Do_DB:
          Replicate_Ignore_DB:
           Replicate_Do_Table:
       Replicate_Ignore_Table:
      Replicate_Wild_Do_Table:
  Replicate_Wild_Ignore_Table:
                   Last_Errno: 0
                   Last_Error:
                 Skip_Counter: 0
          Exec_Source_Log_Pos: 233016423
              Relay_Log_Space: 2763554252
              Until_Condition: SQL_VIEW_ID
               Until_Log_File:
                Until_Log_Pos: 0
           Source_SSL_Allowed: Yes
           Source_SSL_CA_File:
           Source_SSL_CA_Path:
              Source_SSL_Cert:
            Source_SSL_Cipher:
               Source_SSL_Key:
        Seconds_Behind_Source: 679849
Source_SSL_Verify_Server_Cert: No
                Last_IO_Errno: 0
                Last_IO_Error:
               Last_SQL_Errno: 0
               Last_SQL_Error:
  Replicate_Ignore_Server_Ids:
             Source_Server_Id: 1934970143
                  Source_UUID: 8bf2c25f-90ae-11ec-93d1-00163e20a401
             Source_Info_File: mysql.slave_master_info
                    SQL_Delay: 0
          SQL_Remaining_Delay: NULL
    Replica_SQL_Running_State: Waiting for dependent transaction to commit
           Source_Retry_Count: 1
                  Source_Bind:
      Last_IO_Error_Timestamp:
     Last_SQL_Error_Timestamp:
               Source_SSL_Crl:
           Source_SSL_Crlpath:
           Retrieved_Gtid_Set: 51843d46-90af-11ec-8086-00163e20a401:24225668-25511790,
5184400f-90af-11ec-8086-00163e20a401:63
            Executed_Gtid_Set: 51843d46-90af-11ec-8086-00163e20a401:1-25097585,
5184400f-90af-11ec-8086-00163e20a401:1-62
                Auto_Position: 1
         Replicate_Rewrite_DB:
                 Channel_Name: group_replication_recovery
           Source_TLS_Version: TLSv1.2,TLSv1.3
       Source_public_key_path:
        Get_Source_public_key: 0
            Network_Namespace:
1 row in set (0.00 sec)
Most informative and important variables for the recovery progress are Seconds_Behind_Source: 679849, Replica_IO_Running: Yes and Replica_SQL_Running: Yes. Executing several times the command will show how the current server is advancing in the recovery procedure by decreasing the counter in Seconds_Behind_Source. In fact, the Seconds_Behind_Source may increase in some periods, but in general, for a longer period of time, it should decrease and eventually become 0 and the recovery process will finish.
Note, the SHOW SLAVE STATUS is deprecated and probably it will be removed in future releases. Detailed information is available in https://dev.mysql.com/doc/refman/8.0/en/show-replica-status.html
Check out performance_schema for cluster node detailed information and replication channel names
There are several tables in the performance_schema, which are of interests in such recovery operation –
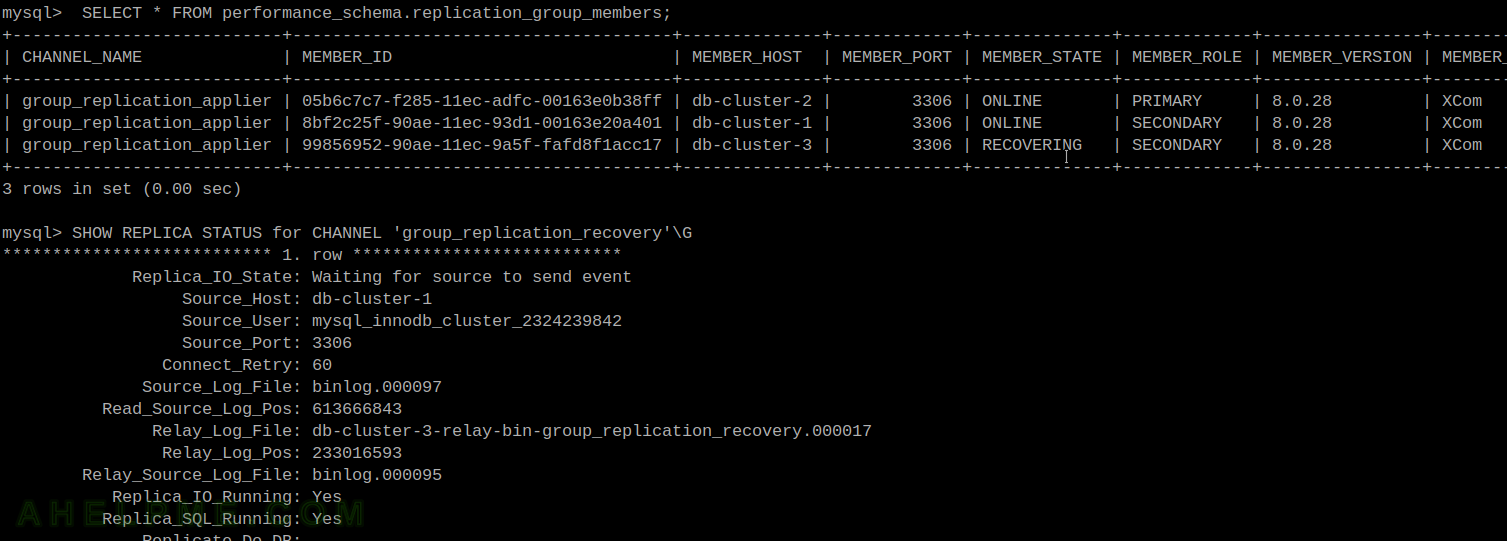
mysql>  SELECT * FROM performance_schema.replication_group_members;
+---------------------------+--------------------------------------+--------------+-------------+--------------+-------------+----------------+----------------------------+
| CHANNEL_NAME              | MEMBER_ID                            | MEMBER_HOST  | MEMBER_PORT | MEMBER_STATE | MEMBER_ROLE | MEMBER_VERSION | MEMBER_COMMUNICATION_STACK |
+---------------------------+--------------------------------------+--------------+-------------+--------------+-------------+----------------+----------------------------+
| group_replication_applier | 05b6c7c7-f285-11ec-adfc-00163e0b38ff | db-cluster-2 |        3306 | ONLINE       | PRIMARY     | 8.0.28         | XCom                       |
| group_replication_applier | 8bf2c25f-90ae-11ec-93d1-00163e20a401 | db-cluster-1 |        3306 | ONLINE       | SECONDARY   | 8.0.28         | XCom                       |
| group_replication_applier | 99856952-90ae-11ec-9a5f-fafd8f1acc17 | db-cluster-3 |        3306 | RECOVERING   | SECONDARY   | 8.0.28         | XCom                       |
+---------------------------+--------------------------------------+--------------+-------------+--------------+-------------+----------------+----------------------------+
3 rows in set (0.00 sec)
There are three members and one is in recovery state.
The system administrator may confirm the server receives data by showing the performance_schema.replication_group_member_stats and verifying the COUNT_TRANSACTIONS_IN_QUEUE counter is increasing or decreasing.
mysql>  SELECT * FROM performance_schema.replication_group_member_stats\G
*************************** 1. row ***************************
                              CHANNEL_NAME: group_replication_applier
                                   VIEW_ID: 16655016576298330:31
                                 MEMBER_ID: 05b6c7c7-f285-11ec-adfc-00163e0b38ff
               COUNT_TRANSACTIONS_IN_QUEUE: 0
                COUNT_TRANSACTIONS_CHECKED: 11965393
                  COUNT_CONFLICTS_DETECTED: 0
        COUNT_TRANSACTIONS_ROWS_VALIDATING: 4
        TRANSACTIONS_COMMITTED_ALL_MEMBERS: 51843d46-90af-11ec-8086-00163e20a401:1-25510996,
5184400f-90af-11ec-8086-00163e20a401:1-63
            LAST_CONFLICT_FREE_TRANSACTION: 51843d46-90af-11ec-8086-00163e20a401:25511029
COUNT_TRANSACTIONS_REMOTE_IN_APPLIER_QUEUE: 0
         COUNT_TRANSACTIONS_REMOTE_APPLIED: 7319615
         COUNT_TRANSACTIONS_LOCAL_PROPOSED: 4645789
         COUNT_TRANSACTIONS_LOCAL_ROLLBACK: 0
*************************** 2. row ***************************
                              CHANNEL_NAME: group_replication_applier
                                   VIEW_ID: 16655016576298330:31
                                 MEMBER_ID: 8bf2c25f-90ae-11ec-93d1-00163e20a401
               COUNT_TRANSACTIONS_IN_QUEUE: 0
                COUNT_TRANSACTIONS_CHECKED: 4645789
                  COUNT_CONFLICTS_DETECTED: 0
        COUNT_TRANSACTIONS_ROWS_VALIDATING: 4
        TRANSACTIONS_COMMITTED_ALL_MEMBERS: 51843d46-90af-11ec-8086-00163e20a401:1-25510996,
5184400f-90af-11ec-8086-00163e20a401:1-63
            LAST_CONFLICT_FREE_TRANSACTION: 51843d46-90af-11ec-8086-00163e20a401:25511034
COUNT_TRANSACTIONS_REMOTE_IN_APPLIER_QUEUE: 0
         COUNT_TRANSACTIONS_REMOTE_APPLIED: 4645793
         COUNT_TRANSACTIONS_LOCAL_PROPOSED: 0
         COUNT_TRANSACTIONS_LOCAL_ROLLBACK: 0
*************************** 3. row ***************************
                              CHANNEL_NAME: group_replication_applier
                                   VIEW_ID: 16655016576298330:31
                                 MEMBER_ID: 99856952-90ae-11ec-9a5f-fafd8f1acc17
               COUNT_TRANSACTIONS_IN_QUEUE: 2897
                COUNT_TRANSACTIONS_CHECKED: 0
                  COUNT_CONFLICTS_DETECTED: 0
        COUNT_TRANSACTIONS_ROWS_VALIDATING: 0
        TRANSACTIONS_COMMITTED_ALL_MEMBERS:
            LAST_CONFLICT_FREE_TRANSACTION:
COUNT_TRANSACTIONS_REMOTE_IN_APPLIER_QUEUE: 0
         COUNT_TRANSACTIONS_REMOTE_APPLIED: 0
         COUNT_TRANSACTIONS_LOCAL_PROPOSED: 0
         COUNT_TRANSACTIONS_LOCAL_ROLLBACK: 0
3 rows in set (0.00 sec)
Check out the performance_schema.replication_connection_status to show whether and when was the last executed queued transactions.
mysql>  SELECT * FROM performance_schema.replication_connection_status\G
*************************** 1. row ***************************
                                      CHANNEL_NAME: group_replication_applier
                                        GROUP_NAME: 51843d46-90af-11ec-8086-00163e20a401
                                       SOURCE_UUID: 51843d46-90af-11ec-8086-00163e20a401
                                         THREAD_ID: NULL
                                     SERVICE_STATE: ON
                         COUNT_RECEIVED_HEARTBEATS: 0
                          LAST_HEARTBEAT_TIMESTAMP: 0000-00-00 00:00:00.000000
                          RECEIVED_TRANSACTION_SET: 51843d46-90af-11ec-8086-00163e20a401:1-24901826,
5184400f-90af-11ec-8086-00163e20a401:1-62
                                 LAST_ERROR_NUMBER: 0
                                LAST_ERROR_MESSAGE:
                              LAST_ERROR_TIMESTAMP: 0000-00-00 00:00:00.000000
                           LAST_QUEUED_TRANSACTION:
 LAST_QUEUED_TRANSACTION_ORIGINAL_COMMIT_TIMESTAMP: 0000-00-00 00:00:00.000000
LAST_QUEUED_TRANSACTION_IMMEDIATE_COMMIT_TIMESTAMP: 0000-00-00 00:00:00.000000
     LAST_QUEUED_TRANSACTION_START_QUEUE_TIMESTAMP: 0000-00-00 00:00:00.000000
       LAST_QUEUED_TRANSACTION_END_QUEUE_TIMESTAMP: 0000-00-00 00:00:00.000000
                              QUEUEING_TRANSACTION:
    QUEUEING_TRANSACTION_ORIGINAL_COMMIT_TIMESTAMP: 0000-00-00 00:00:00.000000
   QUEUEING_TRANSACTION_IMMEDIATE_COMMIT_TIMESTAMP: 0000-00-00 00:00:00.000000
        QUEUEING_TRANSACTION_START_QUEUE_TIMESTAMP: 0000-00-00 00:00:00.000000
*************************** 2. row ***************************
                                      CHANNEL_NAME: group_replication_recovery
                                        GROUP_NAME:
                                       SOURCE_UUID: 8bf2c25f-90ae-11ec-93d1-00163e20a401
                                         THREAD_ID: 68
                                     SERVICE_STATE: ON
                         COUNT_RECEIVED_HEARTBEATS: 1
                          LAST_HEARTBEAT_TIMESTAMP: 2023-05-20 08:31:57.851262
                          RECEIVED_TRANSACTION_SET: 51843d46-90af-11ec-8086-00163e20a401:24225668-25511072,
5184400f-90af-11ec-8086-00163e20a401:63
                                 LAST_ERROR_NUMBER: 0
                                LAST_ERROR_MESSAGE:
                              LAST_ERROR_TIMESTAMP: 0000-00-00 00:00:00.000000
                           LAST_QUEUED_TRANSACTION: 51843d46-90af-11ec-8086-00163e20a401:25511072
 LAST_QUEUED_TRANSACTION_ORIGINAL_COMMIT_TIMESTAMP: 2023-05-20 09:47:52.314812
LAST_QUEUED_TRANSACTION_IMMEDIATE_COMMIT_TIMESTAMP: 2023-05-20 09:47:52.316289
     LAST_QUEUED_TRANSACTION_START_QUEUE_TIMESTAMP: 2023-05-20 09:47:52.338274
       LAST_QUEUED_TRANSACTION_END_QUEUE_TIMESTAMP: 2023-05-20 09:47:52.338287
                              QUEUEING_TRANSACTION:
    QUEUEING_TRANSACTION_ORIGINAL_COMMIT_TIMESTAMP: 0000-00-00 00:00:00.000000
   QUEUEING_TRANSACTION_IMMEDIATE_COMMIT_TIMESTAMP: 0000-00-00 00:00:00.000000
        QUEUEING_TRANSACTION_START_QUEUE_TIMESTAMP: 0000-00-00 00:00:00.000000
2 rows in set (0.00 sec)
The node cluster with ID – 8bf2c25f-90ae-11ec-93d1-00163e20a401 is the doner (the SOURCE_UUID), which is the db-cluster-1 (according to the performance_schema.replication_group_members)
A much detailed information on the subject in the manual – https://dev.mysql.com/doc/refman/8.0/en/group-replication-monitoring.html
Upon successful recovery the group_replication_recovery will stop working.
All the variables for the group_replication_recovery will be reset to zeroes. Only the group_replication_applier channel will continue to work on the cluster node.
mysql>  SELECT * FROM performance_schema.replication_connection_status\G
*************************** 1. row ***************************
                                      CHANNEL_NAME: group_replication_applier
                                        GROUP_NAME: 51843d46-90af-11ec-8086-00163e20a401
                                       SOURCE_UUID: 51843d46-90af-11ec-8086-00163e20a401
                                         THREAD_ID: NULL
                                     SERVICE_STATE: ON
                         COUNT_RECEIVED_HEARTBEATS: 0
                          LAST_HEARTBEAT_TIMESTAMP: 0000-00-00 00:00:00.000000
                          RECEIVED_TRANSACTION_SET: 51843d46-90af-11ec-8086-00163e20a401:1-25615550:26508145,
5184400f-90af-11ec-8086-00163e20a401:1-64
                                 LAST_ERROR_NUMBER: 0
                                LAST_ERROR_MESSAGE:
                              LAST_ERROR_TIMESTAMP: 0000-00-00 00:00:00.000000
                           LAST_QUEUED_TRANSACTION: 51843d46-90af-11ec-8086-00163e20a401:25615550
 LAST_QUEUED_TRANSACTION_ORIGINAL_COMMIT_TIMESTAMP: 2023-05-22 10:15:04.141152
LAST_QUEUED_TRANSACTION_IMMEDIATE_COMMIT_TIMESTAMP: 2023-05-22 10:15:04.141152
     LAST_QUEUED_TRANSACTION_START_QUEUE_TIMESTAMP: 2023-05-22 10:15:04.140958
       LAST_QUEUED_TRANSACTION_END_QUEUE_TIMESTAMP: 2023-05-22 10:15:04.140972
                              QUEUEING_TRANSACTION:
    QUEUEING_TRANSACTION_ORIGINAL_COMMIT_TIMESTAMP: 0000-00-00 00:00:00.000000
   QUEUEING_TRANSACTION_IMMEDIATE_COMMIT_TIMESTAMP: 0000-00-00 00:00:00.000000
        QUEUEING_TRANSACTION_START_QUEUE_TIMESTAMP: 0000-00-00 00:00:00.000000
*************************** 2. row ***************************
                                      CHANNEL_NAME: group_replication_recovery
                                        GROUP_NAME:
                                       SOURCE_UUID:
                                         THREAD_ID: NULL
                                     SERVICE_STATE: OFF
                         COUNT_RECEIVED_HEARTBEATS: 0
                          LAST_HEARTBEAT_TIMESTAMP: 0000-00-00 00:00:00.000000
                          RECEIVED_TRANSACTION_SET:
                                 LAST_ERROR_NUMBER: 0
                                LAST_ERROR_MESSAGE:
                              LAST_ERROR_TIMESTAMP: 0000-00-00 00:00:00.000000
                           LAST_QUEUED_TRANSACTION:
 LAST_QUEUED_TRANSACTION_ORIGINAL_COMMIT_TIMESTAMP: 0000-00-00 00:00:00.000000
LAST_QUEUED_TRANSACTION_IMMEDIATE_COMMIT_TIMESTAMP: 0000-00-00 00:00:00.000000
     LAST_QUEUED_TRANSACTION_START_QUEUE_TIMESTAMP: 0000-00-00 00:00:00.000000
       LAST_QUEUED_TRANSACTION_END_QUEUE_TIMESTAMP: 0000-00-00 00:00:00.000000
                              QUEUEING_TRANSACTION:
    QUEUEING_TRANSACTION_ORIGINAL_COMMIT_TIMESTAMP: 0000-00-00 00:00:00.000000
   QUEUEING_TRANSACTION_IMMEDIATE_COMMIT_TIMESTAMP: 0000-00-00 00:00:00.000000
        QUEUEING_TRANSACTION_START_QUEUE_TIMESTAMP: 0000-00-00 00:00:00.000000
2 rows in set (0.00 sec)

mysql> SHOW REPLICA STATUS for CHANNEL 'group_replication_recovery'\G
*************************** 1. row ***************************
             Replica_IO_State:
                  Source_Host: <NULL>
                  Source_User: mysql_innodb_cluster_2324239842
                  Source_Port: 0
                Connect_Retry: 60
              Source_Log_File:
          Read_Source_Log_Pos: 4
               Relay_Log_File: db-cluster-3-relay-bin-group_replication_recovery.000001
                Relay_Log_Pos: 4
        Relay_Source_Log_File:
           Replica_IO_Running: No
          Replica_SQL_Running: No
              Replicate_Do_DB:
          Replicate_Ignore_DB:
           Replicate_Do_Table:
       Replicate_Ignore_Table:
      Replicate_Wild_Do_Table:
  Replicate_Wild_Ignore_Table:
                   Last_Errno: 0
                   Last_Error:
                 Skip_Counter: 0
          Exec_Source_Log_Pos: 0
              Relay_Log_Space: 523
              Until_Condition: SQL_VIEW_ID
               Until_Log_File:
                Until_Log_Pos: 0
           Source_SSL_Allowed: Yes
           Source_SSL_CA_File:
           Source_SSL_CA_Path:
              Source_SSL_Cert:
            Source_SSL_Cipher:
               Source_SSL_Key:
        Seconds_Behind_Source: NULL
Source_SSL_Verify_Server_Cert: No
                Last_IO_Errno: 0
                Last_IO_Error:
               Last_SQL_Errno: 0
               Last_SQL_Error:
  Replicate_Ignore_Server_Ids:
             Source_Server_Id: 0
                  Source_UUID:
             Source_Info_File: mysql.slave_master_info
                    SQL_Delay: 0
          SQL_Remaining_Delay: NULL
    Replica_SQL_Running_State:
           Source_Retry_Count: 1
                  Source_Bind:
      Last_IO_Error_Timestamp:
     Last_SQL_Error_Timestamp:
               Source_SSL_Crl:
           Source_SSL_Crlpath:
           Retrieved_Gtid_Set:
            Executed_Gtid_Set: 51843d46-90af-11ec-8086-00163e20a401:1-25615552:26508145,
5184400f-90af-11ec-8086-00163e20a401:1-64
                Auto_Position: 1
         Replicate_Rewrite_DB:
                 Channel_Name: group_replication_recovery
           Source_TLS_Version: TLSv1.2,TLSv1.3
       Source_public_key_path:
        Get_Source_public_key: 0
            Network_Namespace:
1 row in set (0.00 sec)

mysql>