Here we show what to expect from the netdata graphics when using it in a web server. So we included here only the specific graphs for a web server:
- nginx – the web server
- php-fpm – the application, fastcgi php
- mysql – the database server
- memcached – memory cache
- redis – more sophisticated memory/disk cache
- mail – postfix mail server to send and receive mails
You can also visit our review of the generic graphs like system overview, cpu, memory and disks here: Review of netdata graphs – system overview, cpu, memory, disks and nfs
So here are the graphs netdata 1.10 offers to us:
CHART 1) Nginx Graphs
1) all active connections; 2) requests per second to nginx
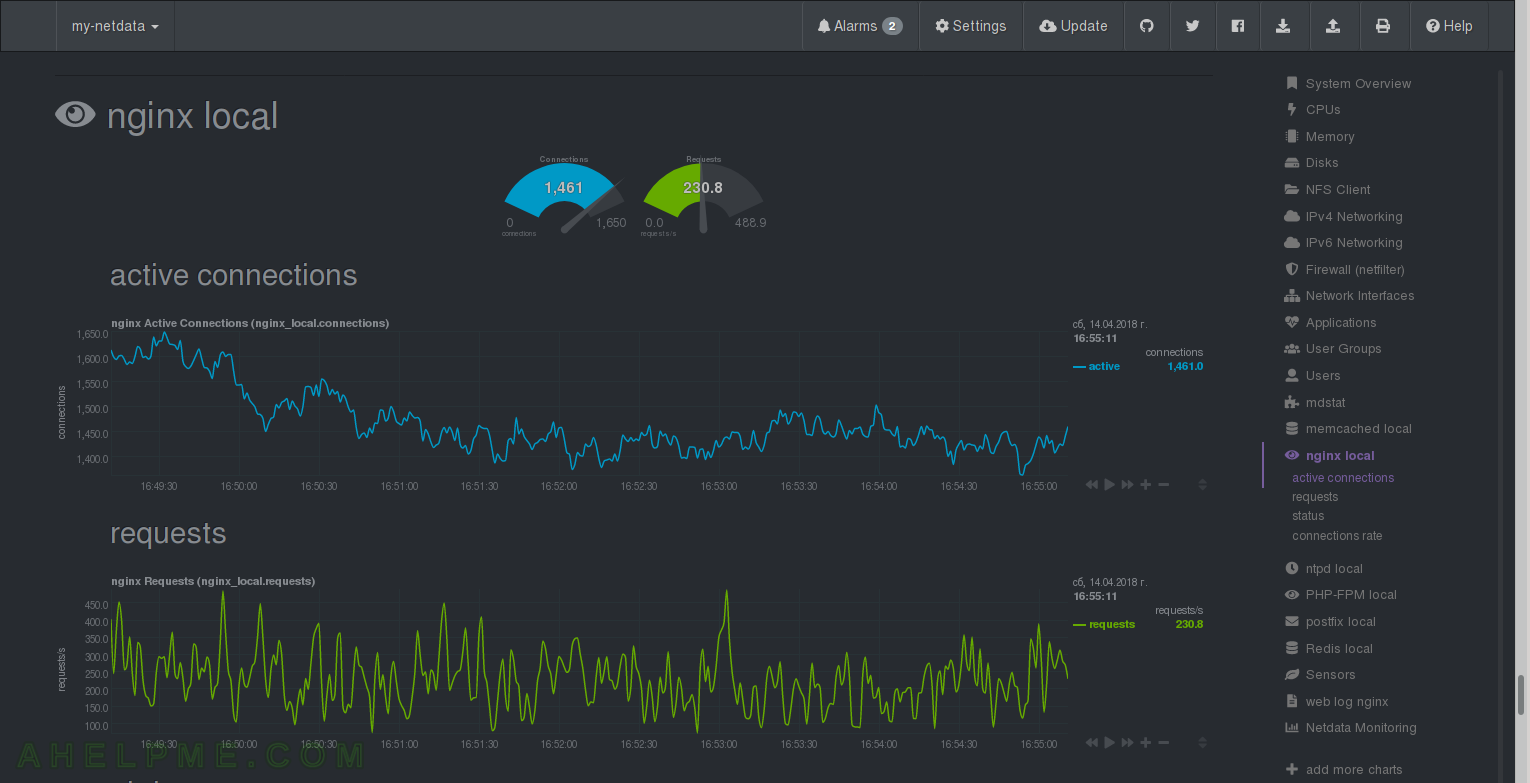
CHART 2) Nginx Graphs 2
1) nginx active connections by their status – reading (from client), writing (from client), idle (doing nothing, but opened to the client); 2) connections rate – accepted and handled
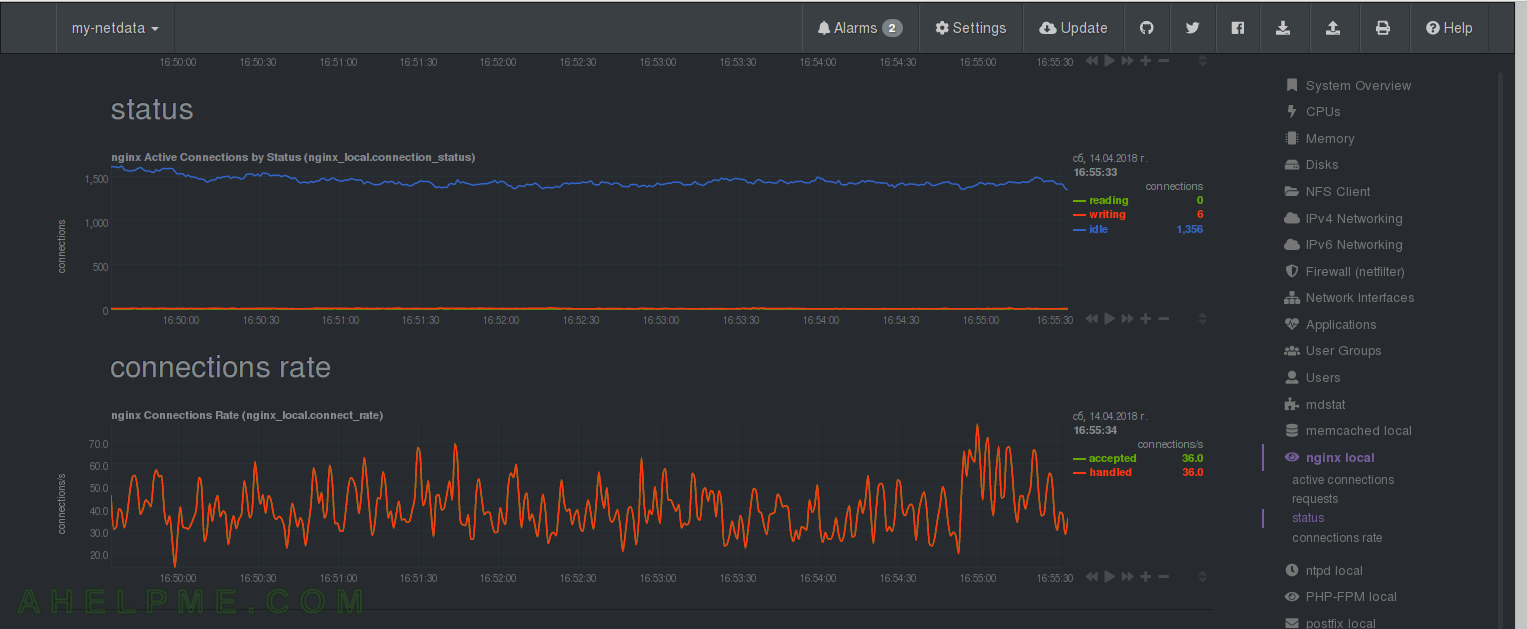
CHART 3) PHP-FPM – FastCGI PHP performance metrics
1) active connections – active (executing PHP code on the CPU right now – “php running”), max active, idle; 2) requests; 3) performance – max children reached or slow requests (it depends on your version of netdata).
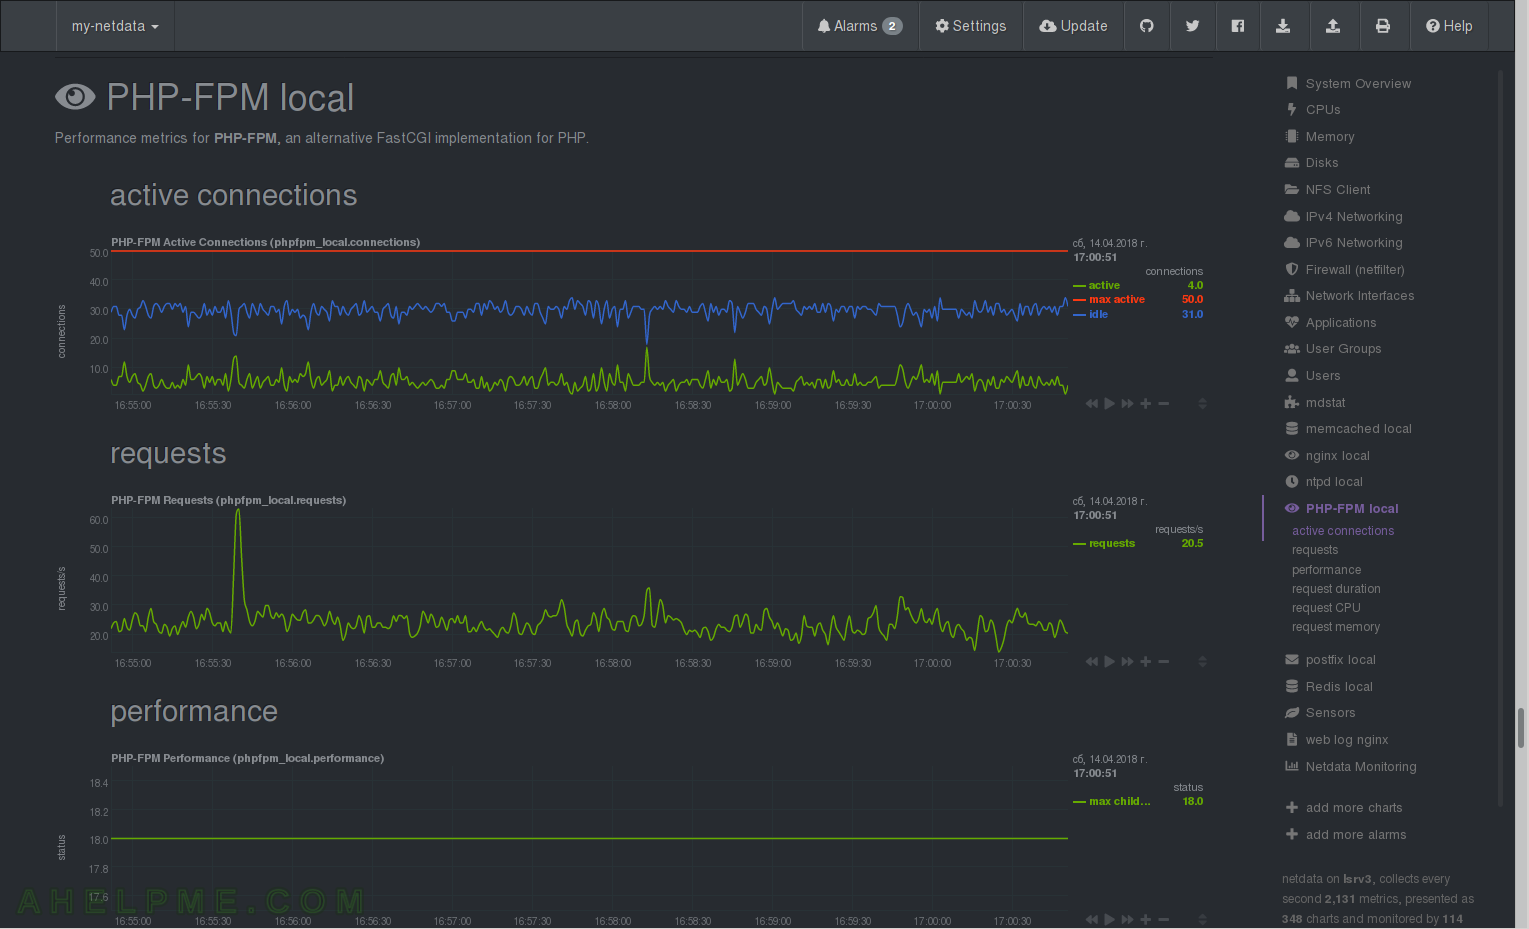
CHART 4) PHP-FPM – request information
1) reuqest duration – minimum, maximum, avarage – how much time do a request take time – very useful to see how fast is your backend application. 2) request CPU in procentages; 3) request memory – reuested memory by your php fpm processes.
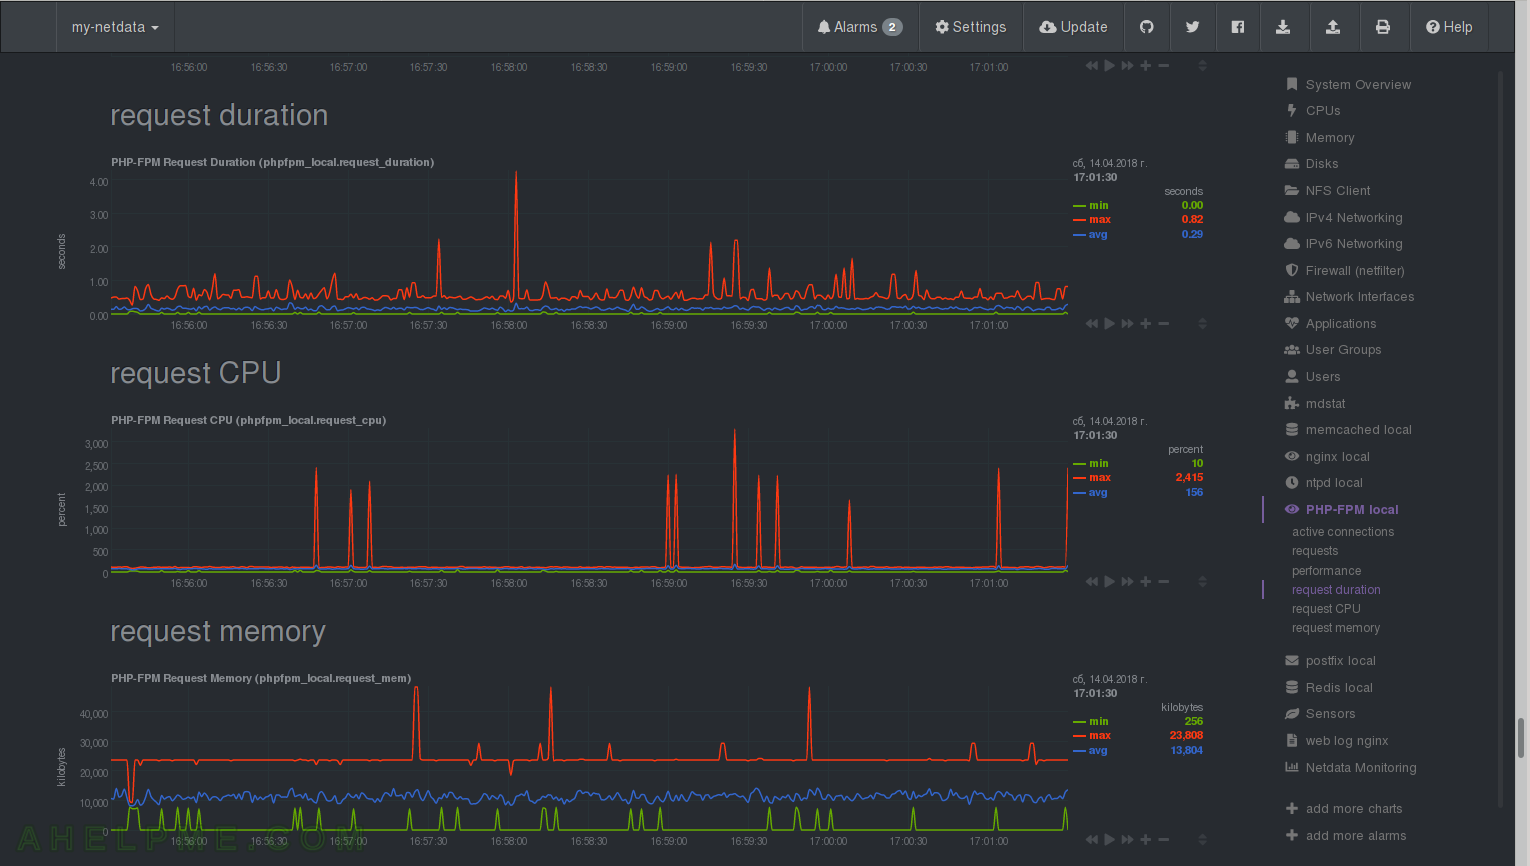
CHART 5) MySQL – performance metrics
1) bandwidth – The amount of data sent to mysql clients (out) and received from mysql clients (in); 2) queries – The number of statements executed by the server. To see a slow queries the slow query log should be enabled.
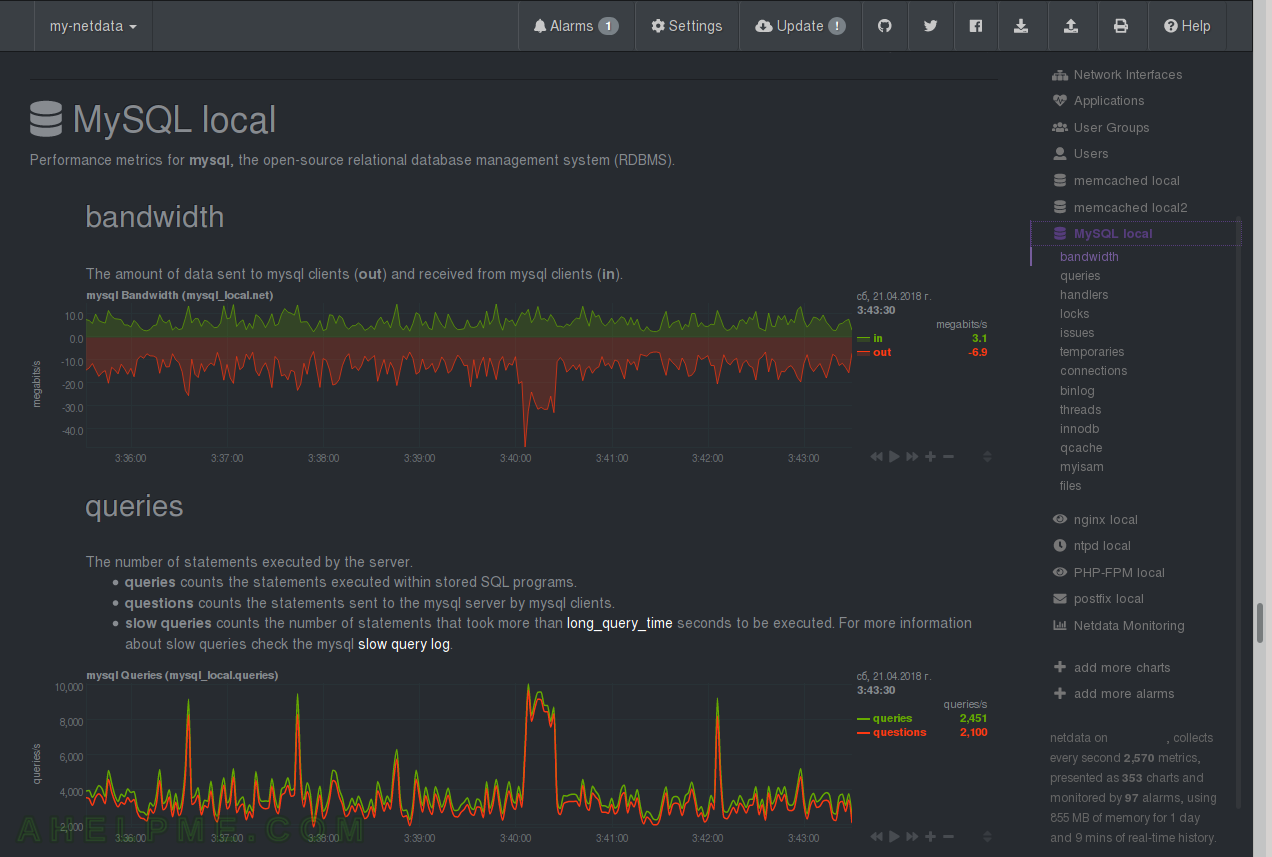
CHART 6) MySQL – handlers and locks
1) handlers – netdata Quotation: “Usage of the internal handlers of mysql. This chart provides very good insights of what the mysql server is actually doing. – commit, the number of internal COMMIT statements; delete, the number of times that rows have been deleted from tables; prepare, a counter for the prepare phase of two-phase commit operations; read first, the number of times the first entry in an index was read. A high value suggests that the server is doing a lot of full index scans; e.g. SELECT col1 FROM foo, with col1 indexed; read key, the number of requests to read a row based on a key. If this value is high, it is a good indication that your tables are properly indexed for your queries; read next, the number of requests to read the next row in key order. This value is incremented if you are querying an index column with a range constraint or if you are doing an index scan; read prev, the number of requests to read the previous row in key order. This read method is mainly used to optimize ORDER BY … DESC; read rnd, the number of requests to read a row based on a fixed position. A high value indicates you are doing a lot of queries that require sorting of the result. You probably have a lot of queries that require MySQL to scan entire tables or you have joins that do not use keys properly; read rnd next, the number of requests to read the next row in the data file. This value is high if you are doing a lot of table scans. Generally this suggests that your tables are not properly indexed or that your queries are not written to take advantage of the indexes you have; rollback, the number of requests for a storage engine to perform a rollback operation; savepoint, the number of requests for a storage engine to place a savepoint; savepoint rollback, the number of requests for a storage engine to roll back to a savepoint; update, the number of requests to update a row in a table; write, the number of requests to insert a row in a table.” 2) MySQL table locks counters, netdata Quotation: ” immediate, the number of times that a request for a table lock could be granted immediately – waited, the number of times that a request for a table lock could not be granted immediately and a wait was needed. If this is high and you have performance problems, you should first optimize your queries, and then either split your table or tables or use replication.”
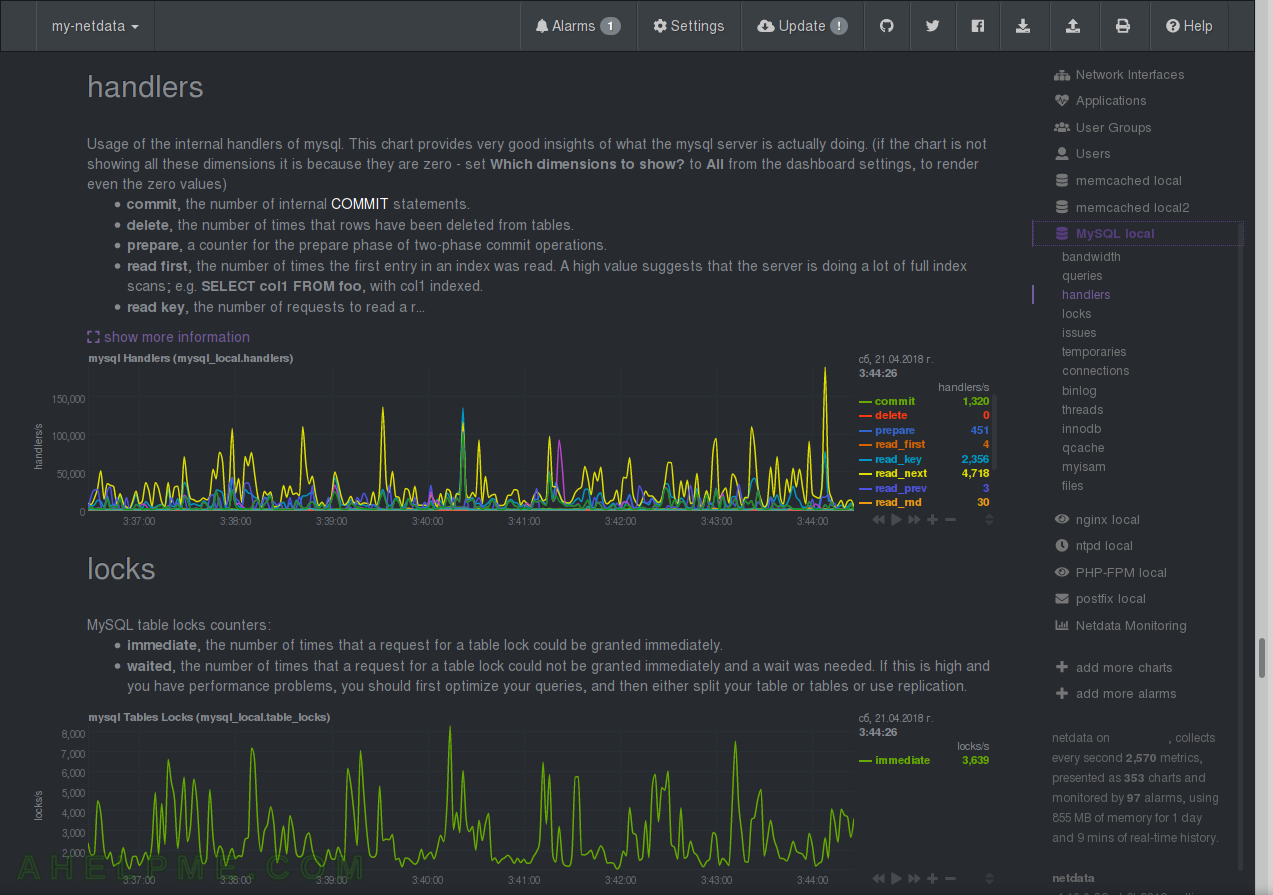
CHART 7) MySQL – sorts, selects and temporaries
1) mysql SELECT JOIN – full range, range, scan; 2) mysql sorts – range and scan; 3) temporaries – disk tables (writing to the disk is slow and should be avoided!!!) and tables.
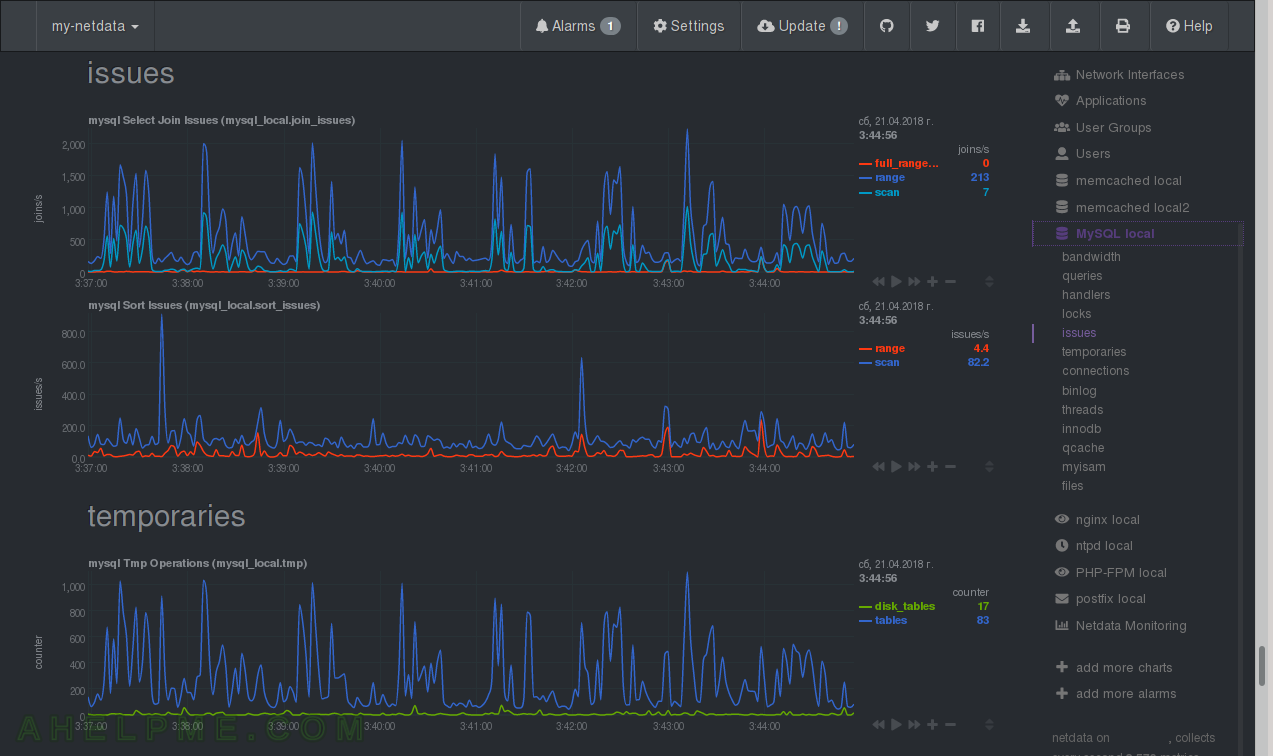
CHART 8) MySQL – connections and binlog
1) connections in seconds – all and aborted – if you are using persistent connections to MySQL you can see a busy MySQL server could have 2-3 new connections in a minute, because all the application backend uses the pool of already opened connections to the server. 2) connection errors – accepted, internal, max, peer_addr, select, tcpwrap; 3) binlog transactions per second
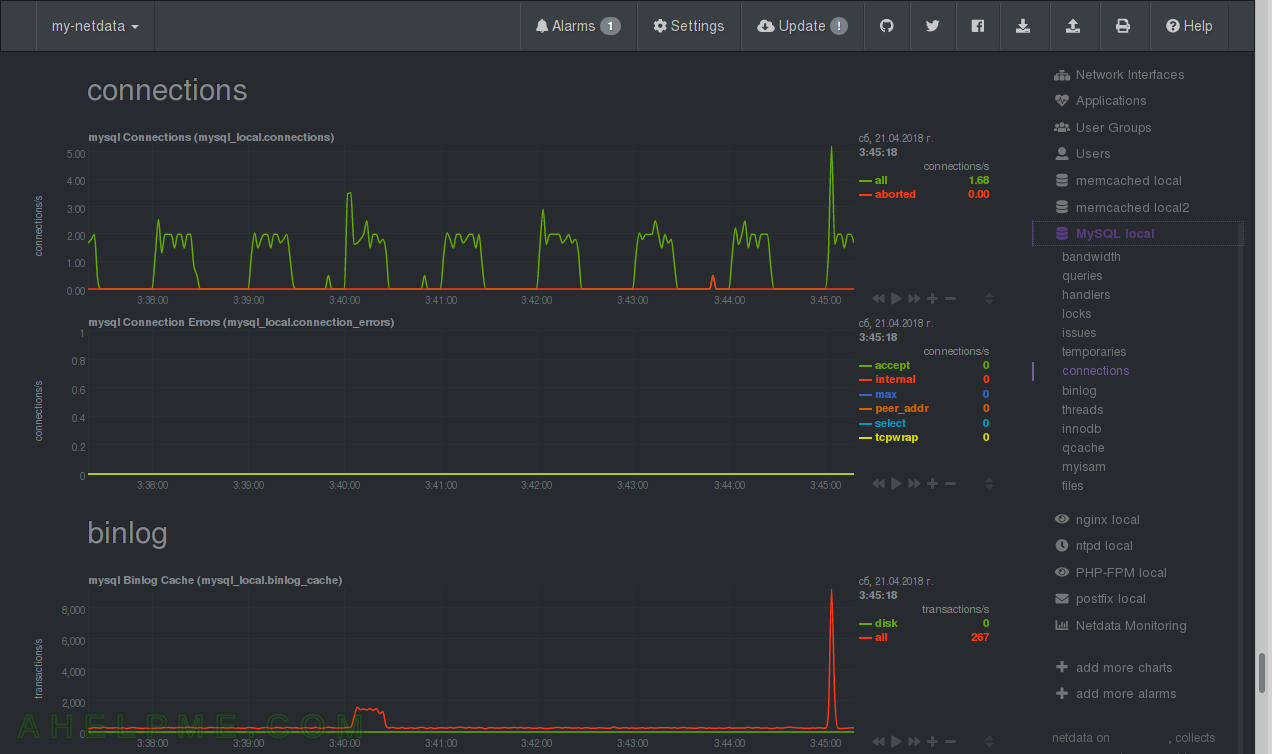
CHART 9) MySQL – binlog and threads
1) binlog statement cache; 2) MySQL threads – connected, cached, running; 3) threads cache misses
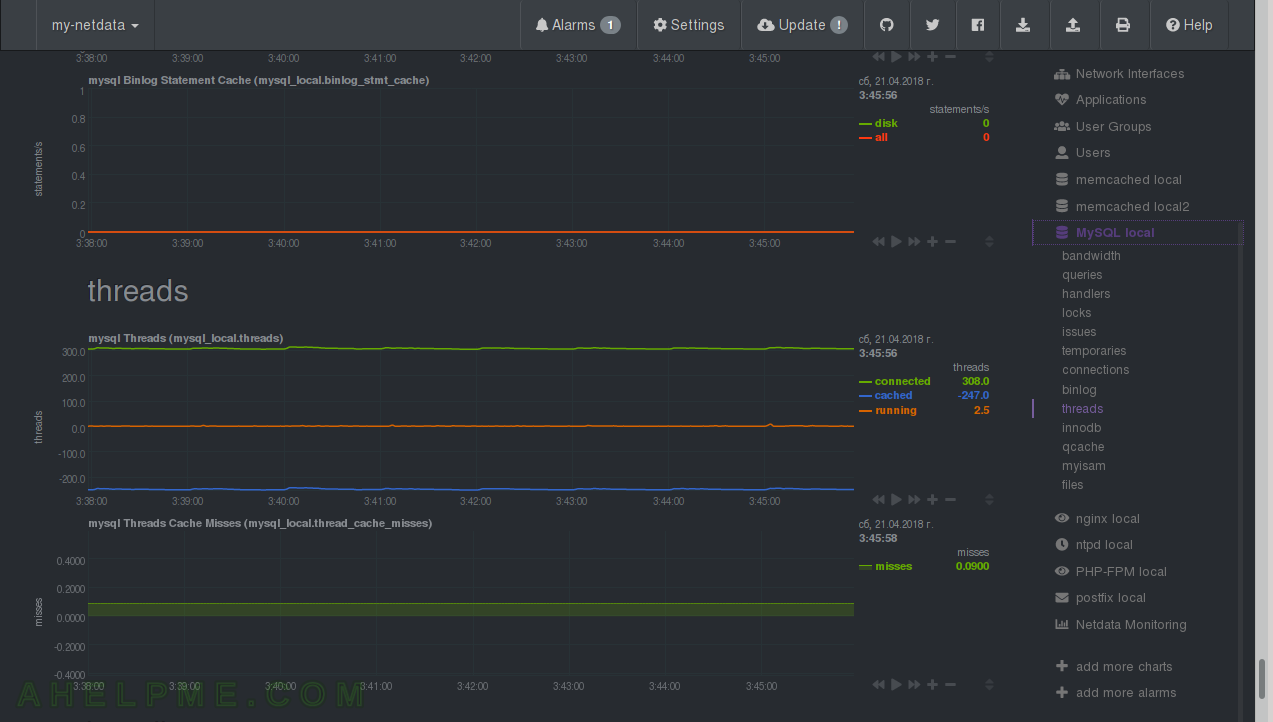
CHART 10) MySQL – Innodb engine infromation
1) Innodb I/O bandwidth – reads and writes; 2) Innodb I/O Operations – reads, writes and fsyncs; 3) Innodb Pending I/O Operations – reads and fsyncs; 4) Innodb Log Operations – write requests and writes.
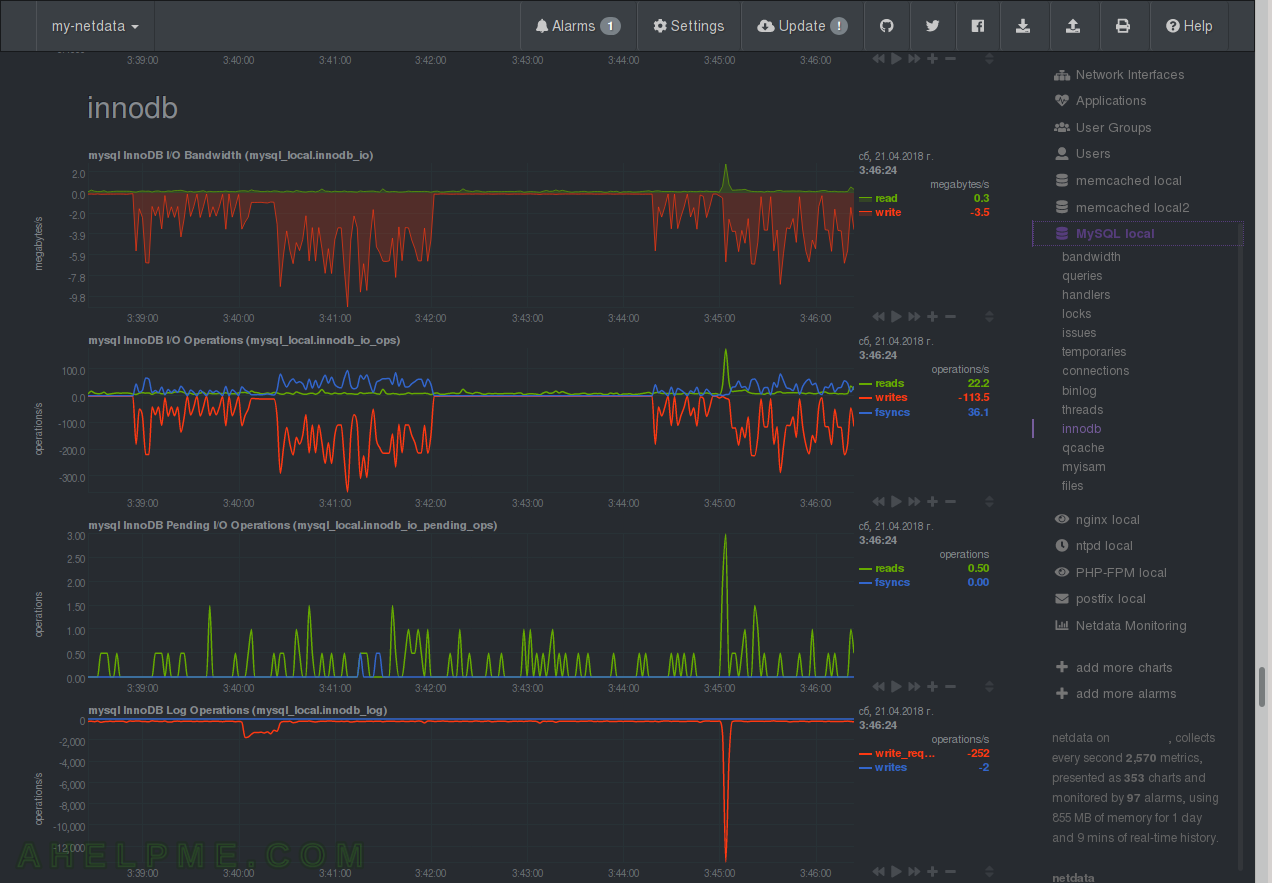
CHART 11) MySQL – Innodb engine infromation 2
1) Innodb OS Log Operations – fsyncs; 2) Innodb OS Log bandwidth – write (megabytes/s); 3) Innodb current row locks – current_waits; 4) Innodb row operations – inserted, read, updated and deleted.
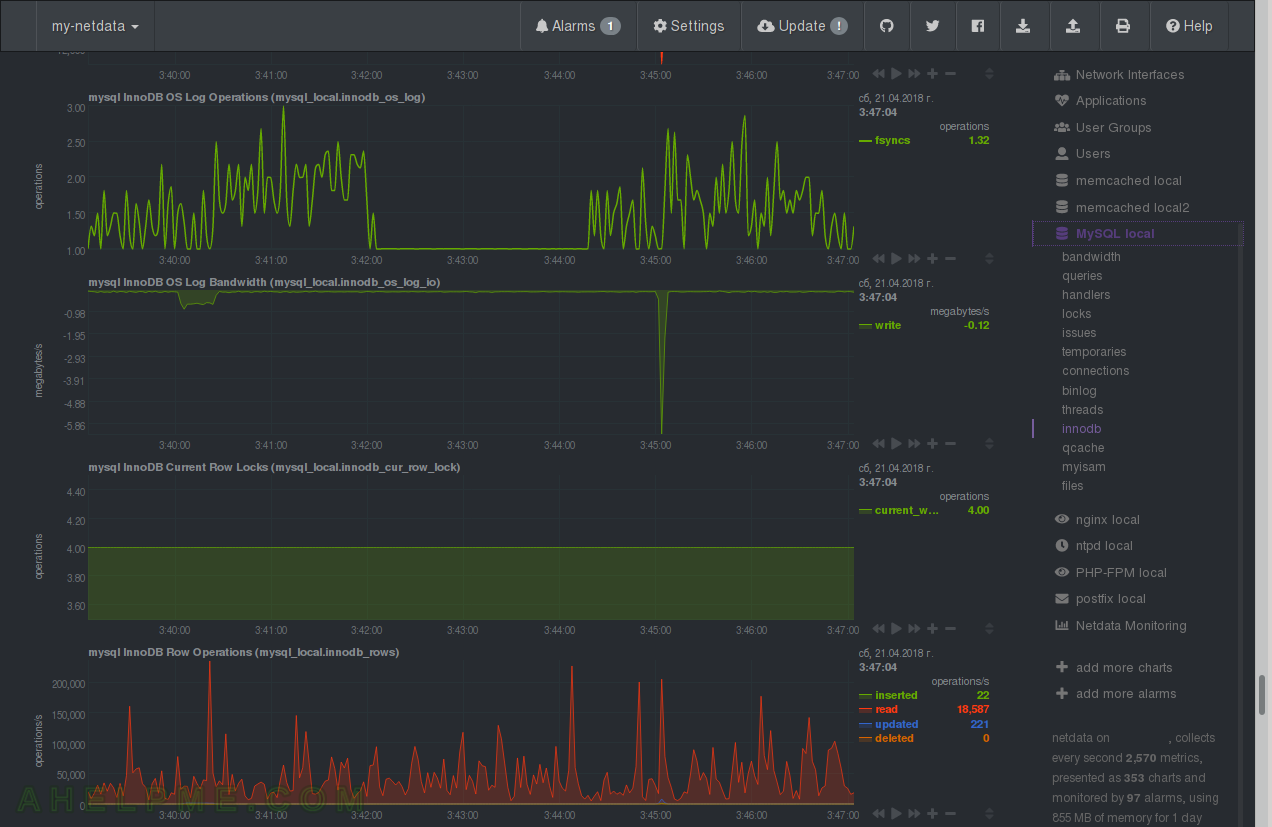
CHART 12) MySQL – Innodb engine infromation 3
1) Innodb buffer pool pages – data, dirty, free, flushed, misc, total; 2) Innodb buffer pool bytes – data and dirty; 3) Innodb buffer pool read ahaed – all, evicted, random; 4) Innodb buffer pool requests – reads and writes per second.
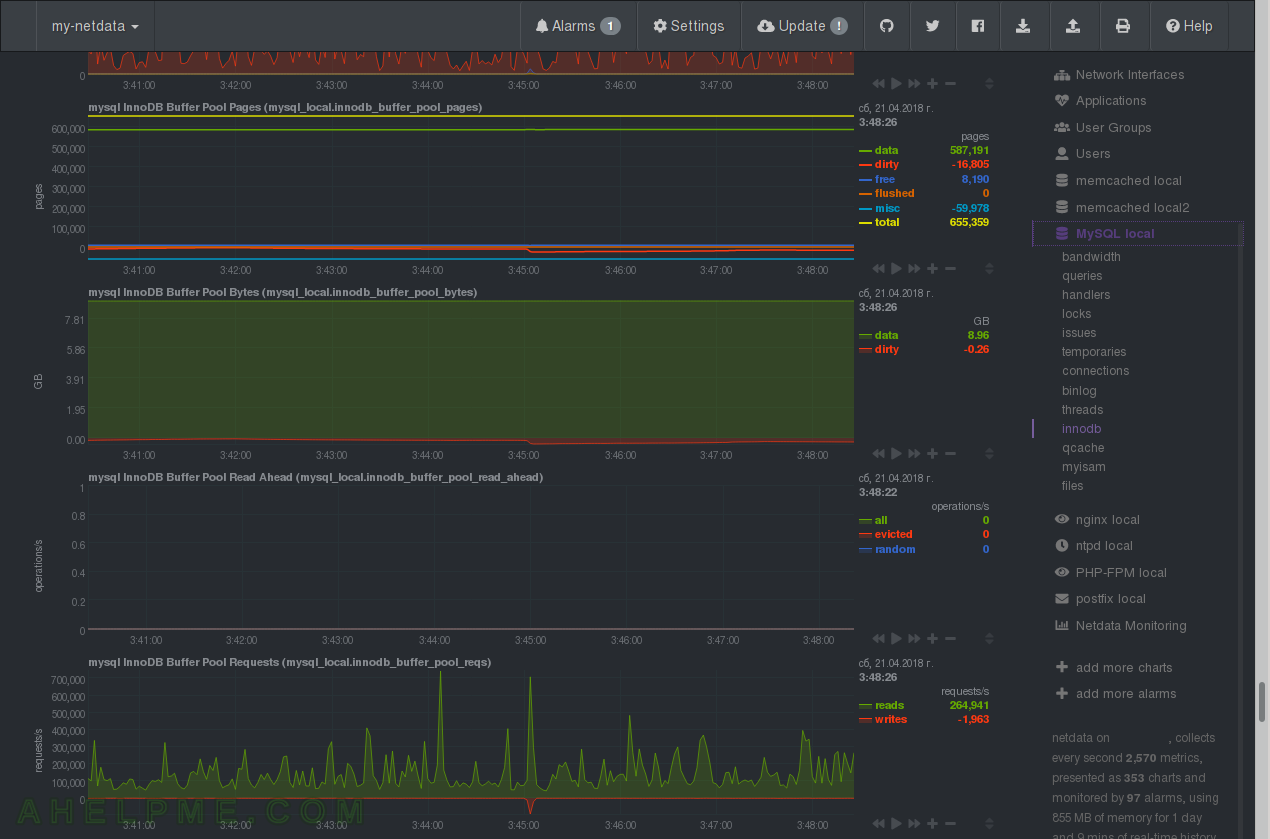
CHART 13) MySQL – Innodb engine infromation 4
1) Innodb buffer pool operations – disk reads – operations per second.

CHART 14) MySQL – query cache (qcache)
1) query cache operations – hits, low memory prunes, inserts, not cached; 2) queries in the cache; 3) query cache free memory; 4) query cache memory blocks – free and total.
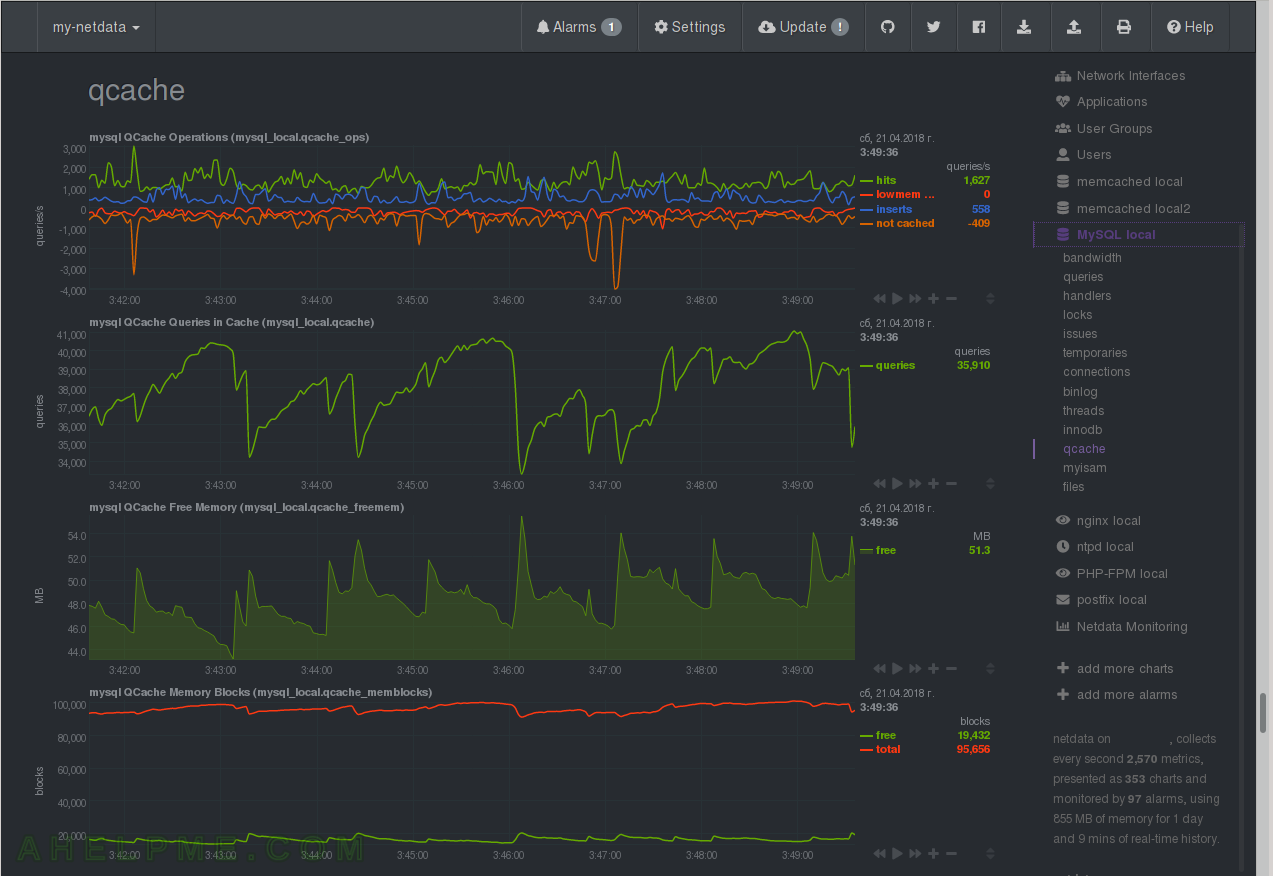
CHART 15) MySQL – myisam engine information
This server does not uses MyISAM engine, so you can see almost everything is zero – 1) MyISAM key cache blocks – unused and used; 2) MyISAM key cache requests – reads and writes; 3) MyISAM key cache disk operation – reads and writes.
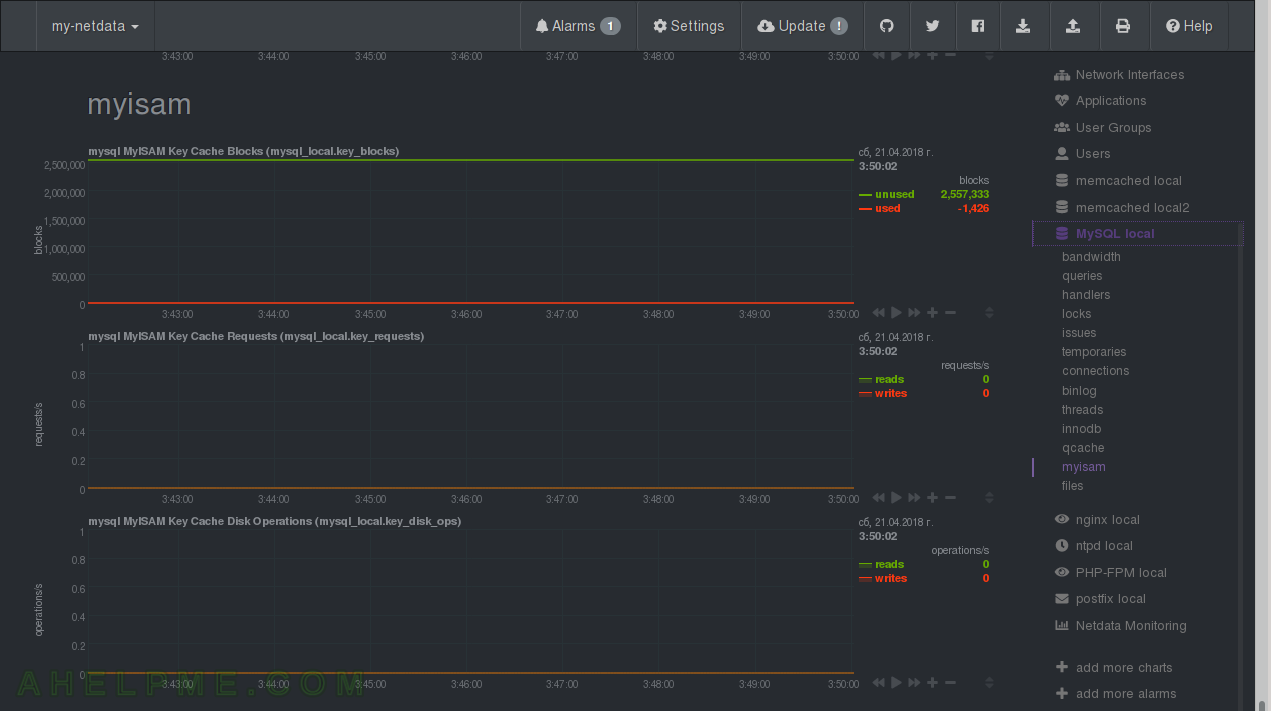
CHART 16) MySQL – files
1) open files – how many files are opened at the moment; 2) opened file rate – files per second.
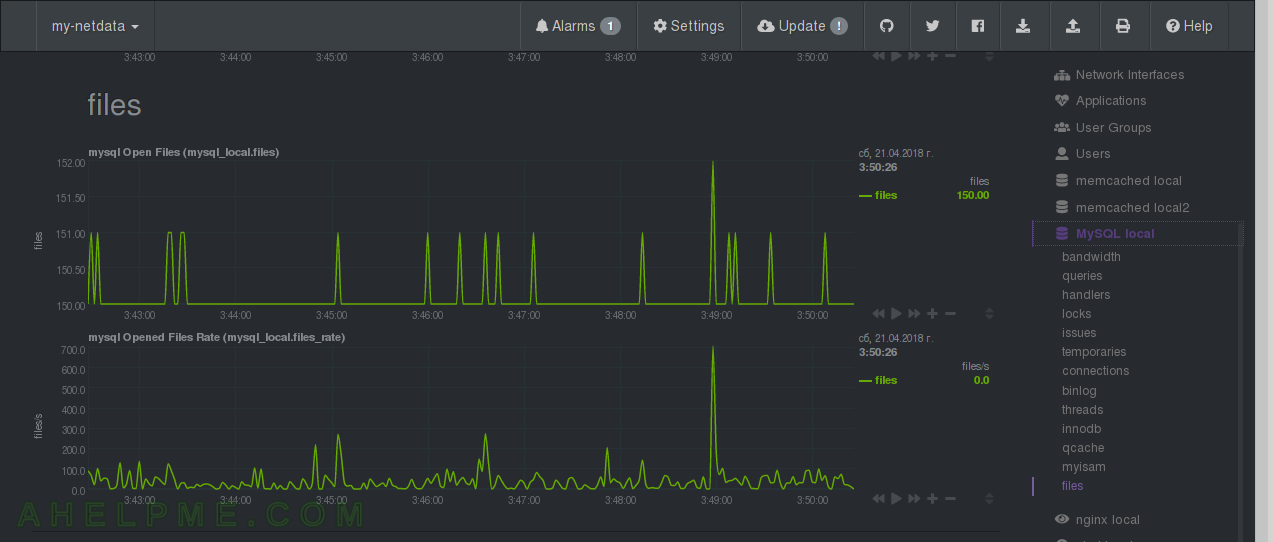
CHART 17) Memcached – distributed memory caching system. A key-value memory storage.
1) cache size – available and used; 2) network – in and out megabytes per second.
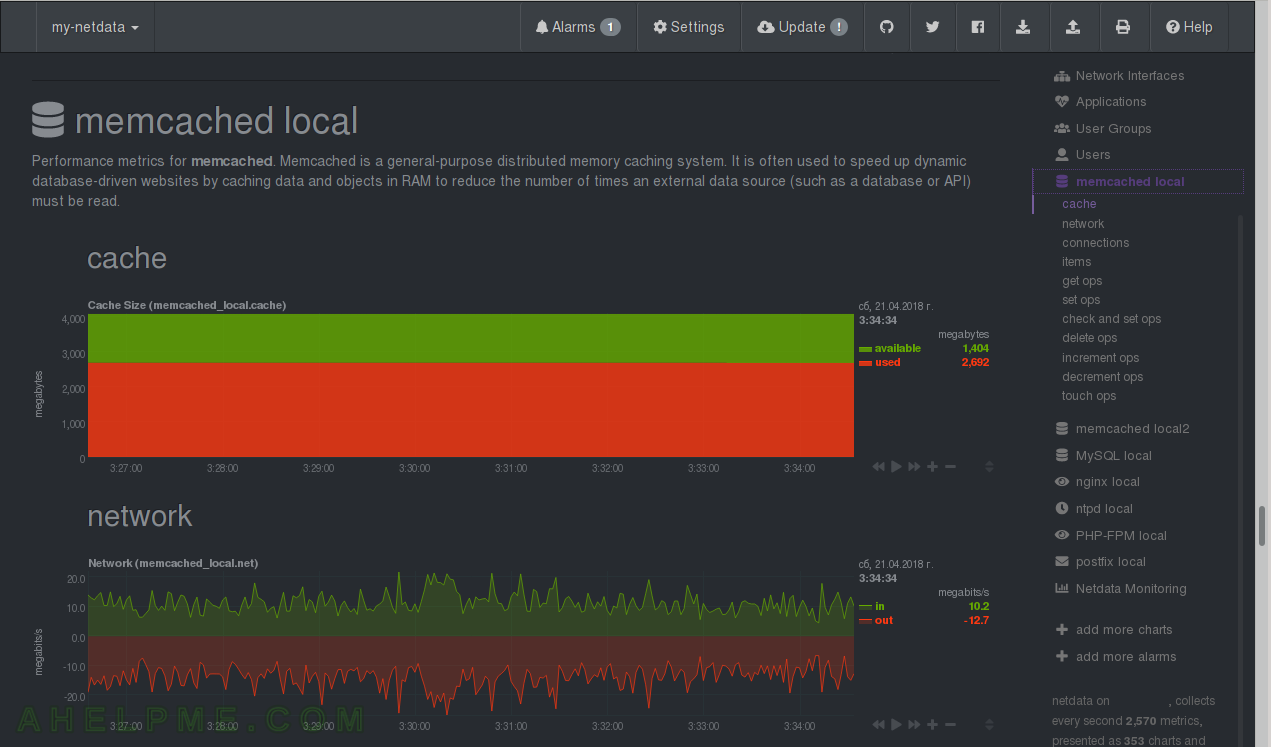
CHART 18) Memcached – connections and items
1) connections – current and total. Persistent connections are used, so no new connections often; 2) items cached – current and total. 3) items – evicted (forced removed – be careful here, this means your cached items are forcedly removed by the server because of lack of memory?) and reclaims (expired items).
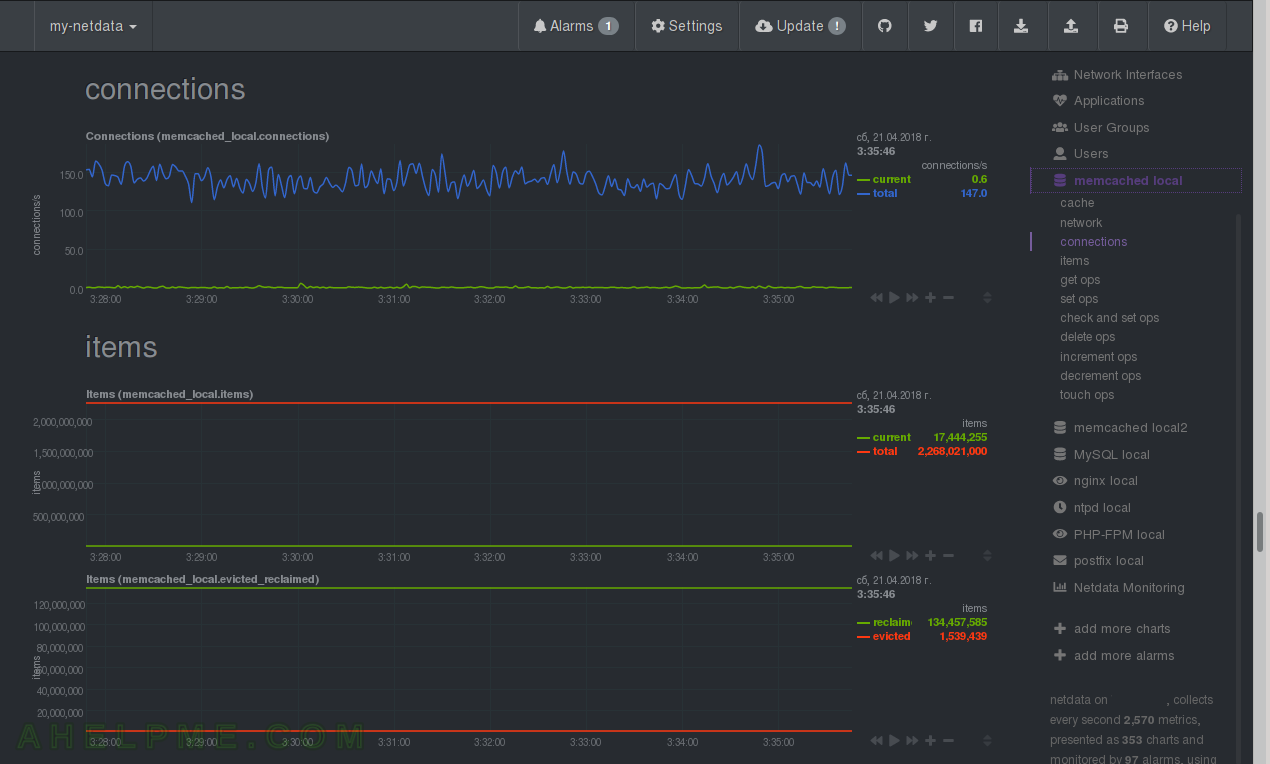
CHART 19) Memcached – get and set operations
1) get operation requests – hits and misses; 2) get operations rate – requests per second; 3) set operation requests – requests per second.
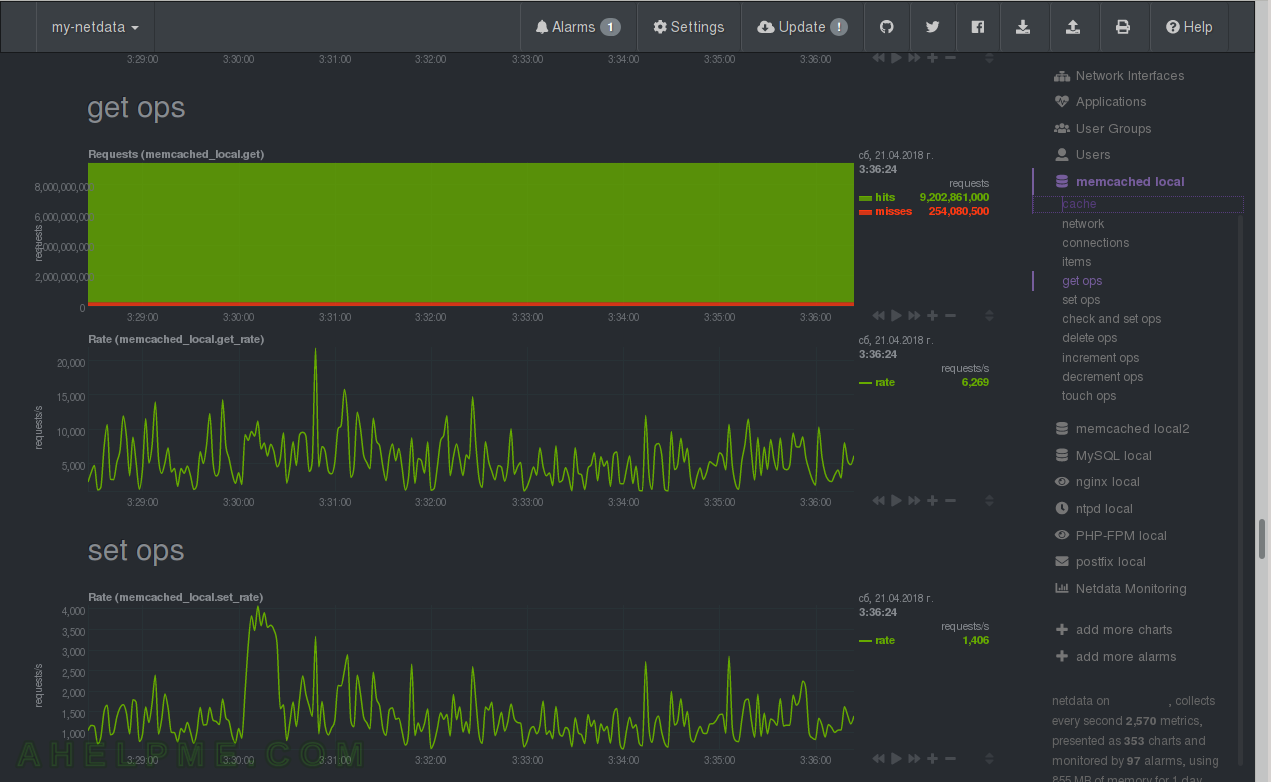
CHART 20) Memcached – check and set ops, delete ops, increment ops
1) check and set operation requests – hits, misses, bad value; 2) delete operation requests – hits and misses; increment operation requests – hits and misses
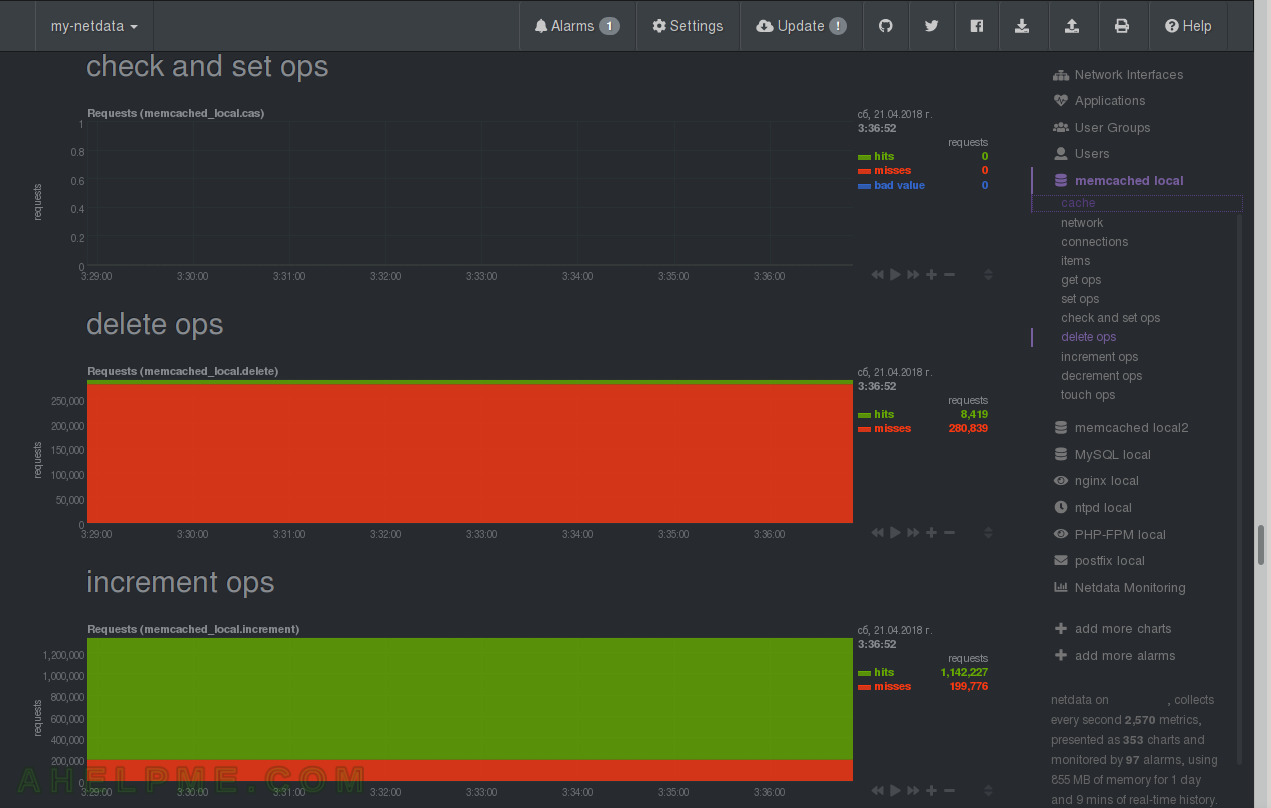
CHART 21) Memcached – decrement ops, touch ops
1) decrement operation request – hits and misses; 2) touch operation requests – hits and misses; 3) touch operation requests rate – requests per second.
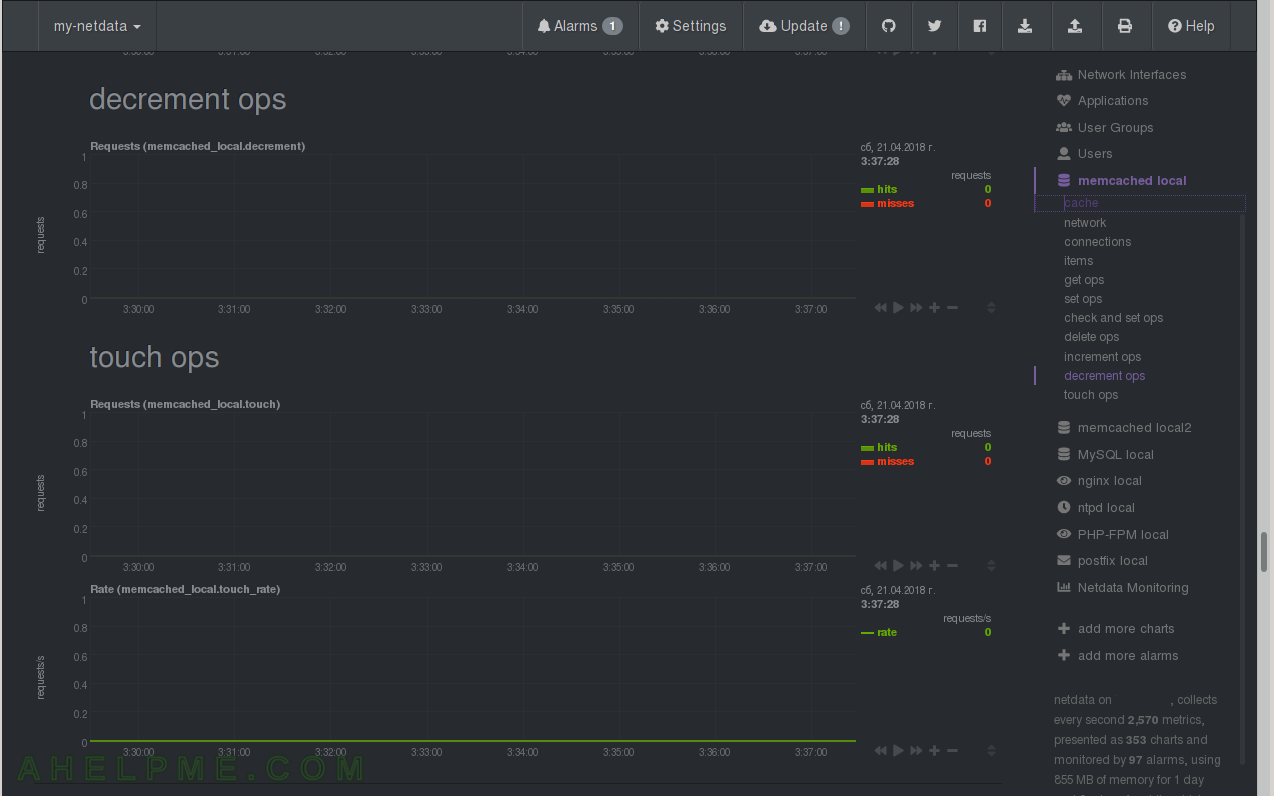
CHART 22) Postfix – mail service
1) Postfix Queue Emails – the emails in the queue of the mail transfer agent, these mails are in transfer state; 2) Postfix Queue Emails size – size.
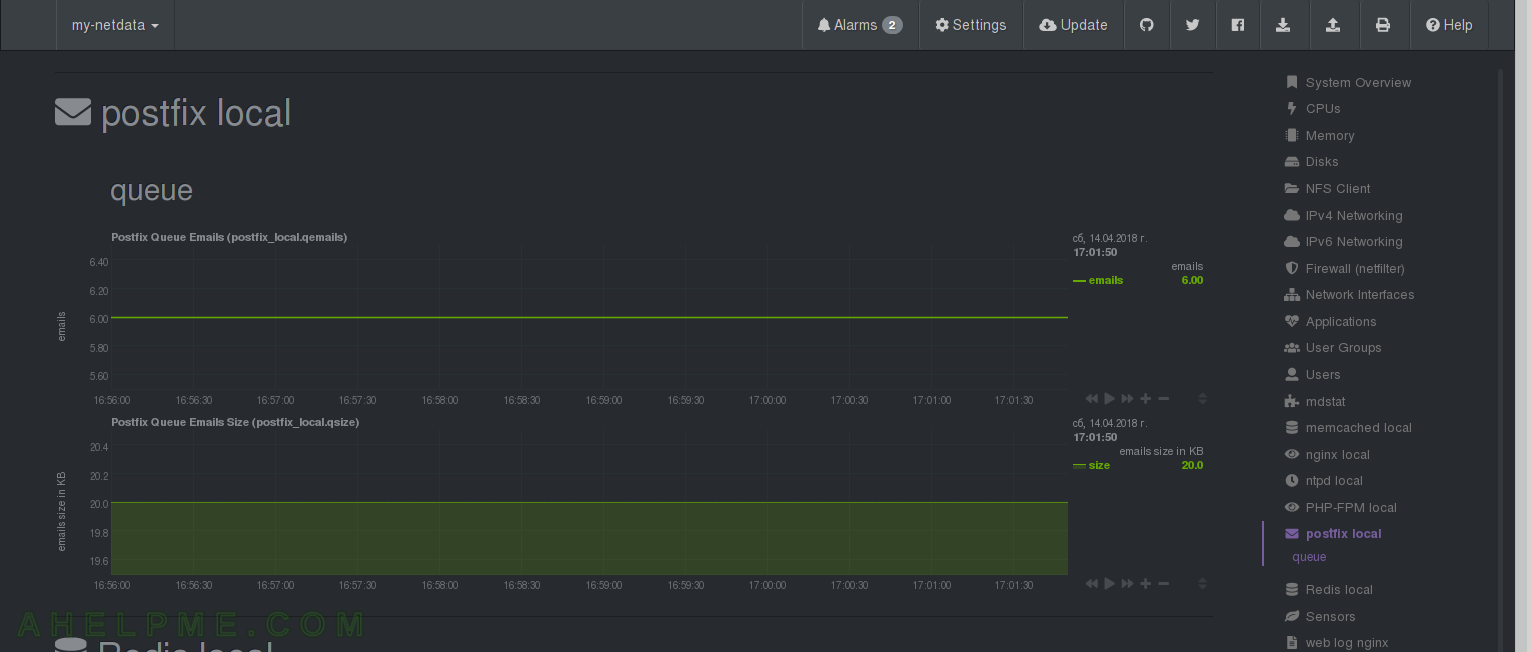
CHART 23) Redis – performance metrics for in-memory data structure store, used as a database, cache and message broker.
1) operations – commands and operations per second; 2) hit rate – persentage, the effectiveness of the cache.
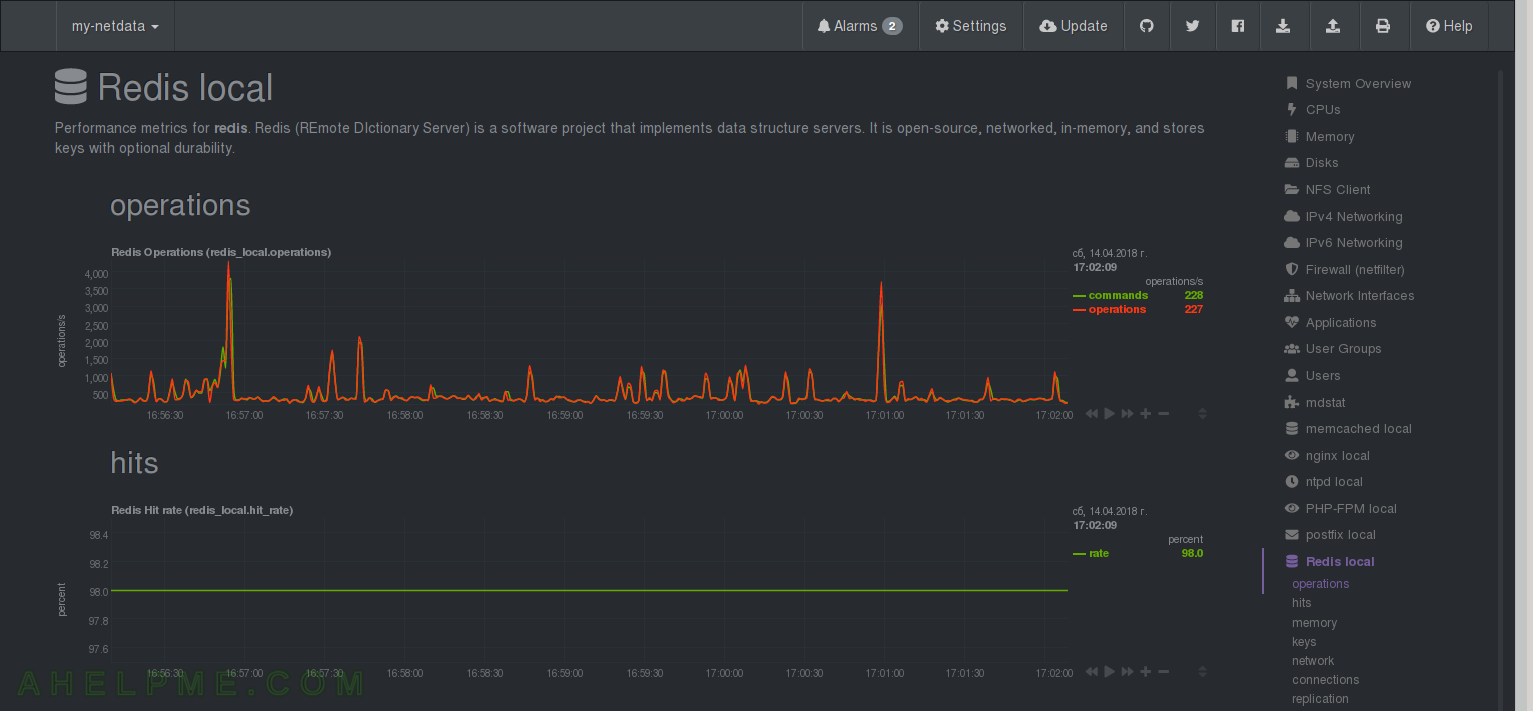
CHART 24) Redis – memory, keys, network
1) Redis memory utilization – total and lua; 2) keys – how many keys does each database have – keys per database name; 3) network – Redis network bandwidth – in and out in megabytes per second.
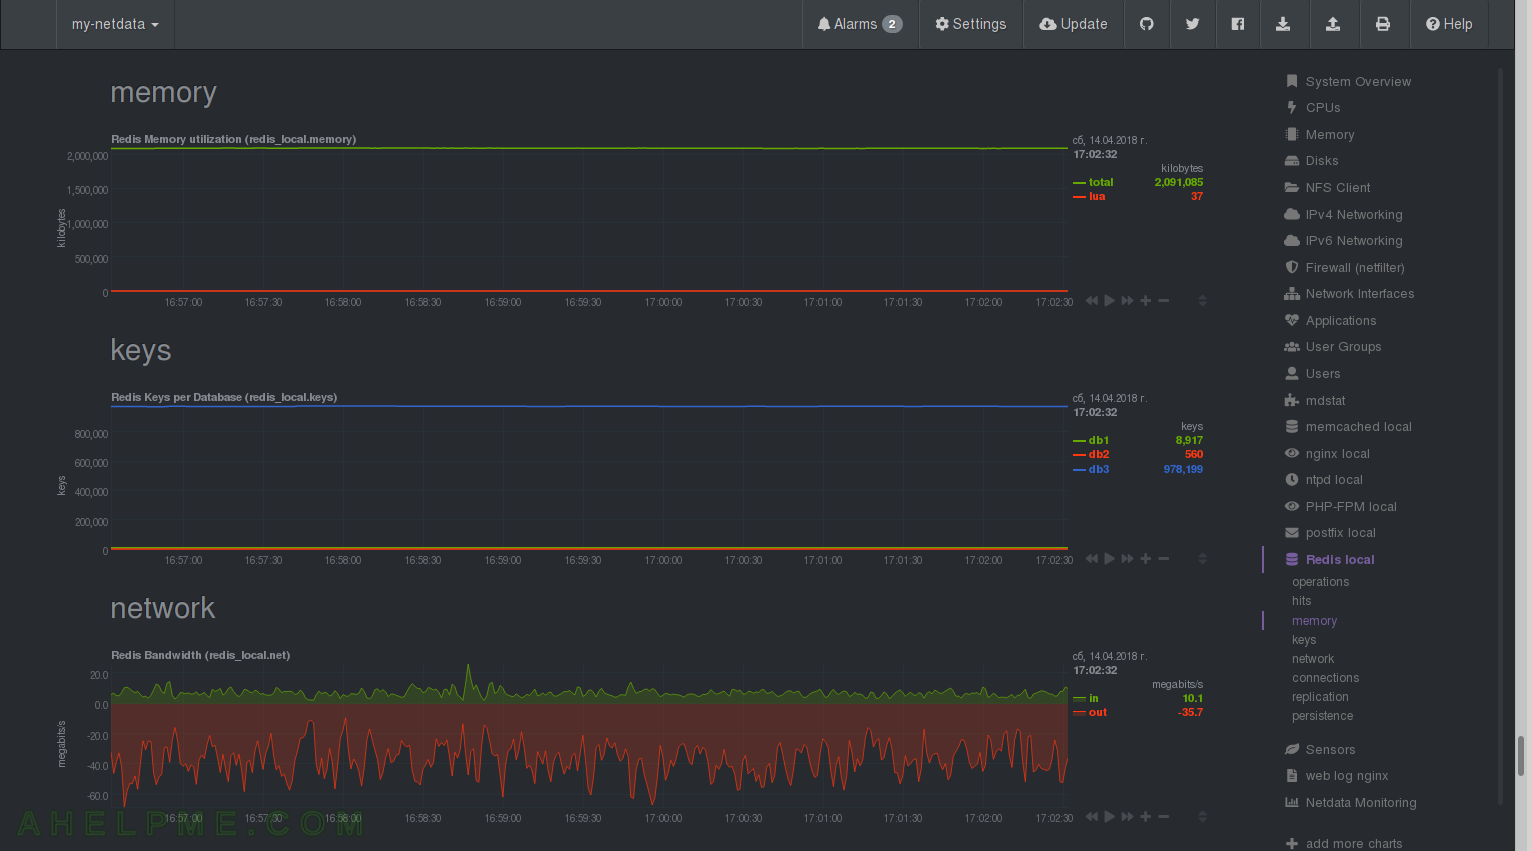
CHART 25) Redis – connections and replication
1) Redis connections – received per second – it’s like new connections and if you use persistent connections no new connections are opened often; 2) Redis clients – connected processes to the redis server; 3) replication – connected slave servers.
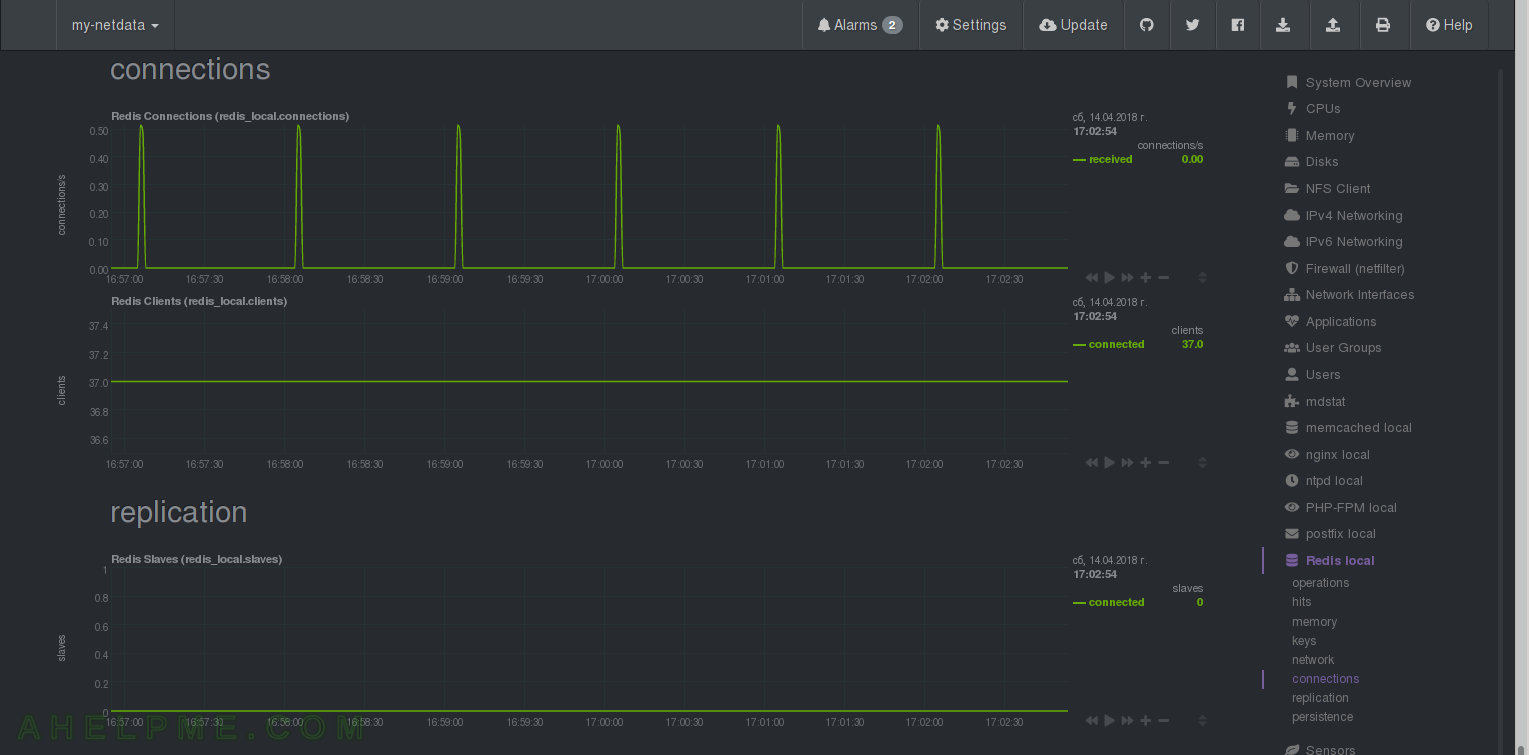
CHART 26) Redis – persistence (save the databases to the disks)
1) Persistence changes since last save – changes – how many changed items have been there since last save of the databases to the disks. 2) Duration of the RDB Save operation – rdb save in time; 3) Status of the last RDB Save Operation – rdb status.
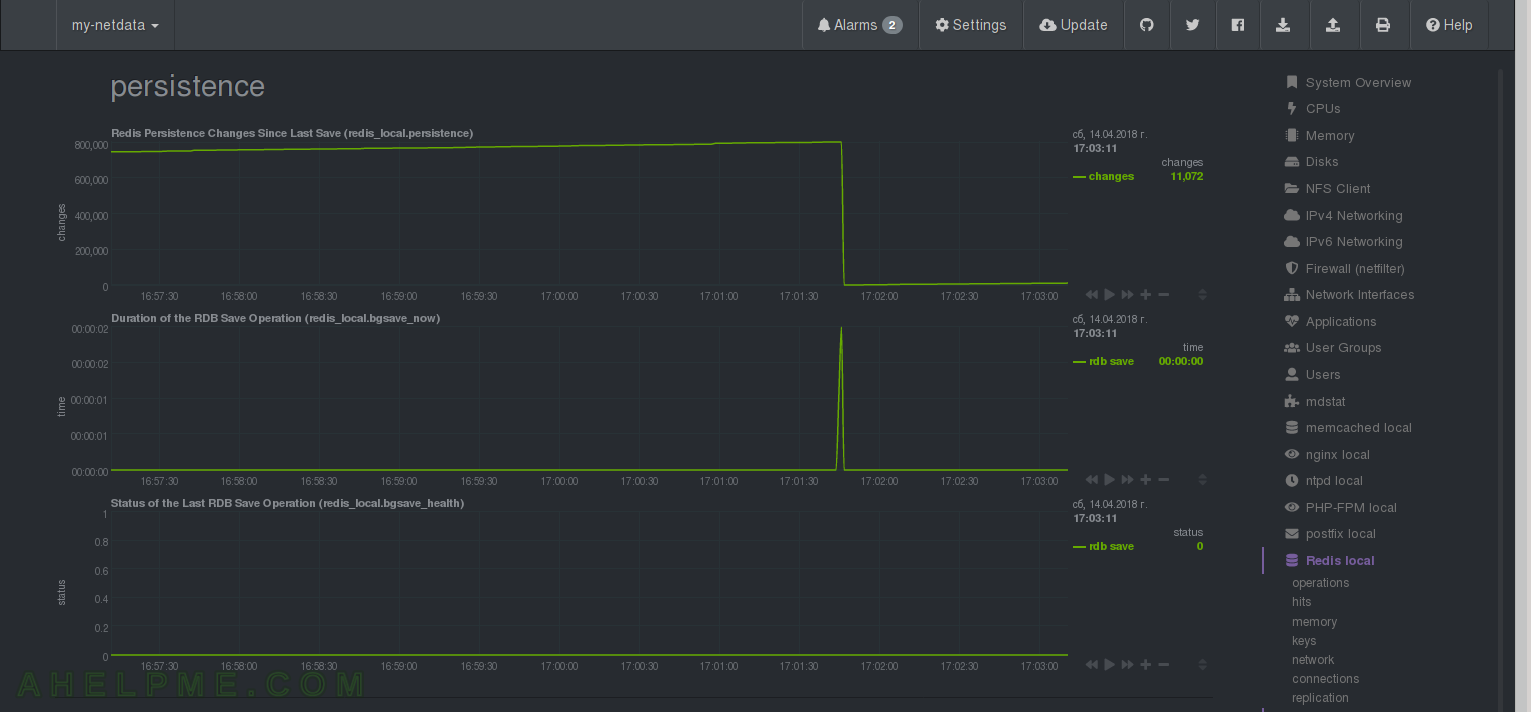
CHART 27) Web server access logs information
Live parsing of the access logs – be careful here, because this could take a good deal of CPU and I/O of your busy server. Here we included only the default nginx log, which does not save many records. netdata Quotation: “Information extracted from a server log file. web_log plugin incrementally parses the server log file to provide, in real-time, a break down of key server performance metrics. For web servers, an extended log file format may optionally be used (for nginx and apache) offering timing information and bandwidth for both requests and responses. web_log plugin may also be configured to provide a break down of requests per URL pattern (check /etc/netdata/python.d/web_log.conf).” – 1) responses – success and bad requests per second; 2) Response codes – 1xx and 4xx and more if any in the logs.
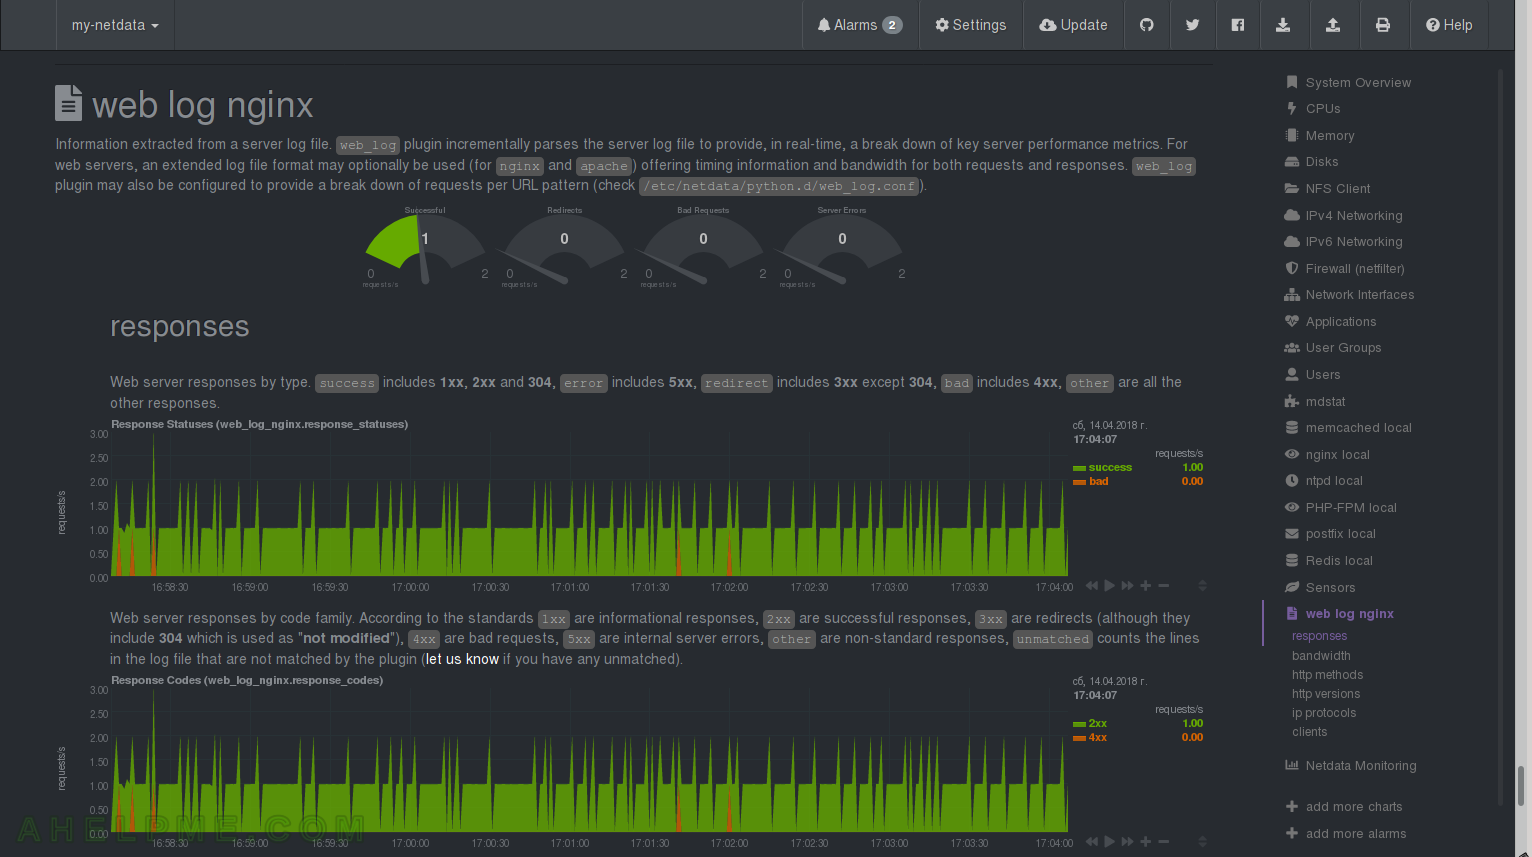
CHART 28) Web server access logs information – detailed response code, bandwidth, http methods
1) detailed response code – requests per second; 2) bandwidth of the requests and reponses; 3) Requests per HTTP Method – GET, POST, PUT, DELETE and so on if they present in the logs.
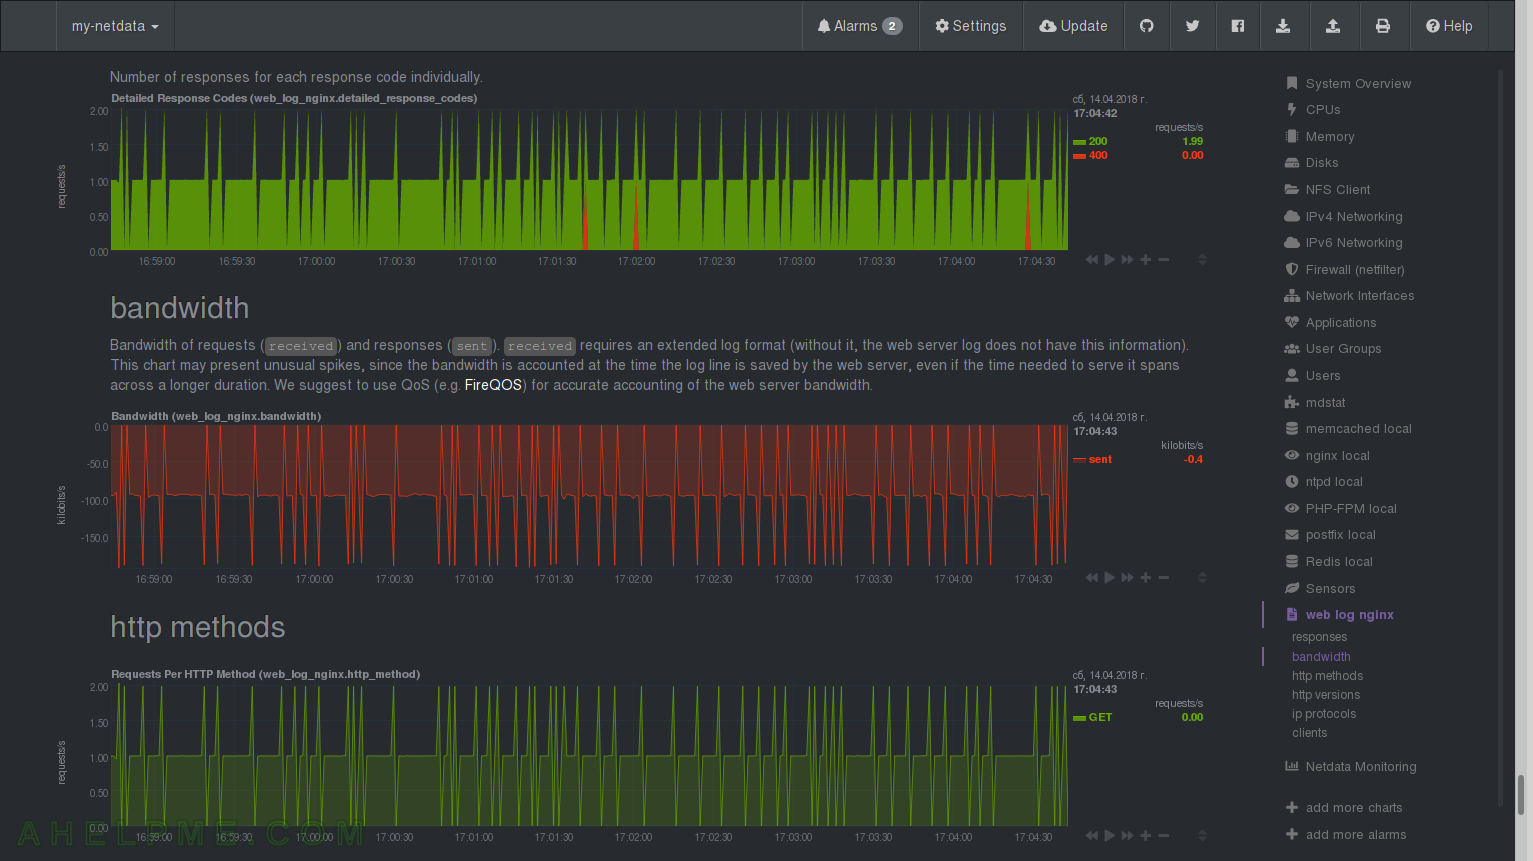
CHART 29) Web server access logs information – http versions, ip protocols, clients
1) Requests per HTTP Version – 1.0, 1.1 and 2.0 if any in the logs; 2) Requests per IP protocol – IPv4 and IPv6 (if used); 3) clients – unique client IPs per data collection.
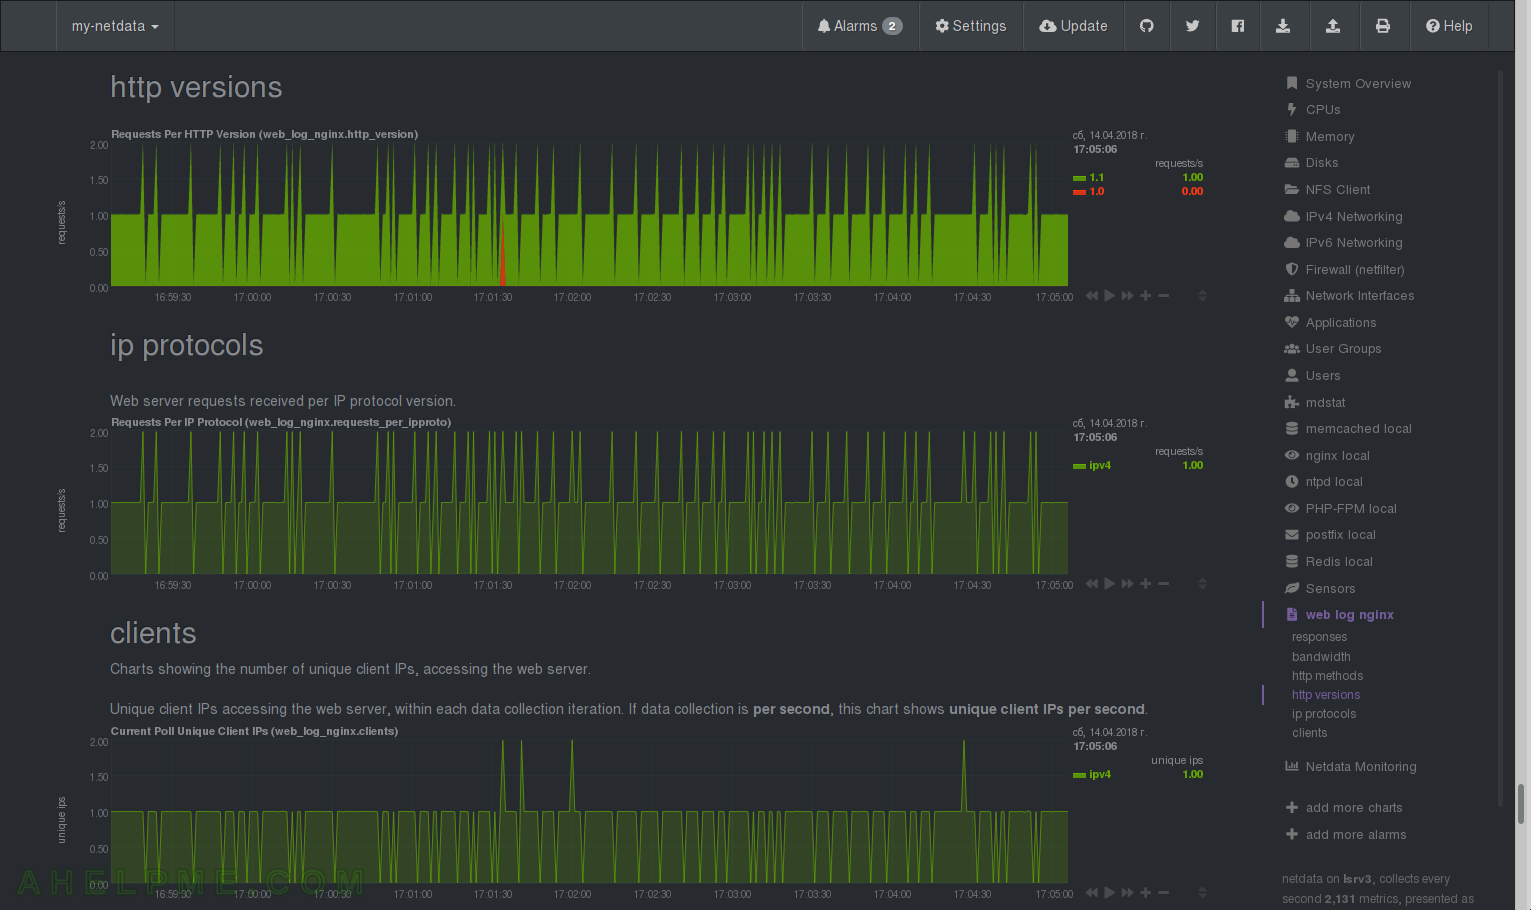
CHART 30) Web server access logs information – unique client IPs
Unique client IPs since last restart of netdata
