This is a review of the netdata graphs. Here you can see what you can expect to have when you install netdata (version 1.10) in you server.
As you can see many of the graphs have detailed explanations and some of them have hits what to monitor and pay attention to.
CHART 1) System Overview and grapsh which gather statistics from all parts of the system like CPU, load, disk, ram, swap, network, processes, idlejitter, interrups, softirqs, softnet, entropy, ipc semaphores, uptime.
This is a fst view of the resources of the system and it presents summarized statistics, not detailed! For example you can expect to have the total CPU usage not per core or processor and so on.
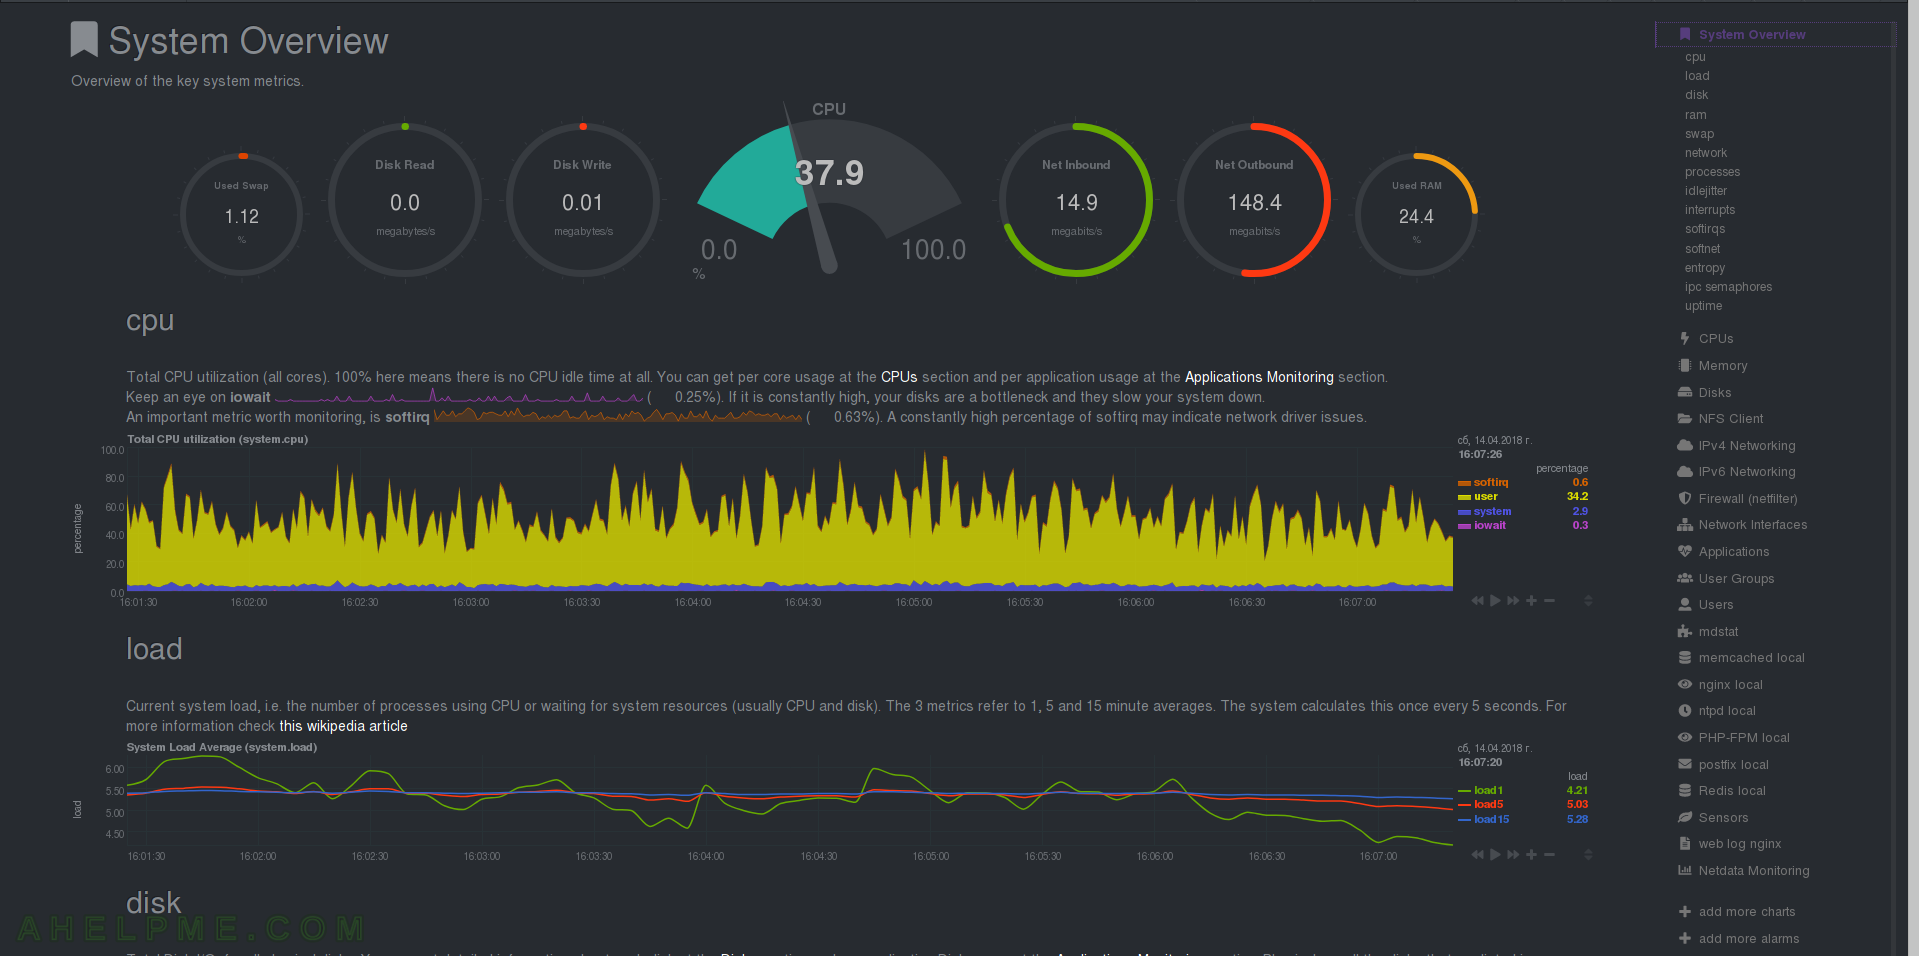
CHART 2) CPU and Load
1) Total CPU utilization, netdata Quotation: “Total CPU utilization (all cores). 100% here means there is no CPU idle time at all. You can get per core usage at the CPUs section and per application usage at the Applications Monitoring section. Keep an eye on iowait. If it is constantly high, your disks are a bottleneck and they slow your system down. Another important metric worth monitoring, is softirq. A constantly high percentage of softirq may indicate network driver issues.” and 2) System Load Average – netdata Quotation: “Current system load, i.e. the number of processes using CPU or waiting for system resources (usually CPU and disk). The 3 metrics refer to 1, 5 and 15 minute averages. Linux calculates this once every 5 seconds. Netdata reads them from /proc/loadavg.””

CHART 3) Disk
1) Total Disk I/O for all disks from /proc/vmstat. You can easily match how much of the read/written data is from/to disks. 2) Memory paged form/to disk.
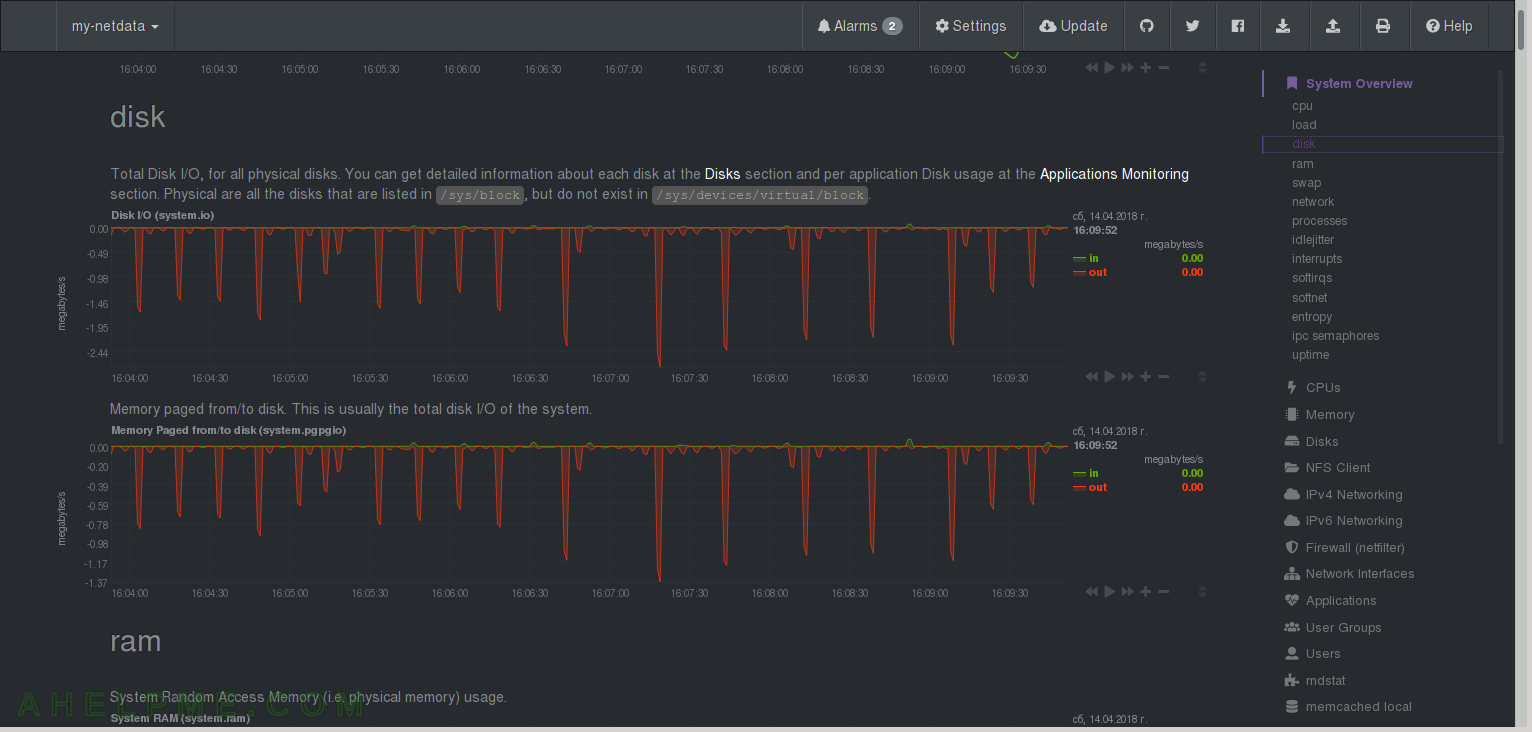
CHART 4) RAM
1) Read from /proc/meminfo. It shows the total RAM and how much is free, used, cached and in buffers. Together with swap graph this is like “free” linux command in the browser. 2) Read from /proc/meminfo. It shows total, free and used swap memory. 3) Swap I/O – Read from /proc/vmstat. More interesting than the previous one, because here you can get aware how often is used your swap device. In fact if you have ins and outs here even a couple of them you probably need more physical RAM or you have misconfigured a service or a application, which could be identified by graphs in Applications->mem or User->mem – which shows the applications’ and users’ ram usage.
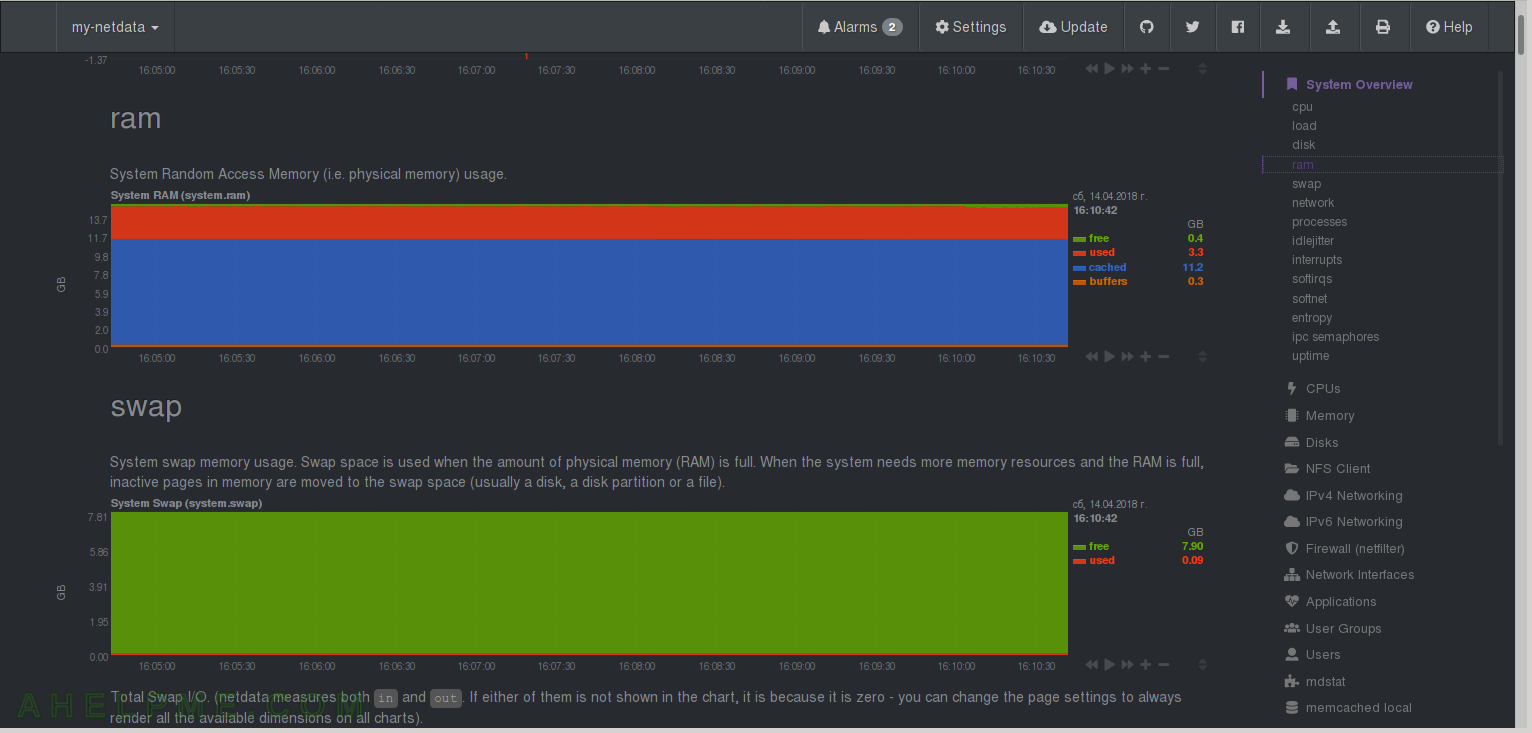
CHART 5) All network traffic on all interfaces – no virtual ones included, but it includes IPv4 and IPv6 traffic.
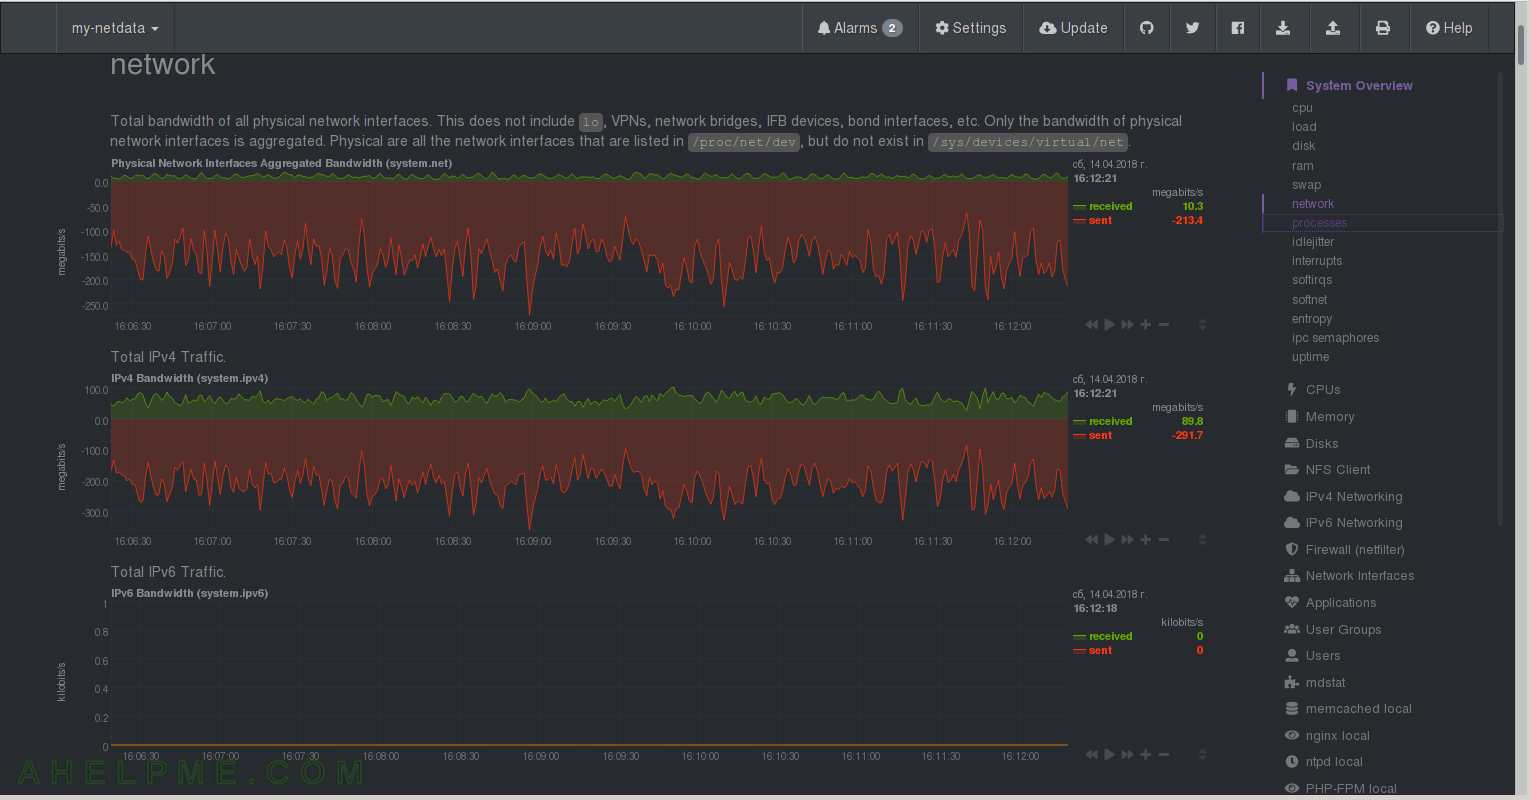
CHART 6) Processes
1) Read /proc/stat. It appears the Running are “processes in the CPU” and Blocked are in Disk sleep. netdata Quotation: “System processes, read from /proc/stat. Running are the processes in the CPU. Blocked are processes that are willing to enter the CPU, but they cannot, e.g. because they wait for disk activity.” 2) The number of new processes created per second. 3) All system processes – the total number for the given time.
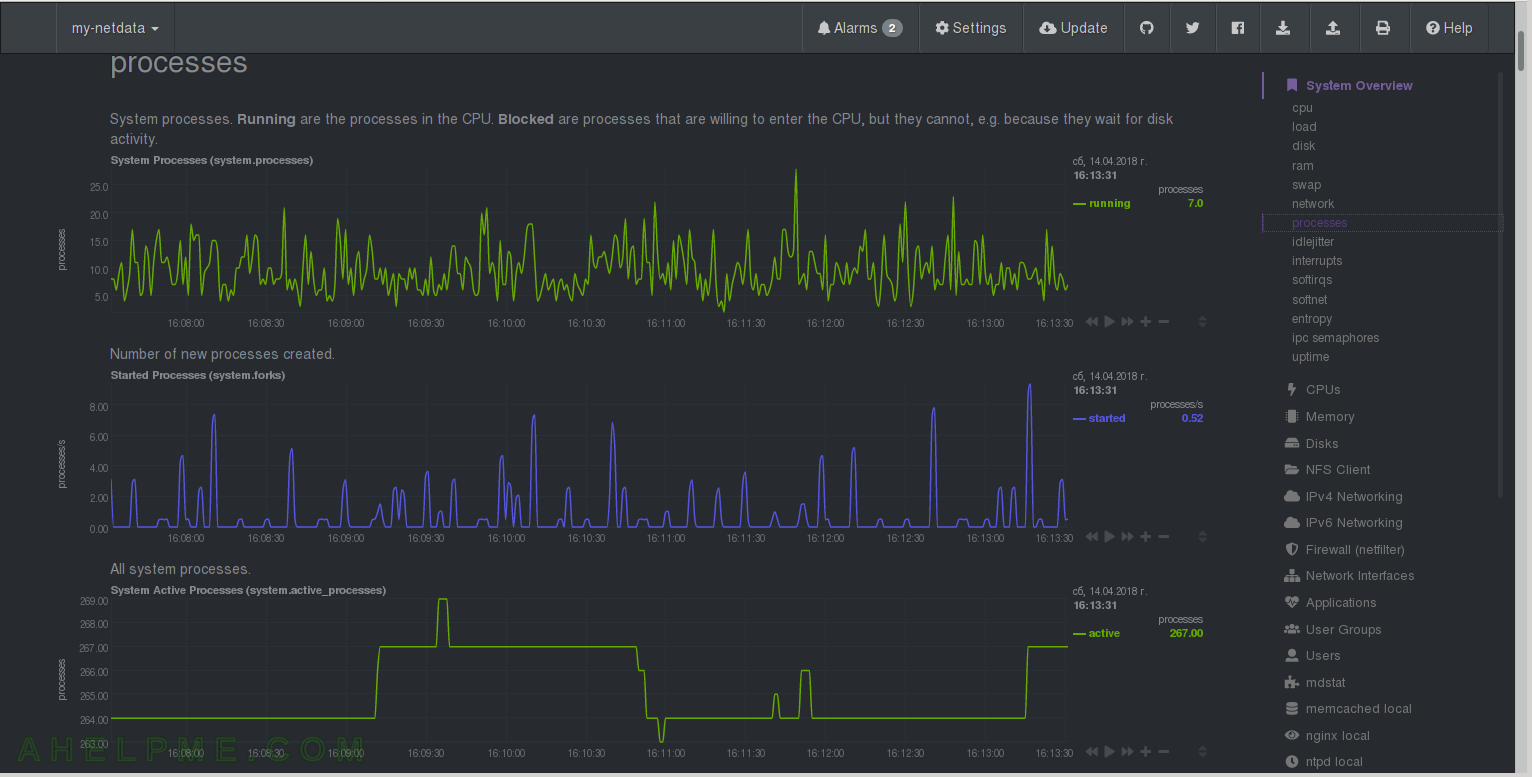
CHART 7) Context Switches and idle
1) Context Switches – how many times the CPU is switching from one process, thread or task to another. 2) netdata Quotation: “idle jitter is calculated by netdata. A thread is spawned that requests to sleep for a few microseconds. When the system wakes it up, it measures how many microseconds have passed. The difference between the requested and the actual duration of the sleep, is the idle jitter. This number is useful in real-time environments, where CPU jitter can affect the quality of the service (like VoIP media gateways).”
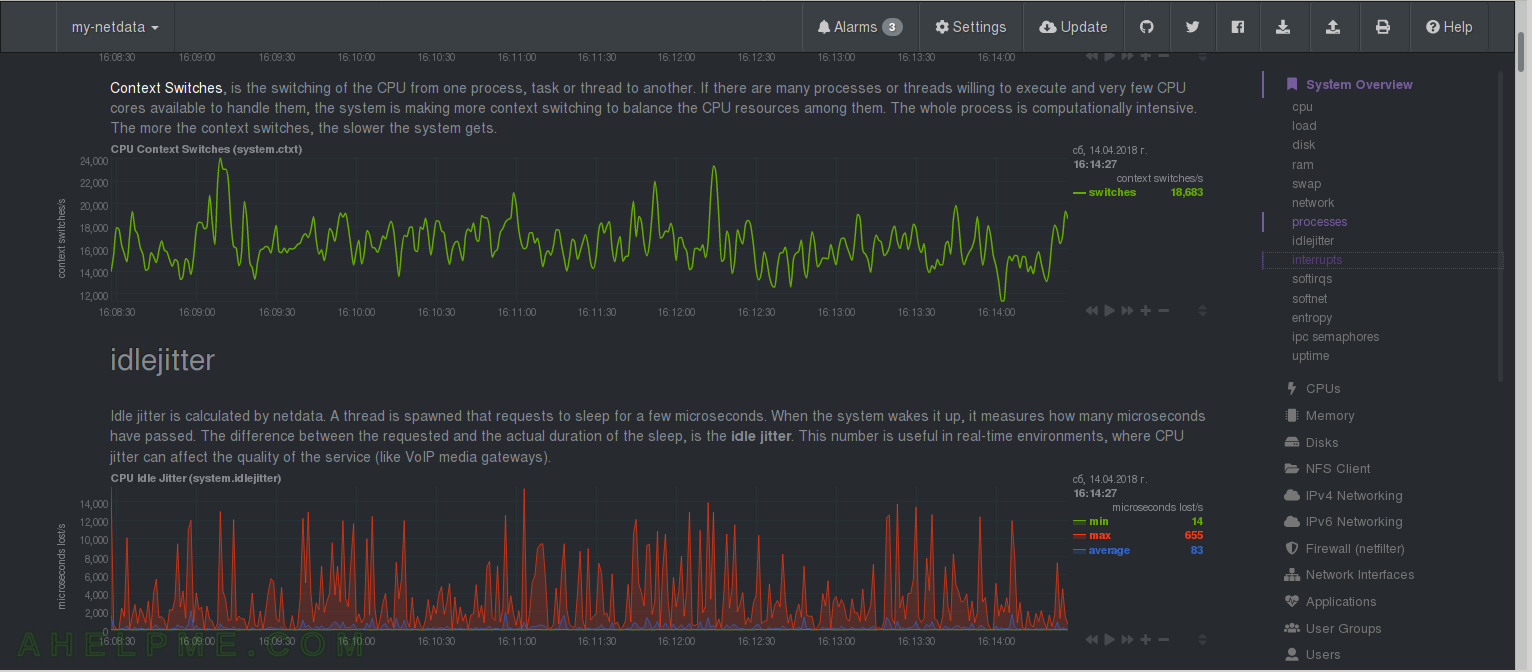
CHART 8) Interrupts and softirqs
1) Total number of CPU interrupts, 2) System interrupts – hardware interrupts – which part of your hardware system is doing the interrups – you could identify a hardware abuser. 3) CPU softirqs in detail, read from /proc/softirqs – you could identify a software abuser – a service or a processes
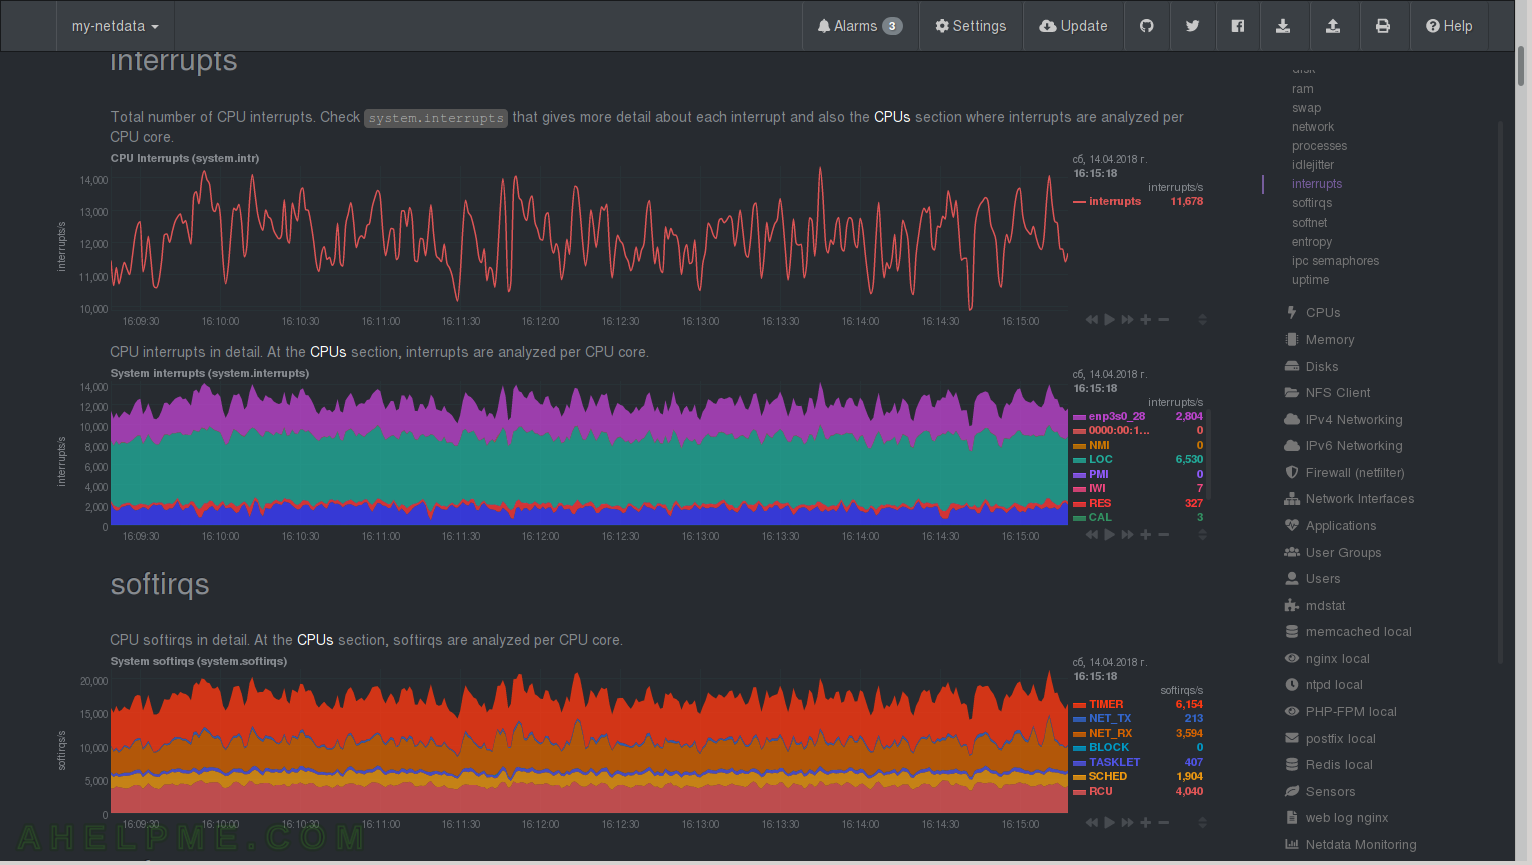
CHART 9) softnet and entropy
1) netdata Quotation: “Statistics for CPUs SoftIRQs related to network receive work. Break down per CPU core can be found at CPU / softnet statistics. processed states the number of packets processed, dropped is the number packets dropped because the network device backlog was full (to fix them on Linux use sysctl to increase net.core.netdev_max_backlog), squeezed is the number of packets dropped because the network device budget ran out (to fix them on Linux use sysctl to increase net.core.netdev_budget).” 2) netdata Quotation: “Entropy, is a pool of random numbers (/dev/random) that is mainly used in cryptography. If the pool of entropy gets empty, processes requiring random numbers may run a lot slower (it depends on the interface each program uses), waiting for the pool to be replenished. Ideally a system with high entropy demands should have a hardware device for that purpose (TPM is one such device). There are also several software-only options you may install, like haveged, although these are generally useful only in servers.”
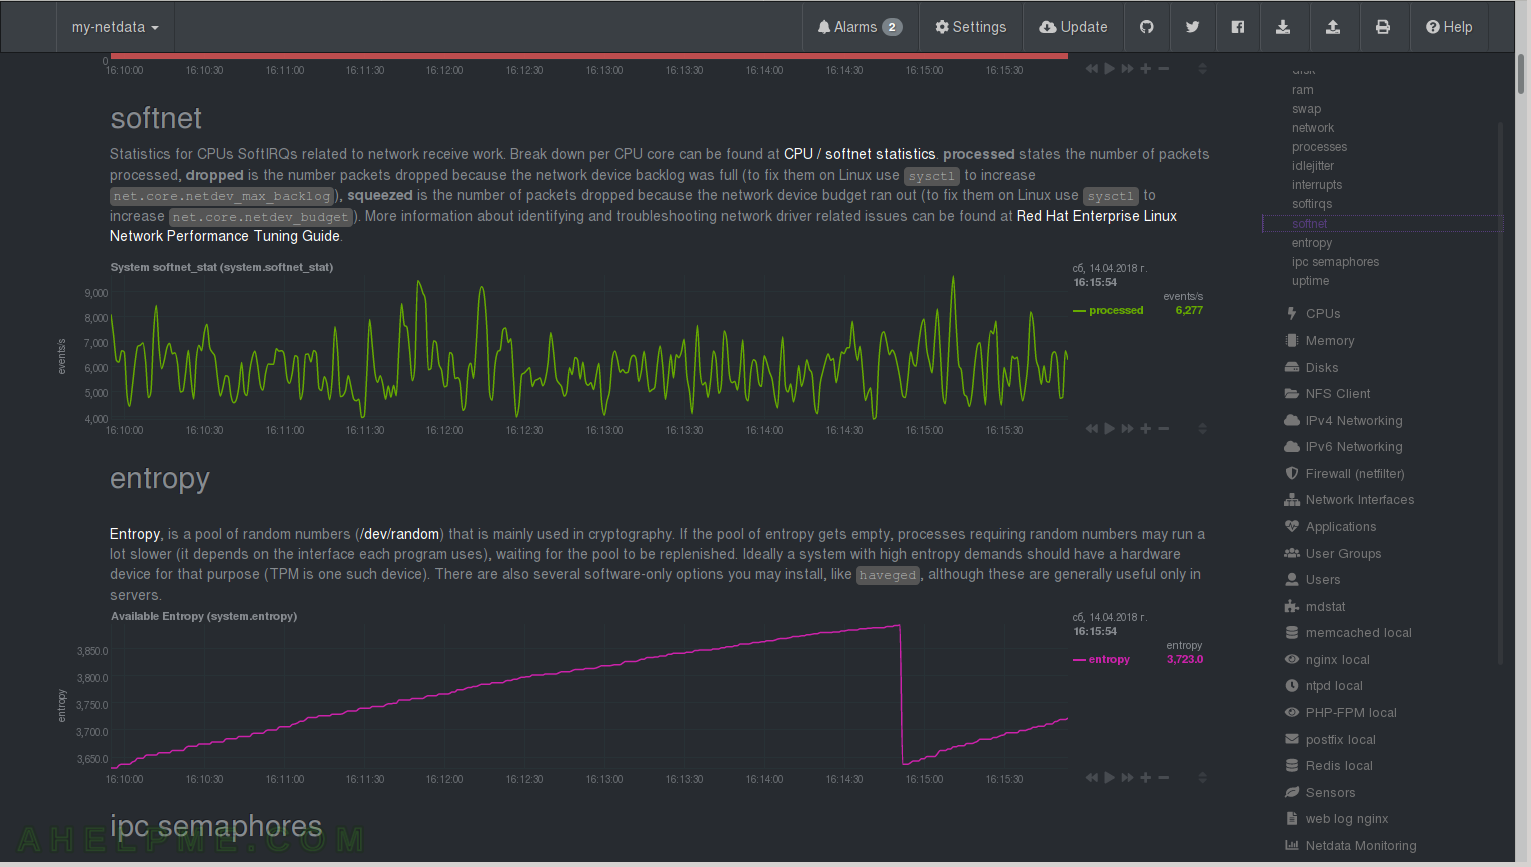
CHART 10) IPC Semaphores and Uptime
1) The total ipc semaphores used in the system 3) uptime of the system
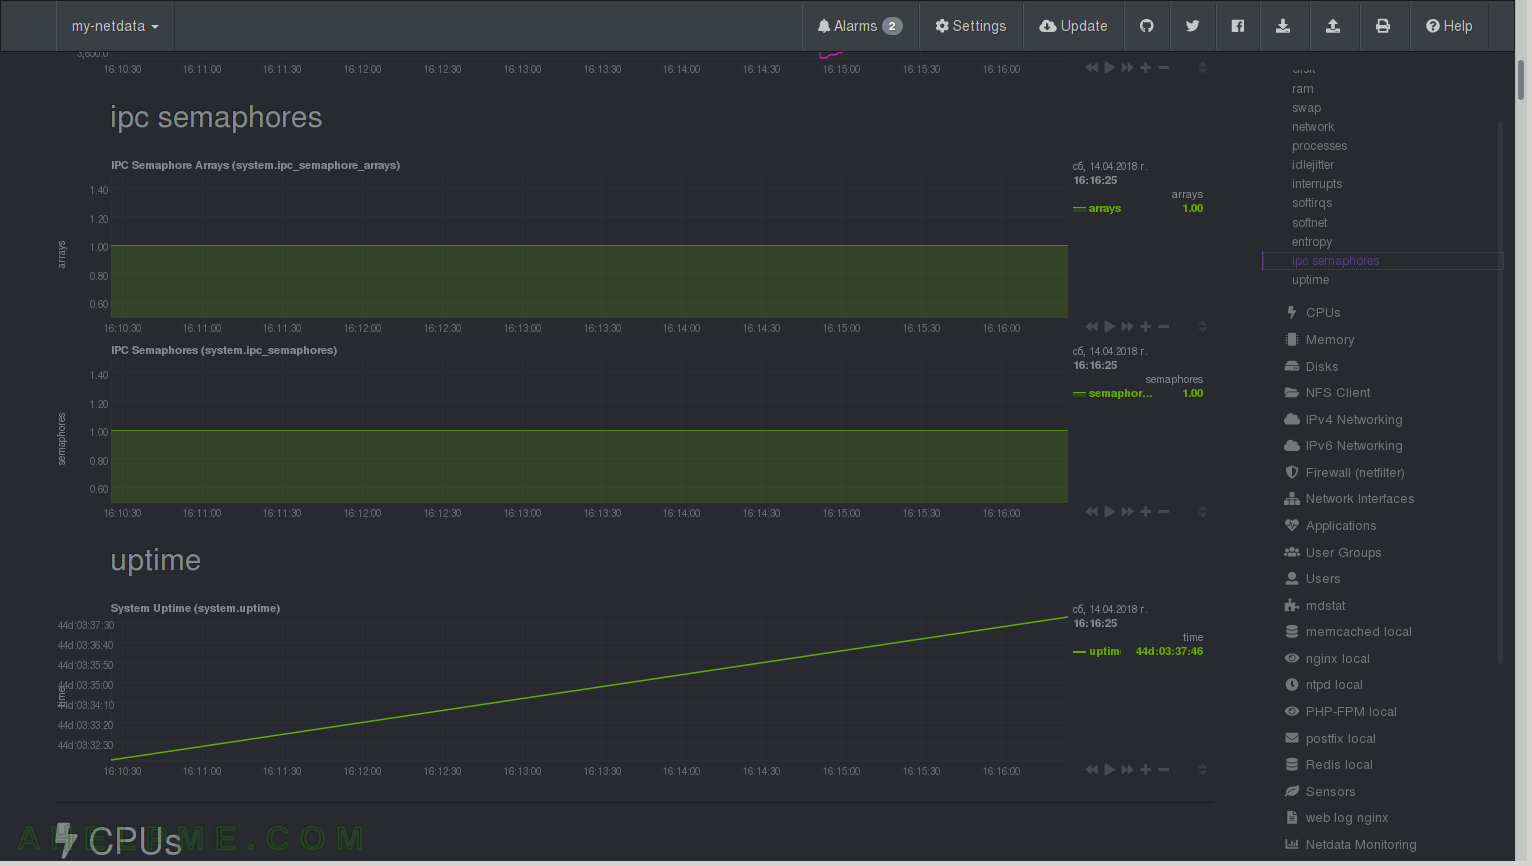
CHART 11) CPU
Utilization by core/logical processor. You can see how much percentage of the CPU is spent in user, system, iowait (probably disk operations!) and softirq (mainly network, but could be also a program with many threads with a lot context switching between them). Here you can see the first Core utilization graph has softirq of 6.0 and the other have none – this is due to the network card is using only the first core/processor (more to follow on the subject).
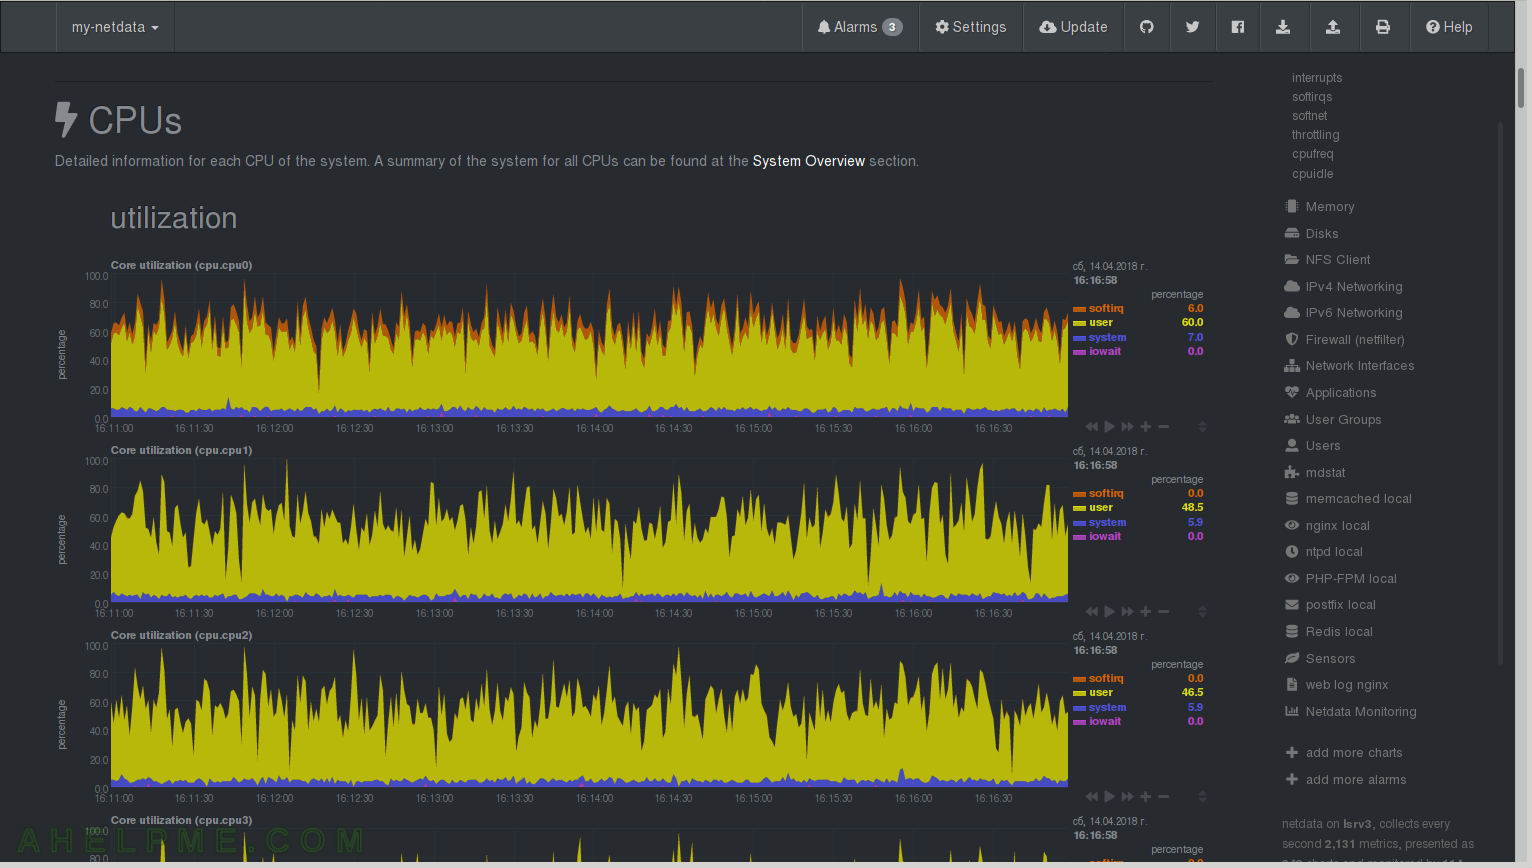
CHART 12) Interrupts
Interrupts by core/logical processor. Hardware interrups – enp3s0_28 (the network card), NMI, LOC, PMI, IWI, RES, CAL, TLB and so on. You can see the network interrupts are processed only by the first core/processor. You can change this by setting cpu affinity and to split across all CPU – in most cases you do not need this, because using one core/processor the latency is better, but on a busy server easily could reach 100% busy of the first core and the network packets processing will get in troubles.
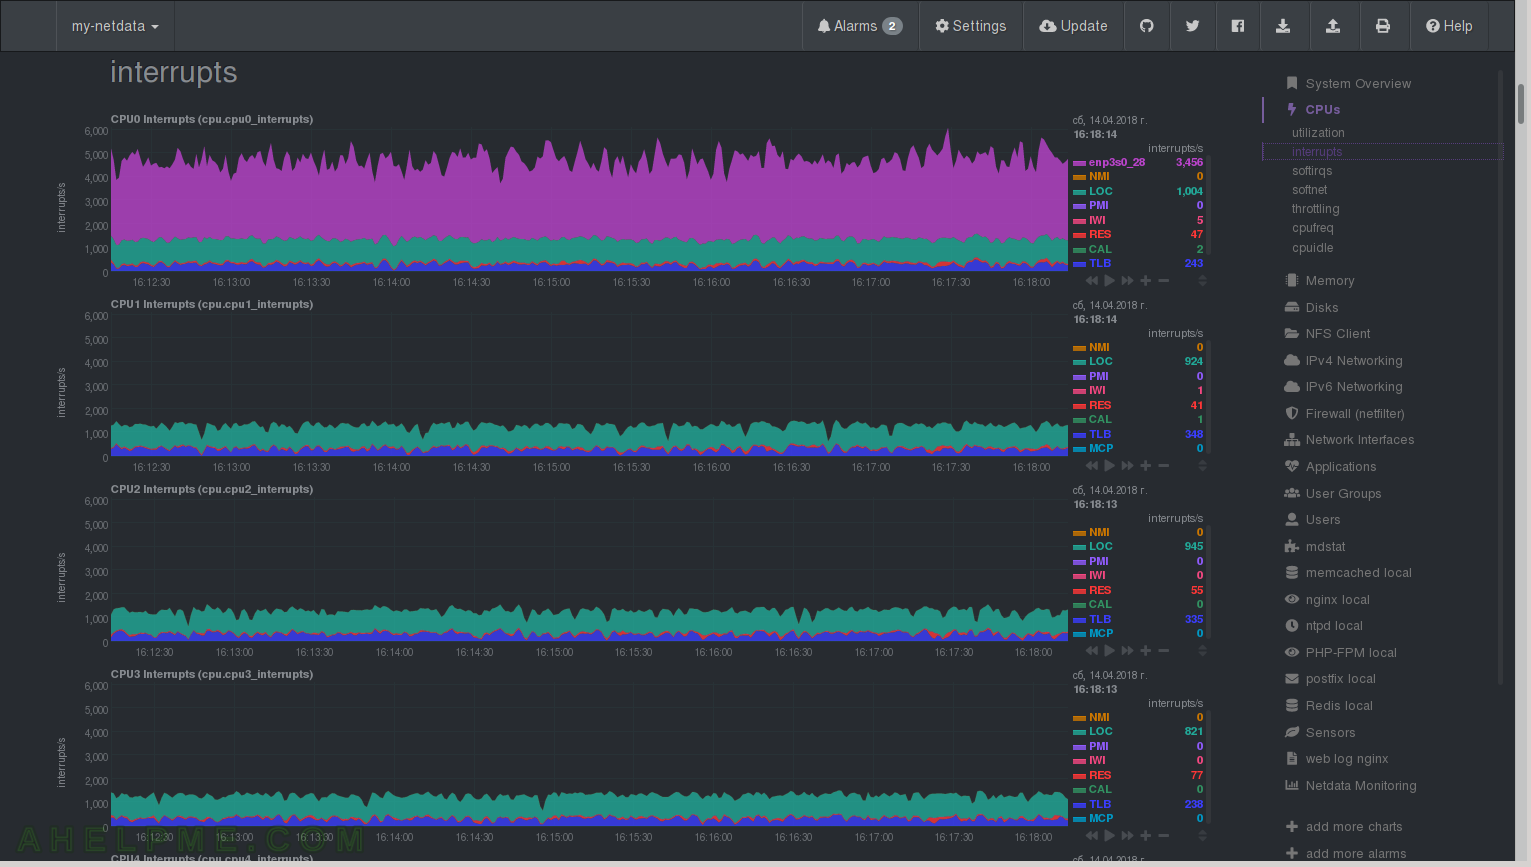
CHART 13) softirqs
Software interrupts – TIMER, NET_TX, NET_RX, TASKLET, SCHED, RCU – network, context switches synchronization and so on.
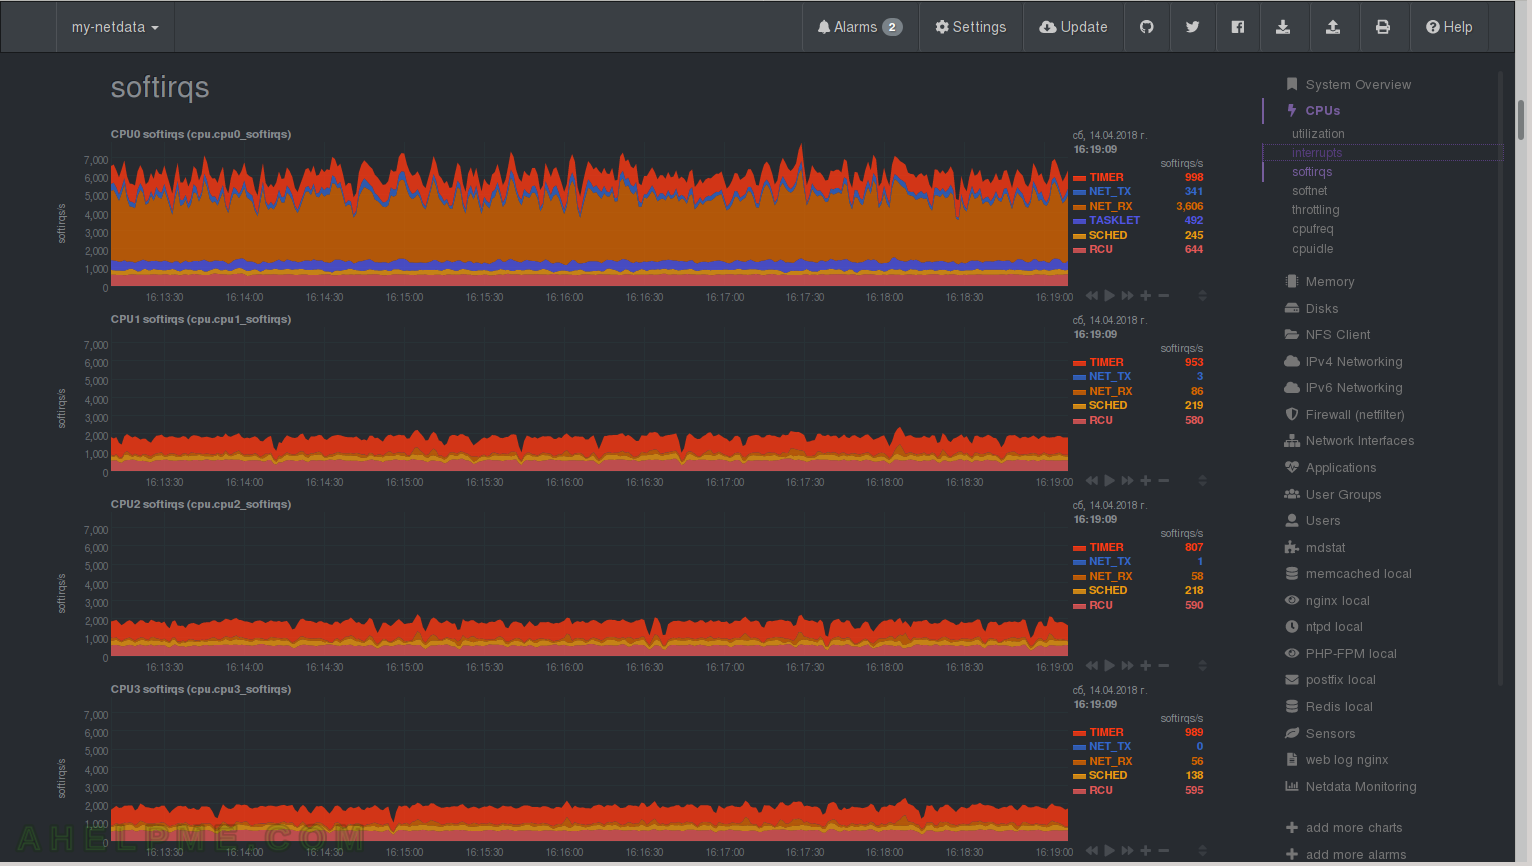
CHART 14) softnet
Quotation netdata: “Statistics for per CPUs core SoftIRQs related to network receive work. Total for all CPU cores can be found at System / softnet statistics. processed states the number of packets processed, dropped is the number packets dropped because the network device backlog was full (to fix them on Linux use sysctl to increase net.core.netdev_max_backlog), squeezed is the number of packets dropped because the network device budget ran out (to fix them on Linux use sysctl to increase net.core.netdev_budget).” You can see how much SoftIRQs related to network receive each CPU. As you can see again the network is processed by the first core/processor.
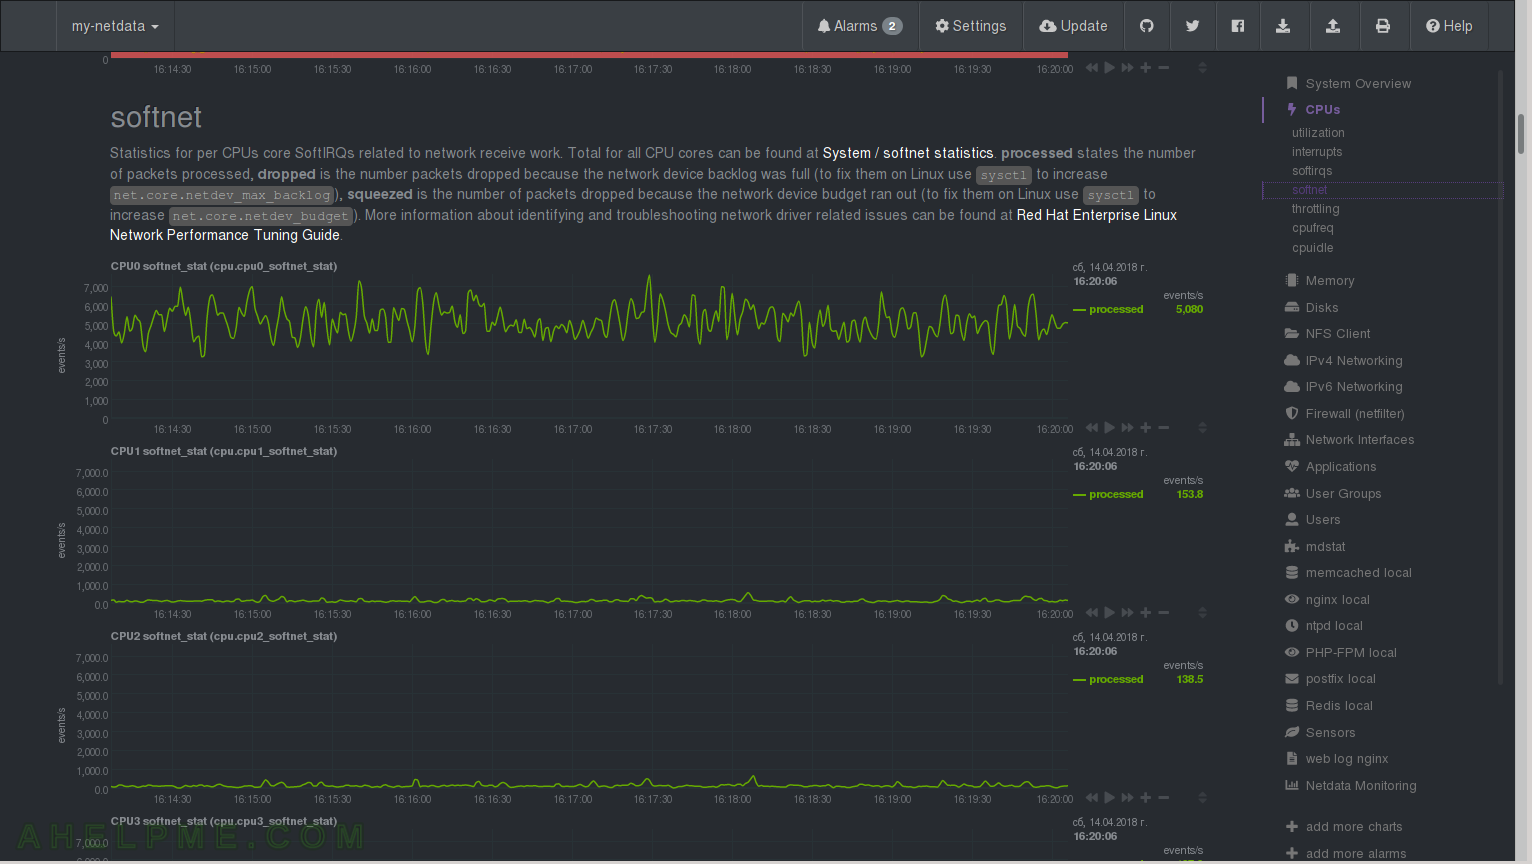
CHART 15) throttling and cpufreq
1) The throttling of the CPU cores if any and 2) cpu frequency changes. If your server is in idle probably you can see more often to get to lower frequency on some cores/processors.

CHART 16) C-state residency for each core/processor.
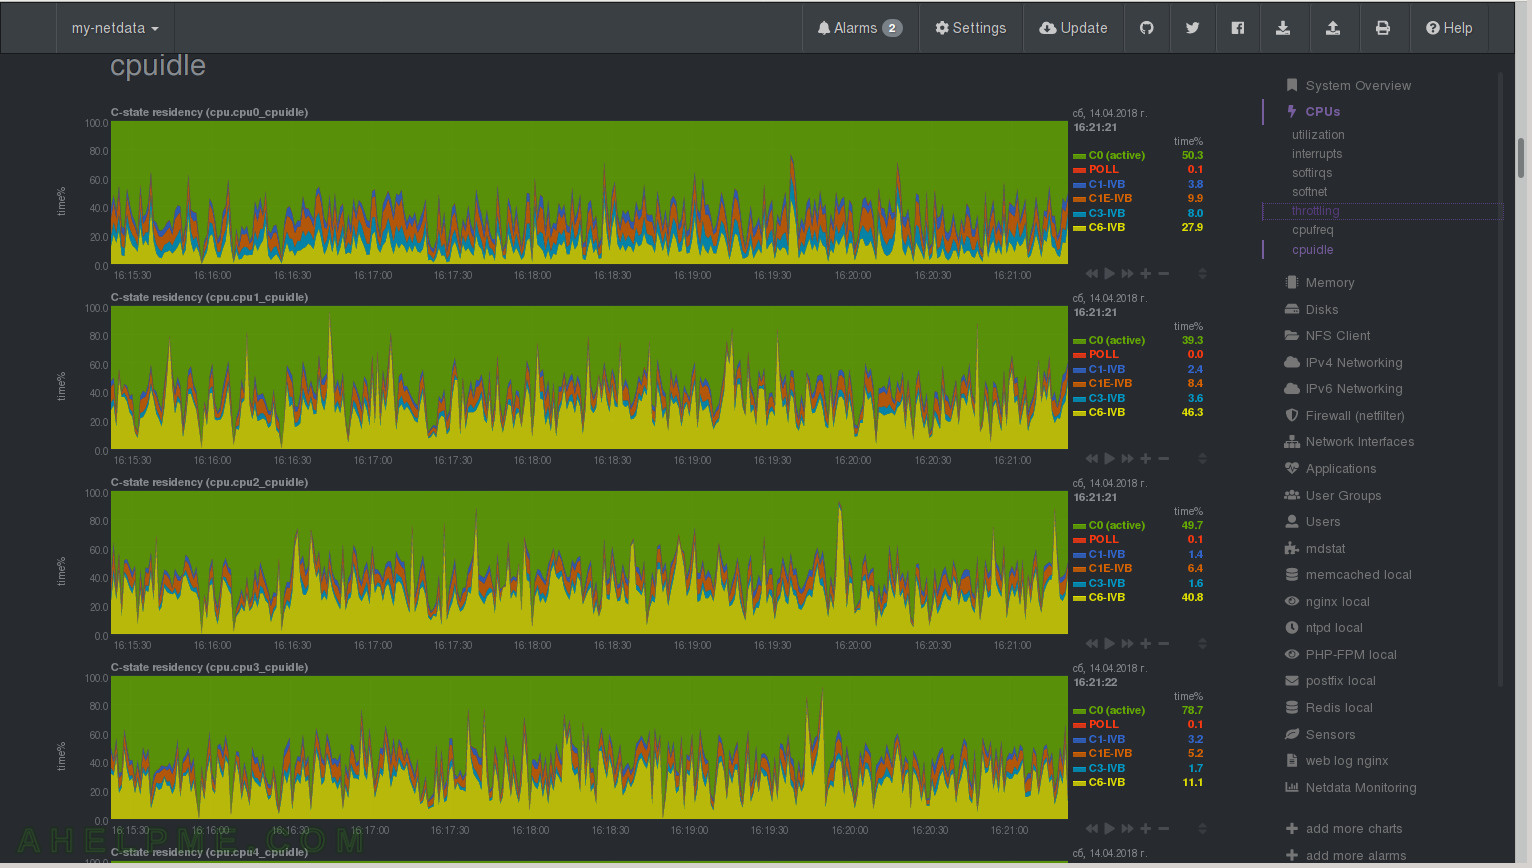
CHART 17) Memory
1) Total available RAM for applications, 2) Commited Memory is the all the memory allocated by processes and 3) page faults – Quotation netdata: “A page fault is a type of interrupt, called trap, raised by computer hardware when a running program accesses a memory page that is mapped into the virtual address space, but not actually loaded into main memory. If the page is loaded in memory at the time the fault is generated, but is not marked in the memory management unit as being loaded in memory, then it is called a minor or soft page fault. A major page fault is generated when the system needs to load the memory page from disk or swap memory.”
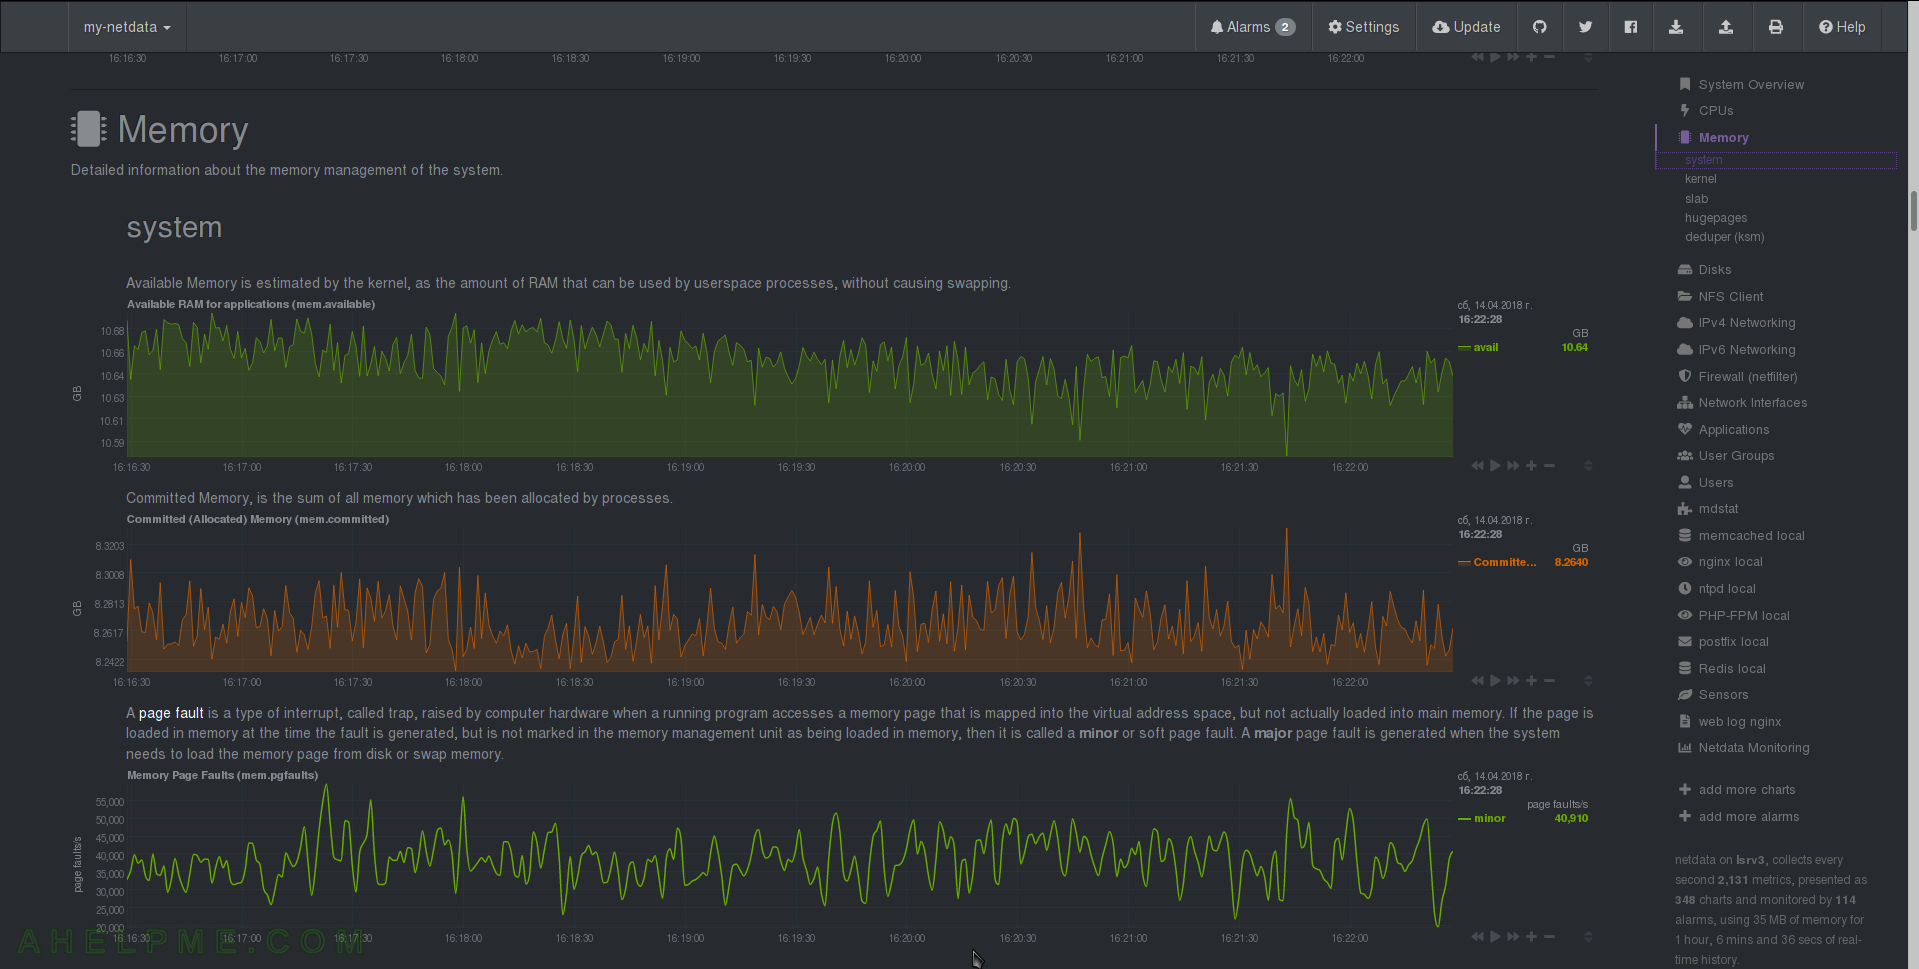
CHART 18) Kernel and Swap memory
1) Quotation netdata: “Dirty is the amount of memory waiting to be written to disk. Writeback is how much memory is actively being written to disk.” – you can tune kernel to how much dirty memory to hold. 2) Memory used by kernel – netdata Quotation: “The total amount of memory being used by the kernel. Slab is the amount of memory used by the kernel to cache data structures for its own use. KernelStack is the amount of memory allocated for each task done by the kernel. PageTables is the amount of memory dedicated to the lowest level of page tables (A page table is used to turn a virtual address into a physical memory address). VmallocUsed is the amount of memory being used as virtual address space.” 3) slab – netdata Quotation: “Reclaimable is the amount of memory which the kernel can reuse. Unreclaimable can not be reused even when the kernel is lacking memory.”
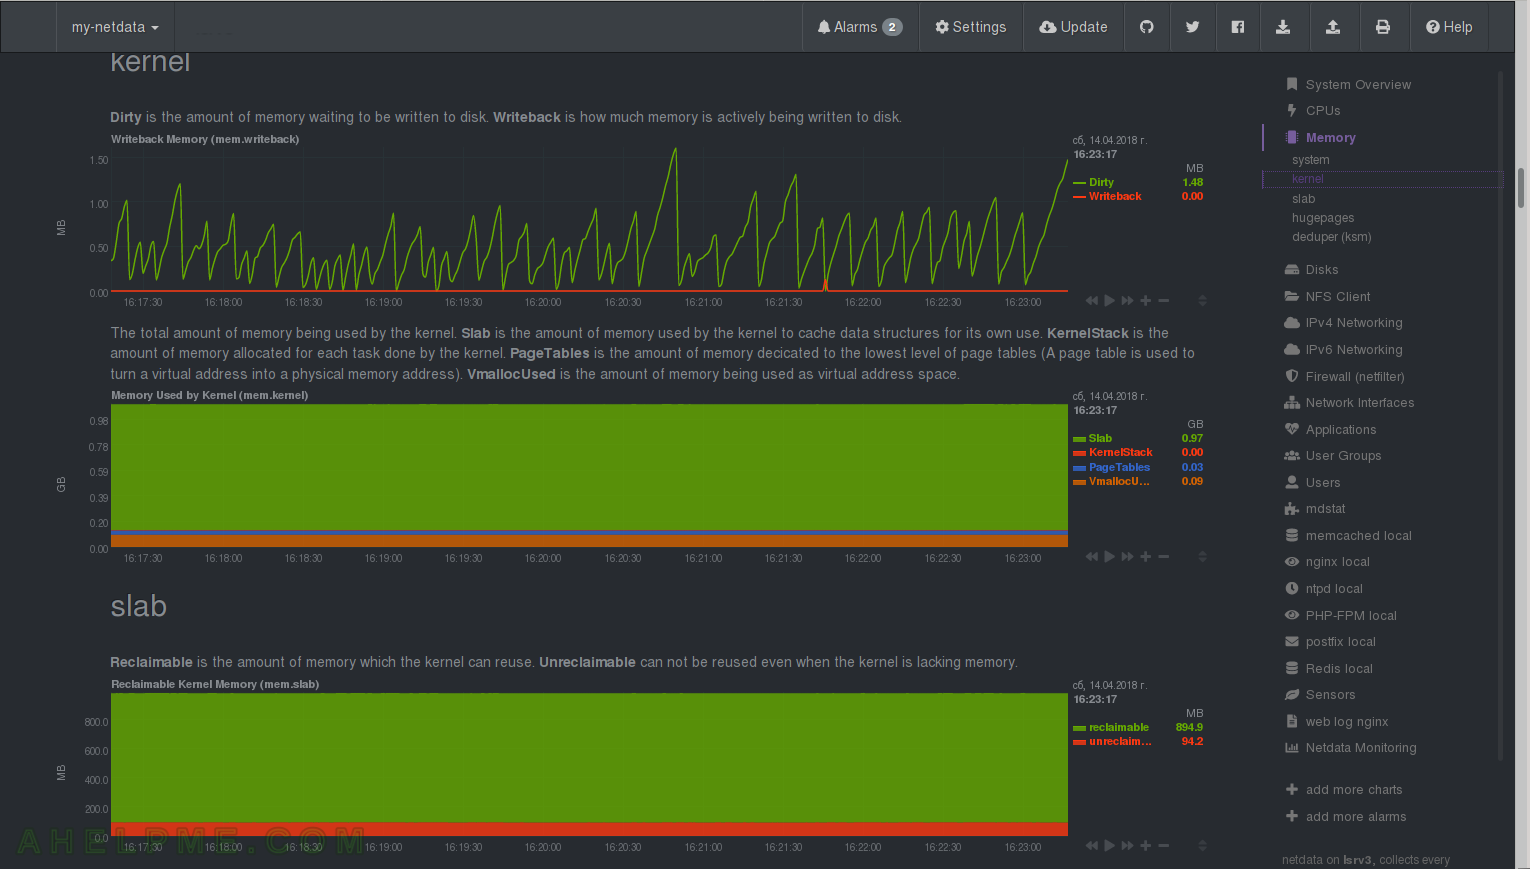
CHART 19) Hugepages
netdata Quotation: “Hugepages is a feature that allows the kernel to utilize the multiple page size capabilities of modern hardware architectures. The kernel creates multiple pages of virtual memory, mapped from both physical RAM and swap. There is a mechanism in the CPU architecture called “Translation Lookaside Buffers” (TLB) to manage the mapping of virtual memory pages to actual physical memory addresses. The TLB is a limited hardware resource, so utilizing a large amount of physical memory with the default page size consumes the TLB and adds processing overhead. By utilizing Huge Pages, the kernel is able to create pages of much larger sizes, each page consuming a single resource in the TLB. Huge Pages are pinned to physical RAM and cannot be swapped/paged out.”
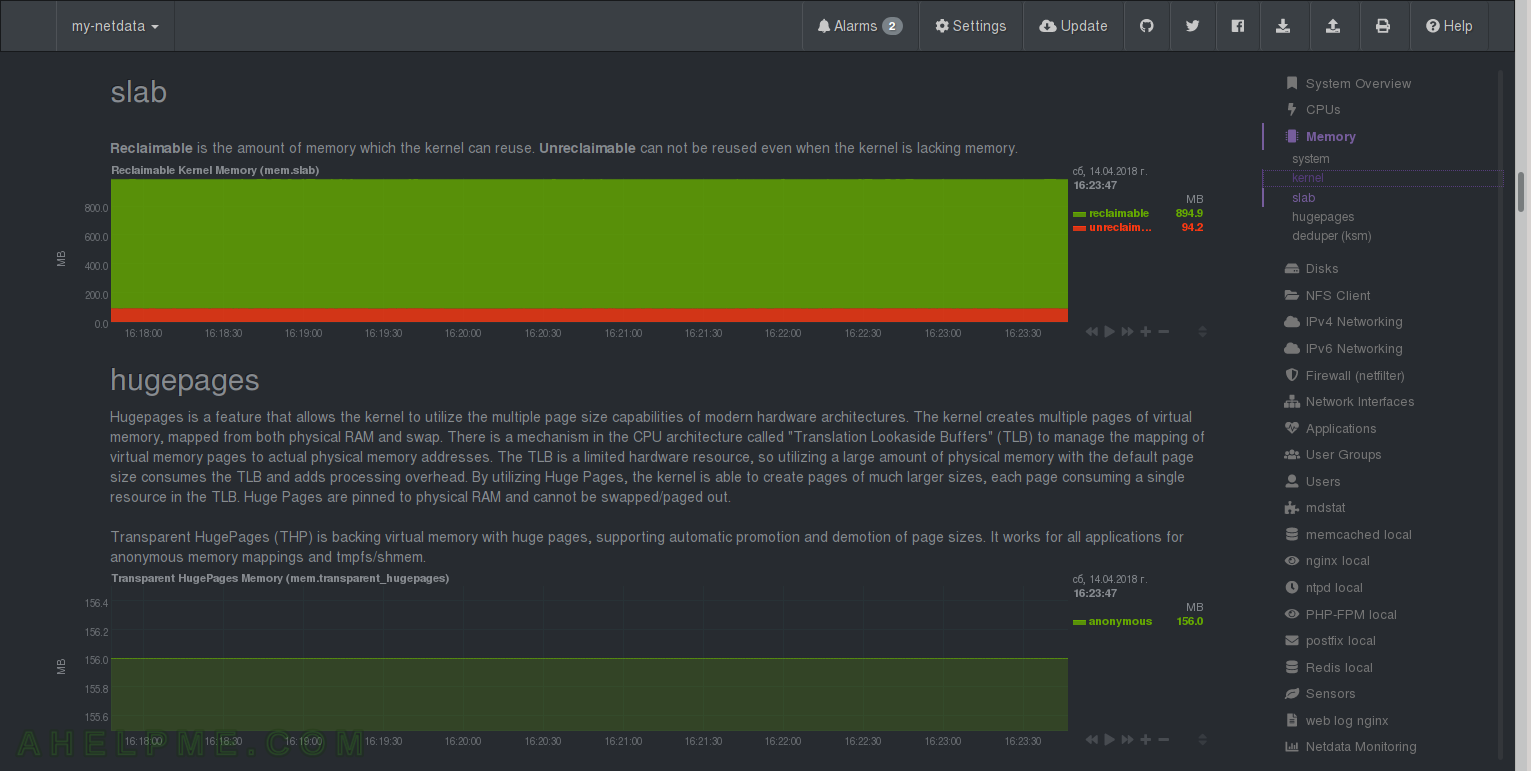
CHART 20) deduper (ksm)
You can save some RAM with this feature. netdata Quotation: “Kernel Same-page Merging (KSM) performance monitoring, read from several files in /sys/kernel/mm/ksm/. KSM is a memory-saving de-duplication feature in the Linux kernel (since version 2.6.32). The KSM daemon ksmd periodically scans those areas of user memory which have been registered with it, looking for pages of identical content which can be replaced by a single write-protected page (which is automatically copied if a process later wants to update its content). KSM was originally developed for use with KVM (where it was known as Kernel Shared Memory), to fit more virtual machines into physical memory, by sharing the data common between them. But it can be useful to any application which generates many instances of the same data.”
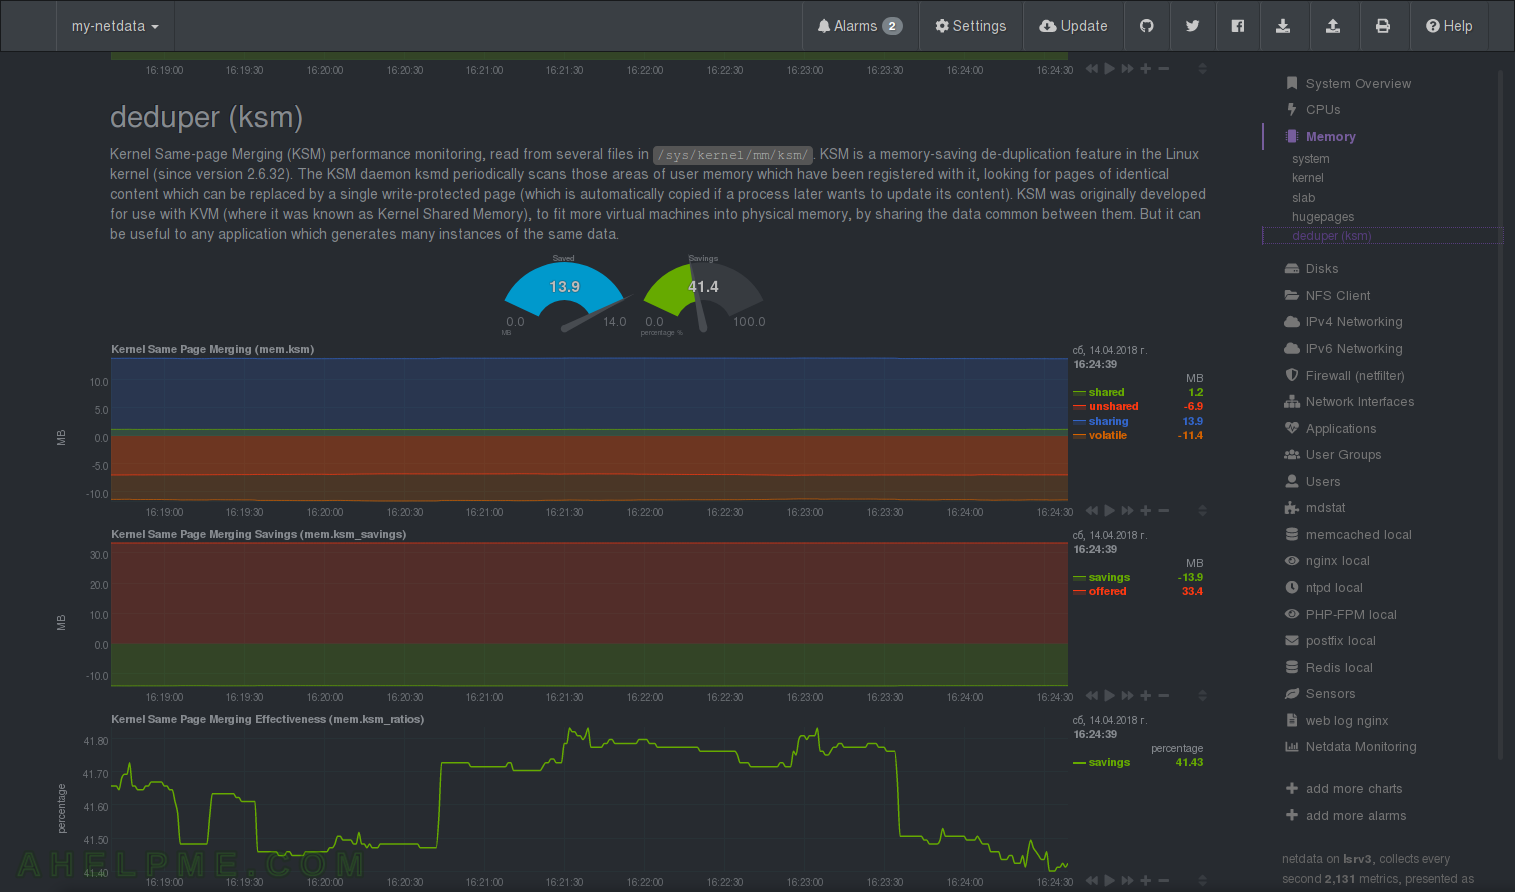
CHART 21) Charts with the performance of the disks and disk devices like raids – charts for every device in the system. Most important charts here are the disk utilization where you can see how busy is your device!
1) The disk I/O Bandwidth – Amount of data transferred to and from disk – “md2”. 2) Disk Completed I/O operations – netdata Quotation: “Completed disk I/O operations. Keep in mind the number of operations requested might be higher, since the system is able to merge adjacent to each other (see merged operations chart).”
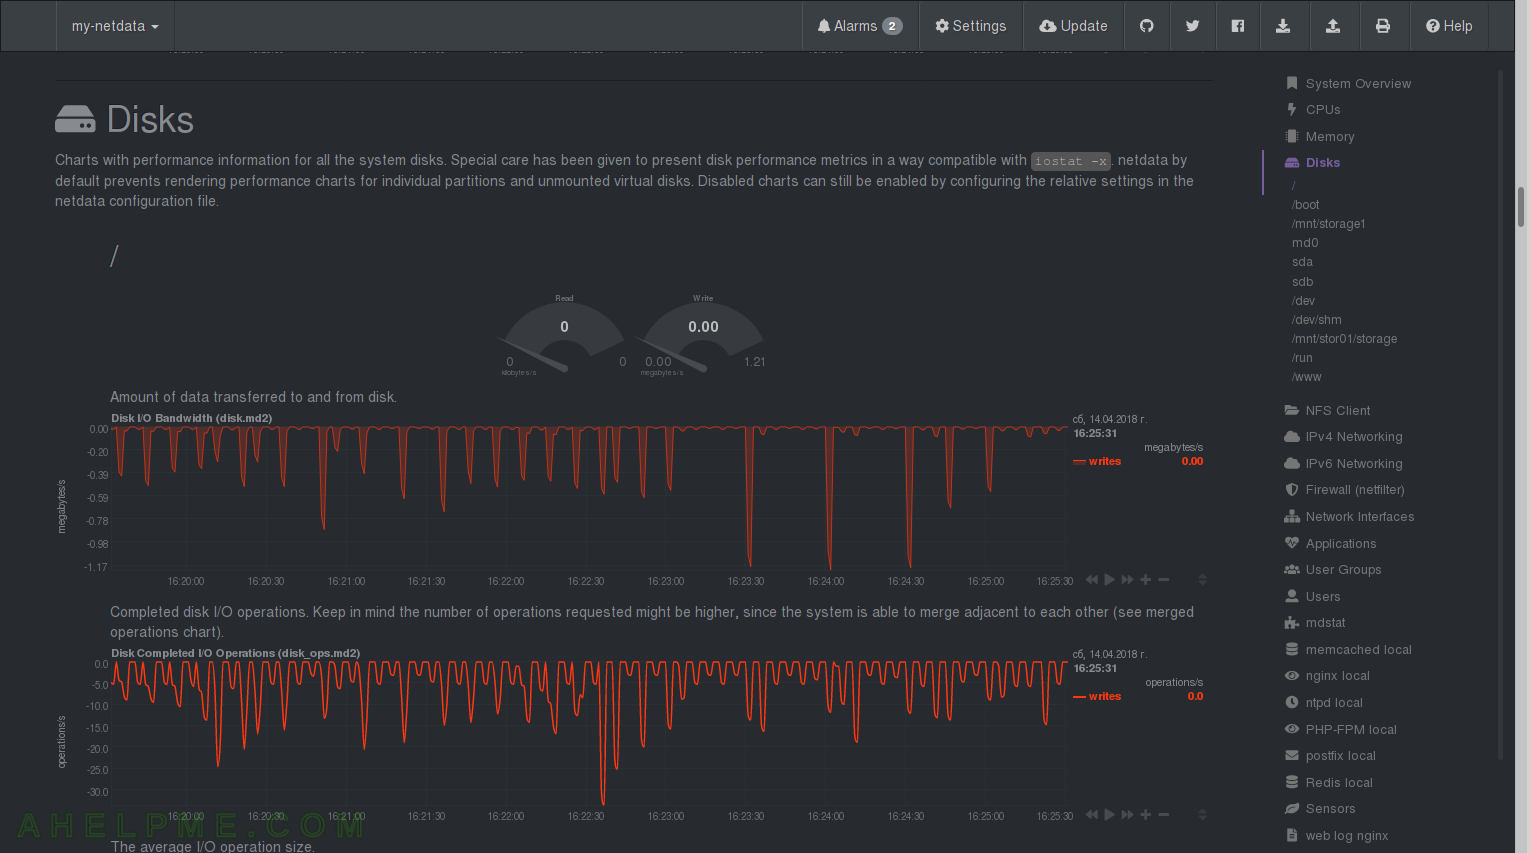
CHART 22) Disk I/O
1) The average I/O Operations size of device “md2”, 2) Disk space utilization of device “md2” and 3) inodes usage of device “md2”.
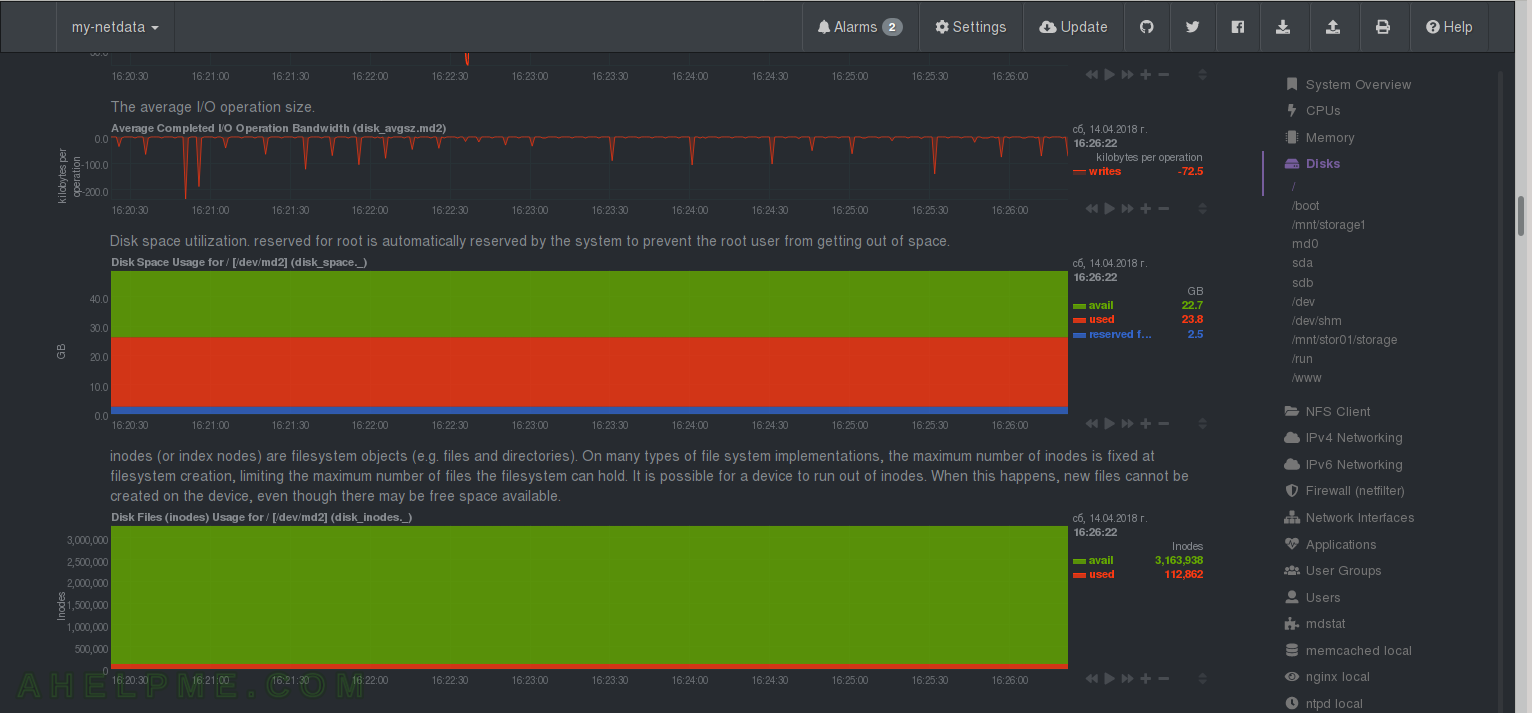
CHART 23) Disk I/O of md0
1) Disk I/O Bandwidth, 2) Disk Completed I/O Operations, 3) The average I/O Operations
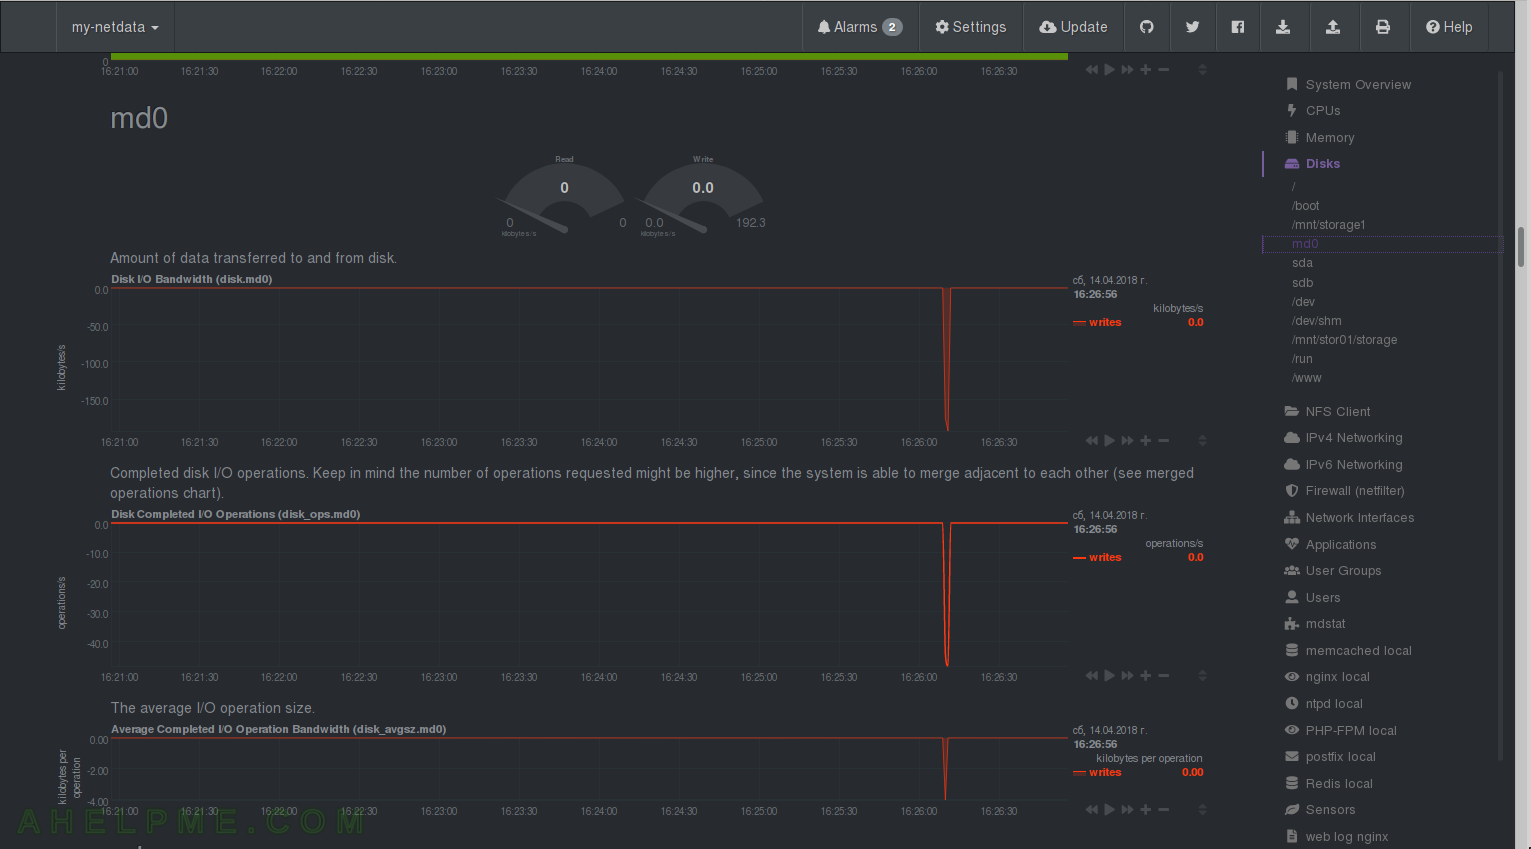
CHART 24) Disk I/O of sda
1) Disk I/O Bandwidth, 2) Disk Completed I/O Operations, 3) Disk current I/O Operations
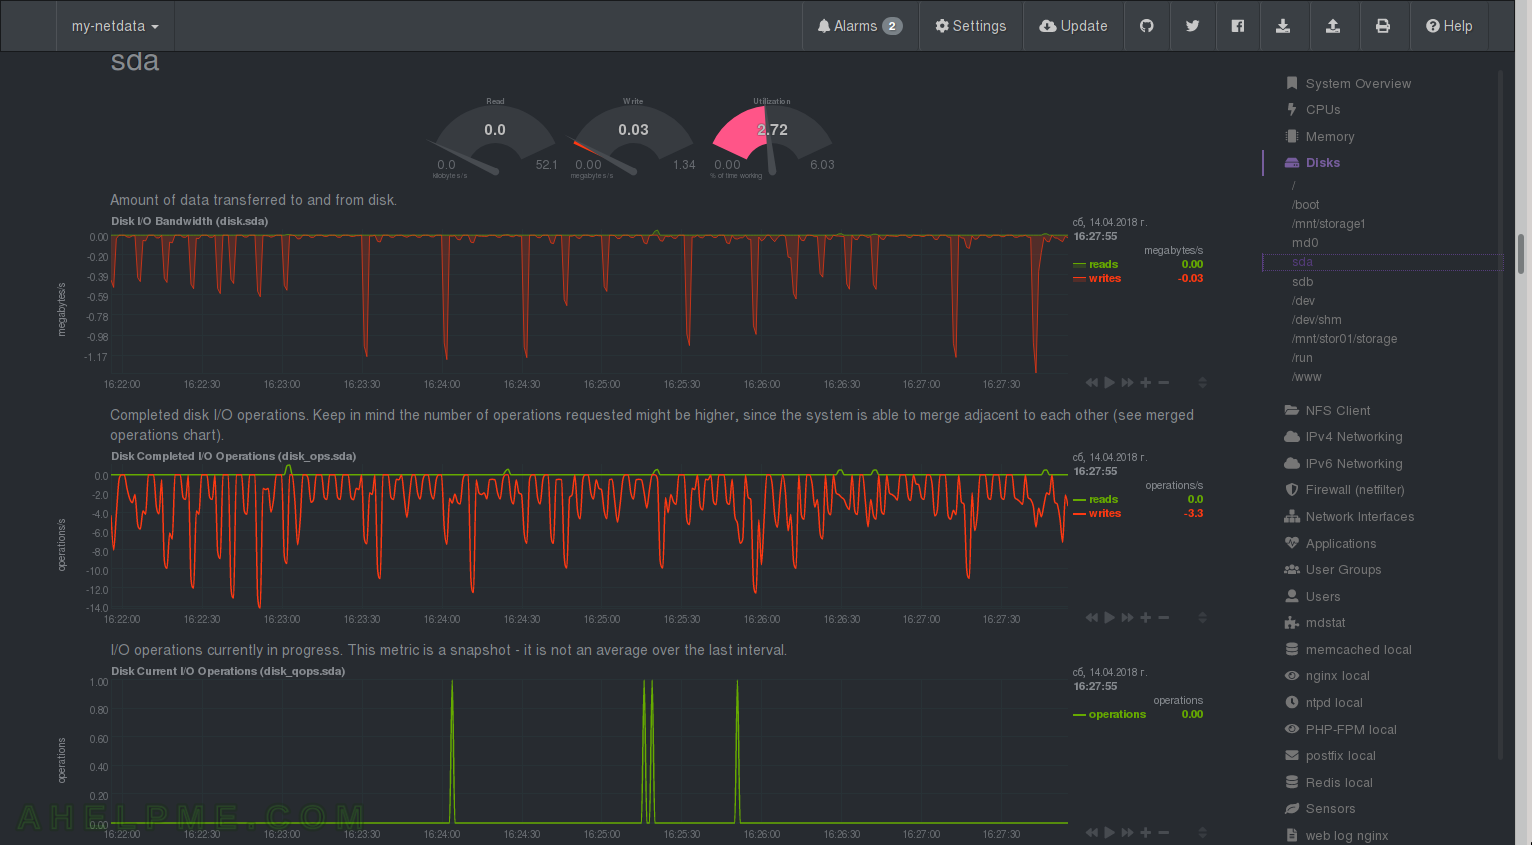
CHART 25) Disk I/O of sda 2
1) Backlog – netdata Quotation: “Backlog is an indication of the duration of pending disk operations. On every I/O event the system is multiplying the time spent doing I/O since the last update of this field with the number of pending operations. While not accurate, this metric can provide an indication of the expected completion time of the operations in progress.”, 2) Disk Utilization Time – one of the most important charts, you can see if you disk is saturated, netdata Quotation: “Disk Utilization measures the amount of time the disk was busy with something. This is not related to its performance. 100% means that the system always had an outstanding operation on the disk. Keep in mind that depending on the underlying technology of the disk, 100% here may or may not be an indication of congestion.” 3) Average Completed I/O Operation Time 4) Average Completed I/O Operation Time
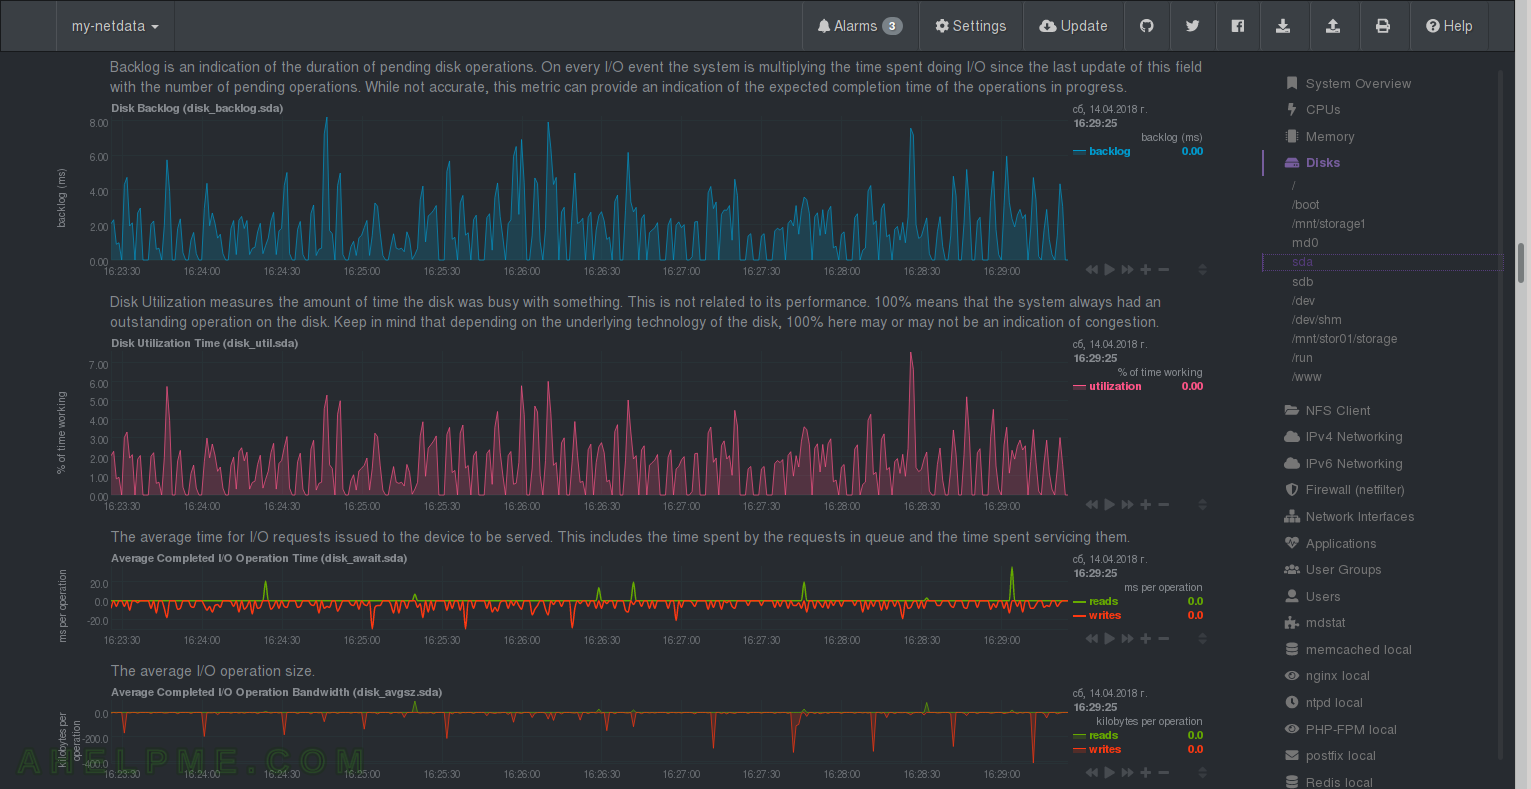
CHART 26) Disk I/O of sda 3
1) netdata Quotation: “The average service time for completed I/O operations. This metric is calculated using the total busy time of the disk and the number of completed operations. If the disk is able to execute multiple parallel operations the reporting average service time will be misleading.” 2) netdata Quotation: “The number of merged disk operations. The system is able to merge adjacent I/O operations, for example two 4KB reads can become one 8KB read before given to disk.” 3) netdata Quotation: “The sum of the duration of all completed I/O operations. This number can exceed the interval if the disk is able to execute I/O operations in parallel.”
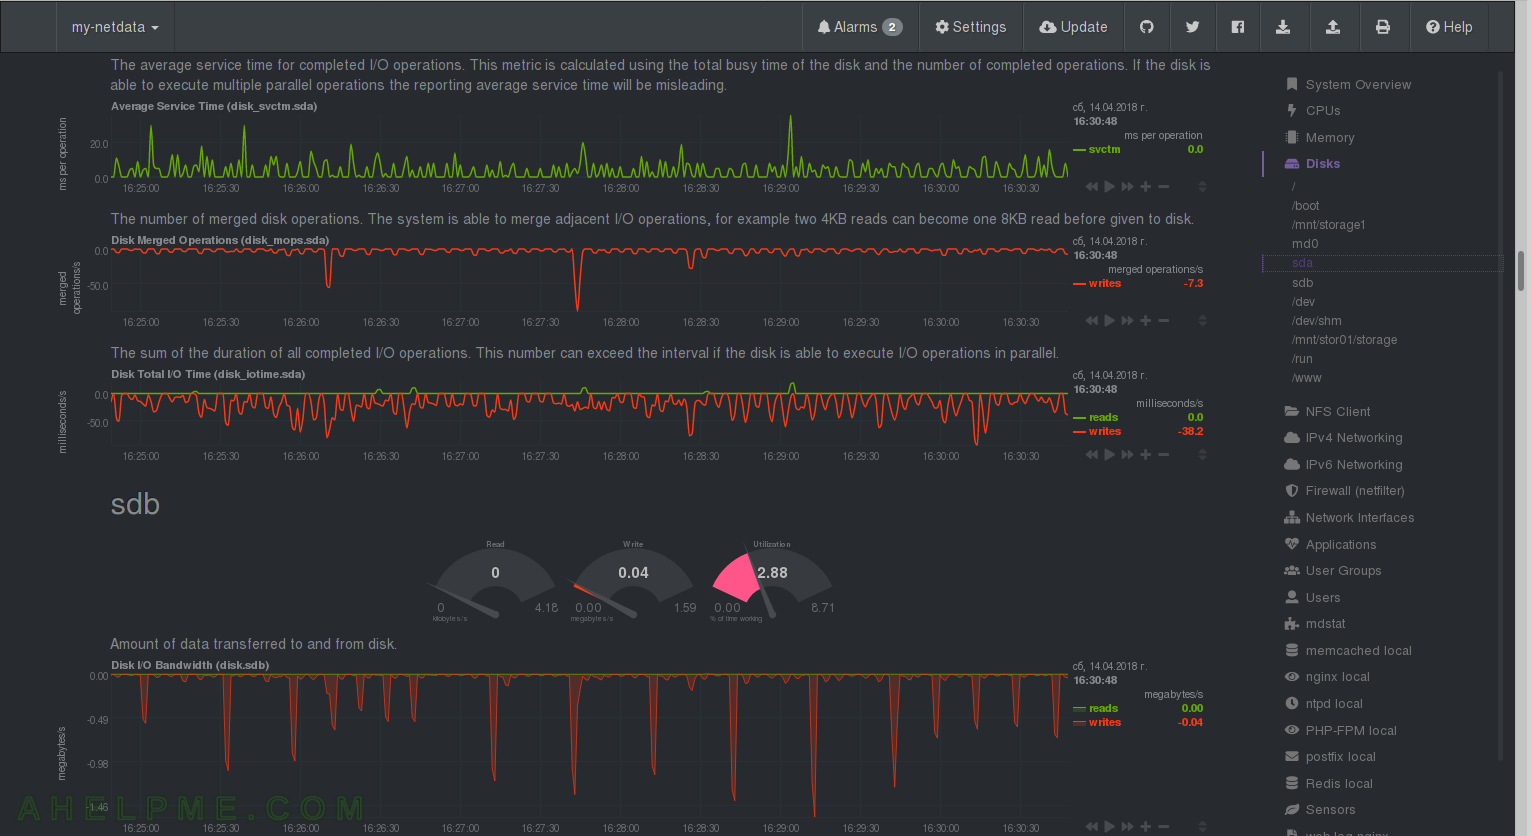
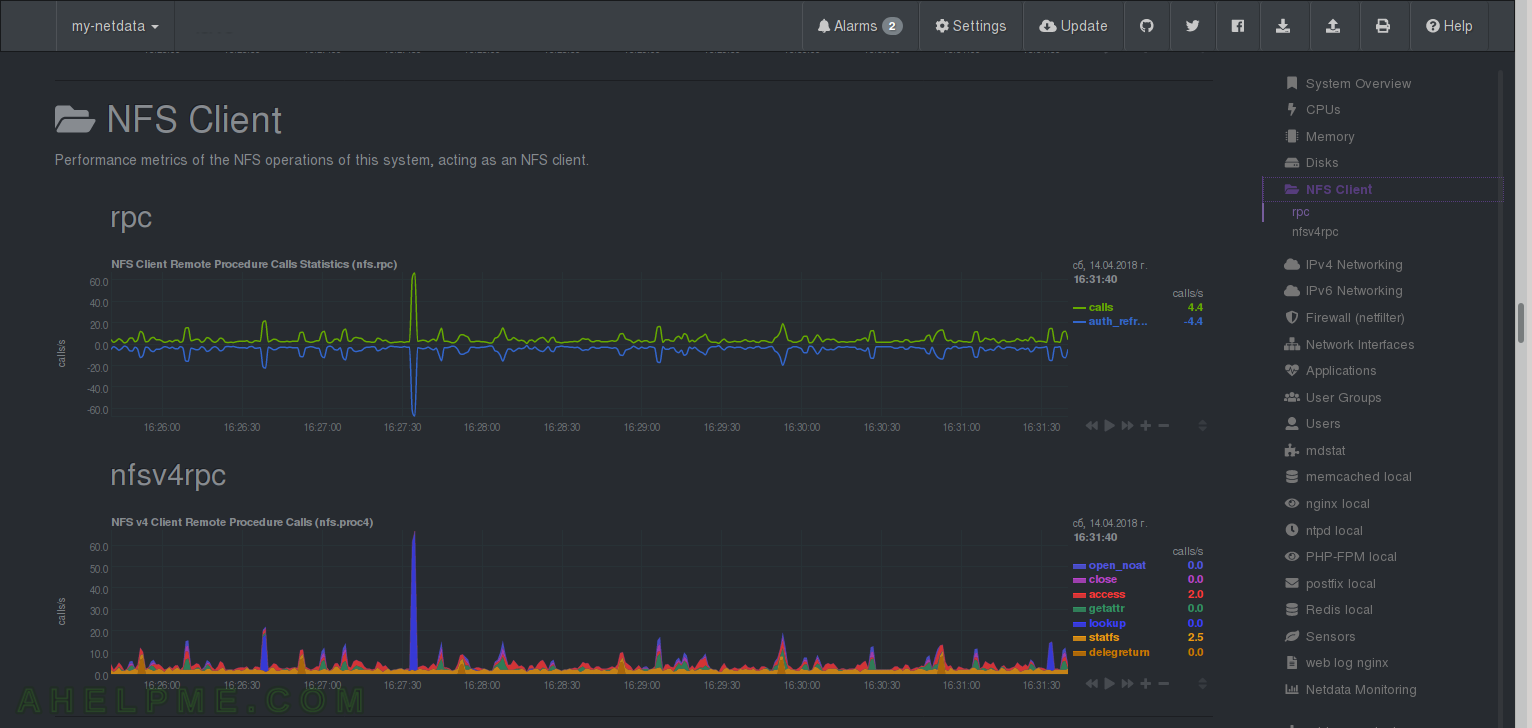
CHART 27) Performance statistics for a NFS client working on the system.
1) RPC – calls per second, 2) What kind of RPC calls and how many of them.
One thought on “Review of netdata graphs – system overview, cpu, memory, disks and nfs”