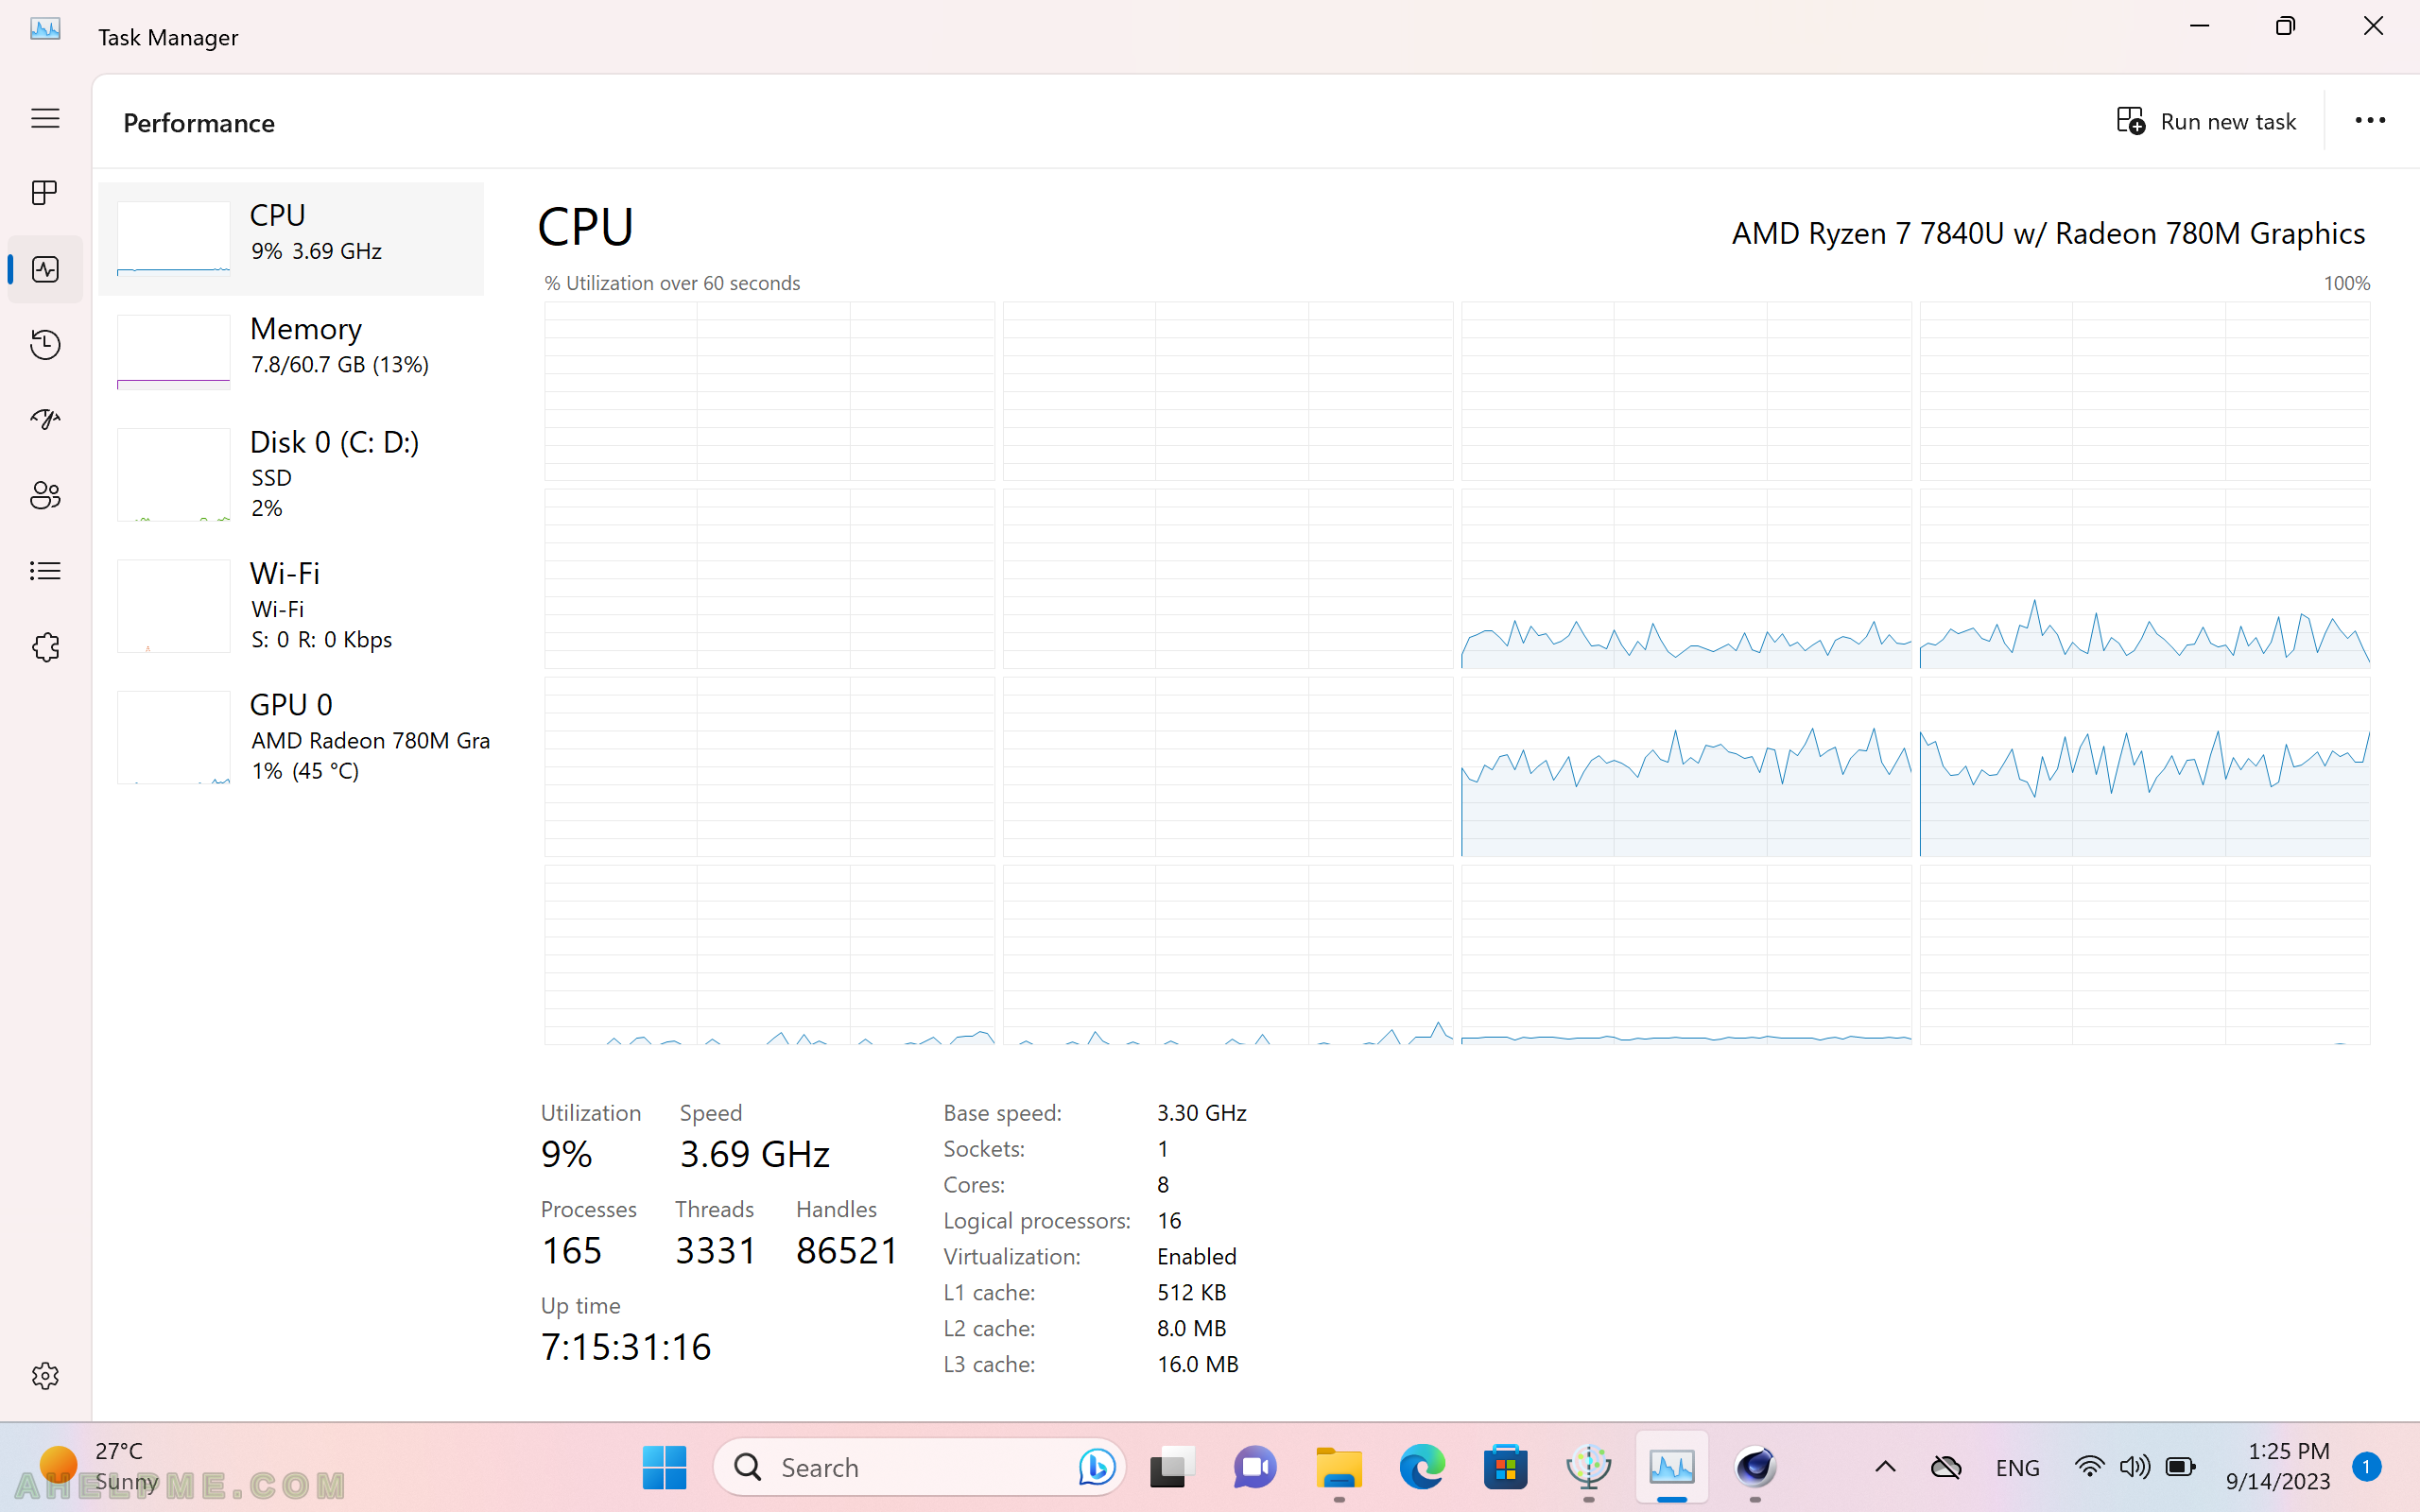
SCREENSHOT 41) The task manager shows all cores are used, but with limited CPU speed of 3.52 GHz.
The system utilization is only 100% and the CPU temperature is just 73.8’C. Less temperature but with load noise from the FAN. The system is limited to the base clock on all cores.
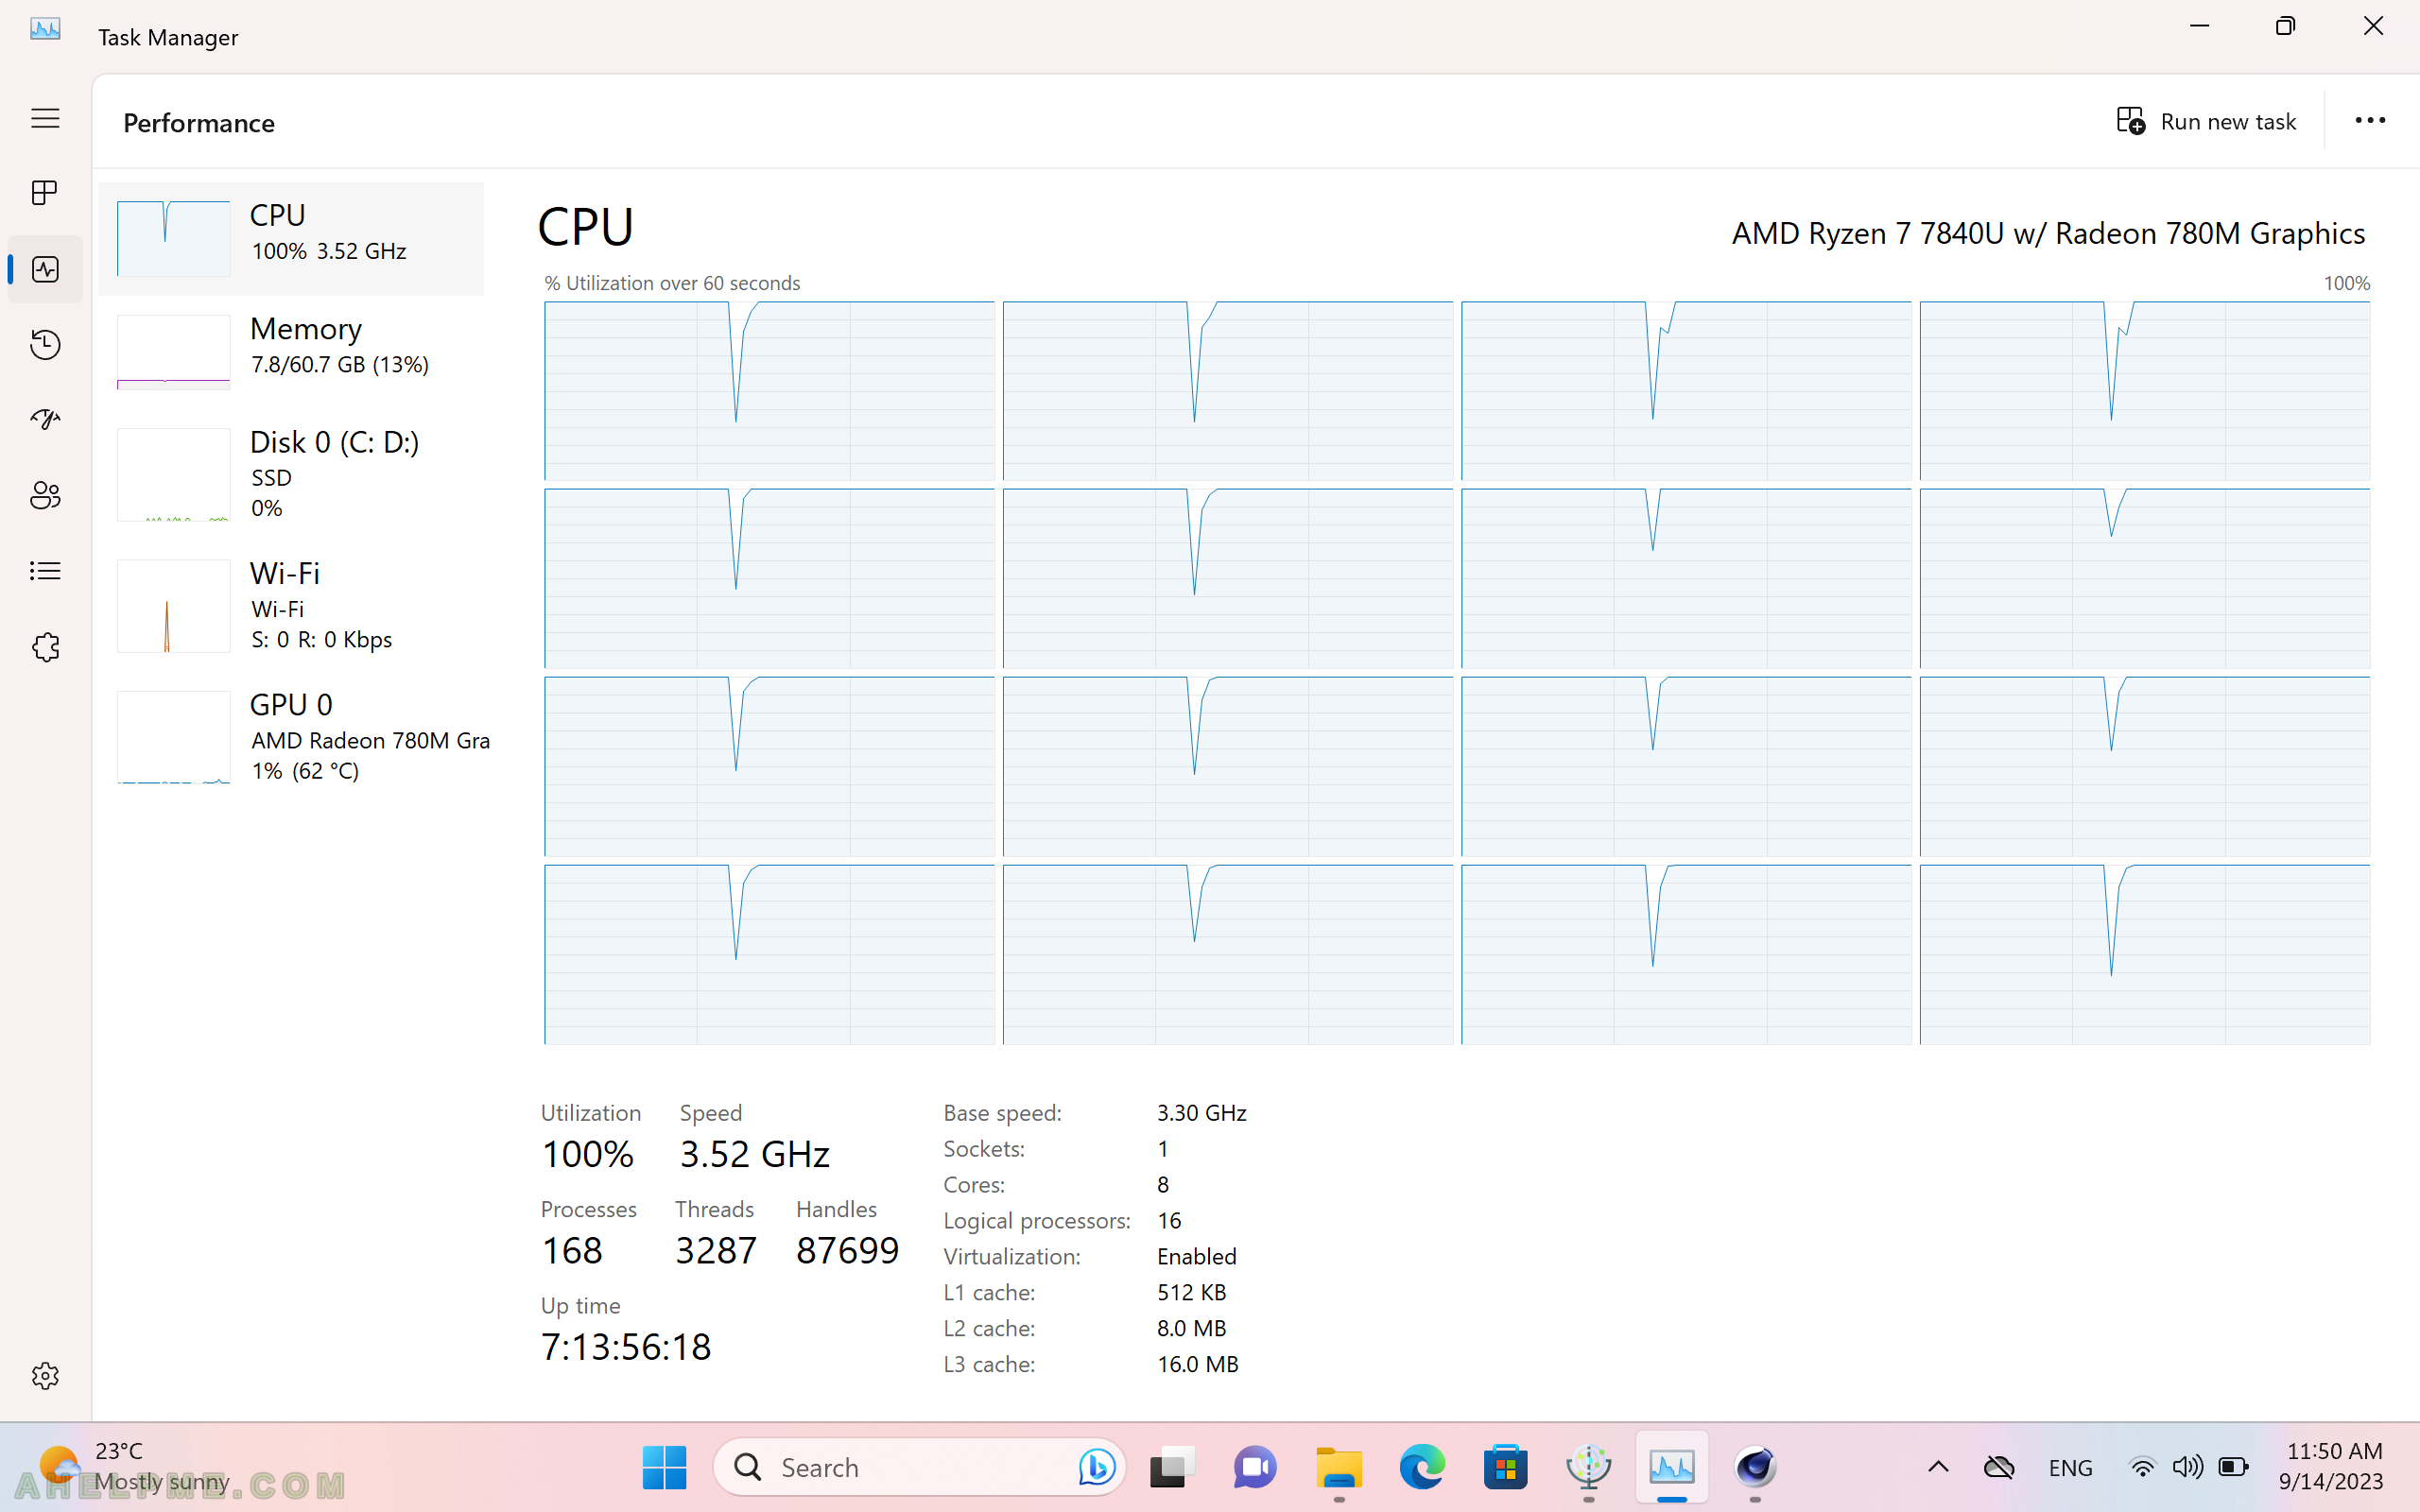
SCREENSHOT 42) The Cinebench r23 28 watts TDP limit multi core test points are 13039.
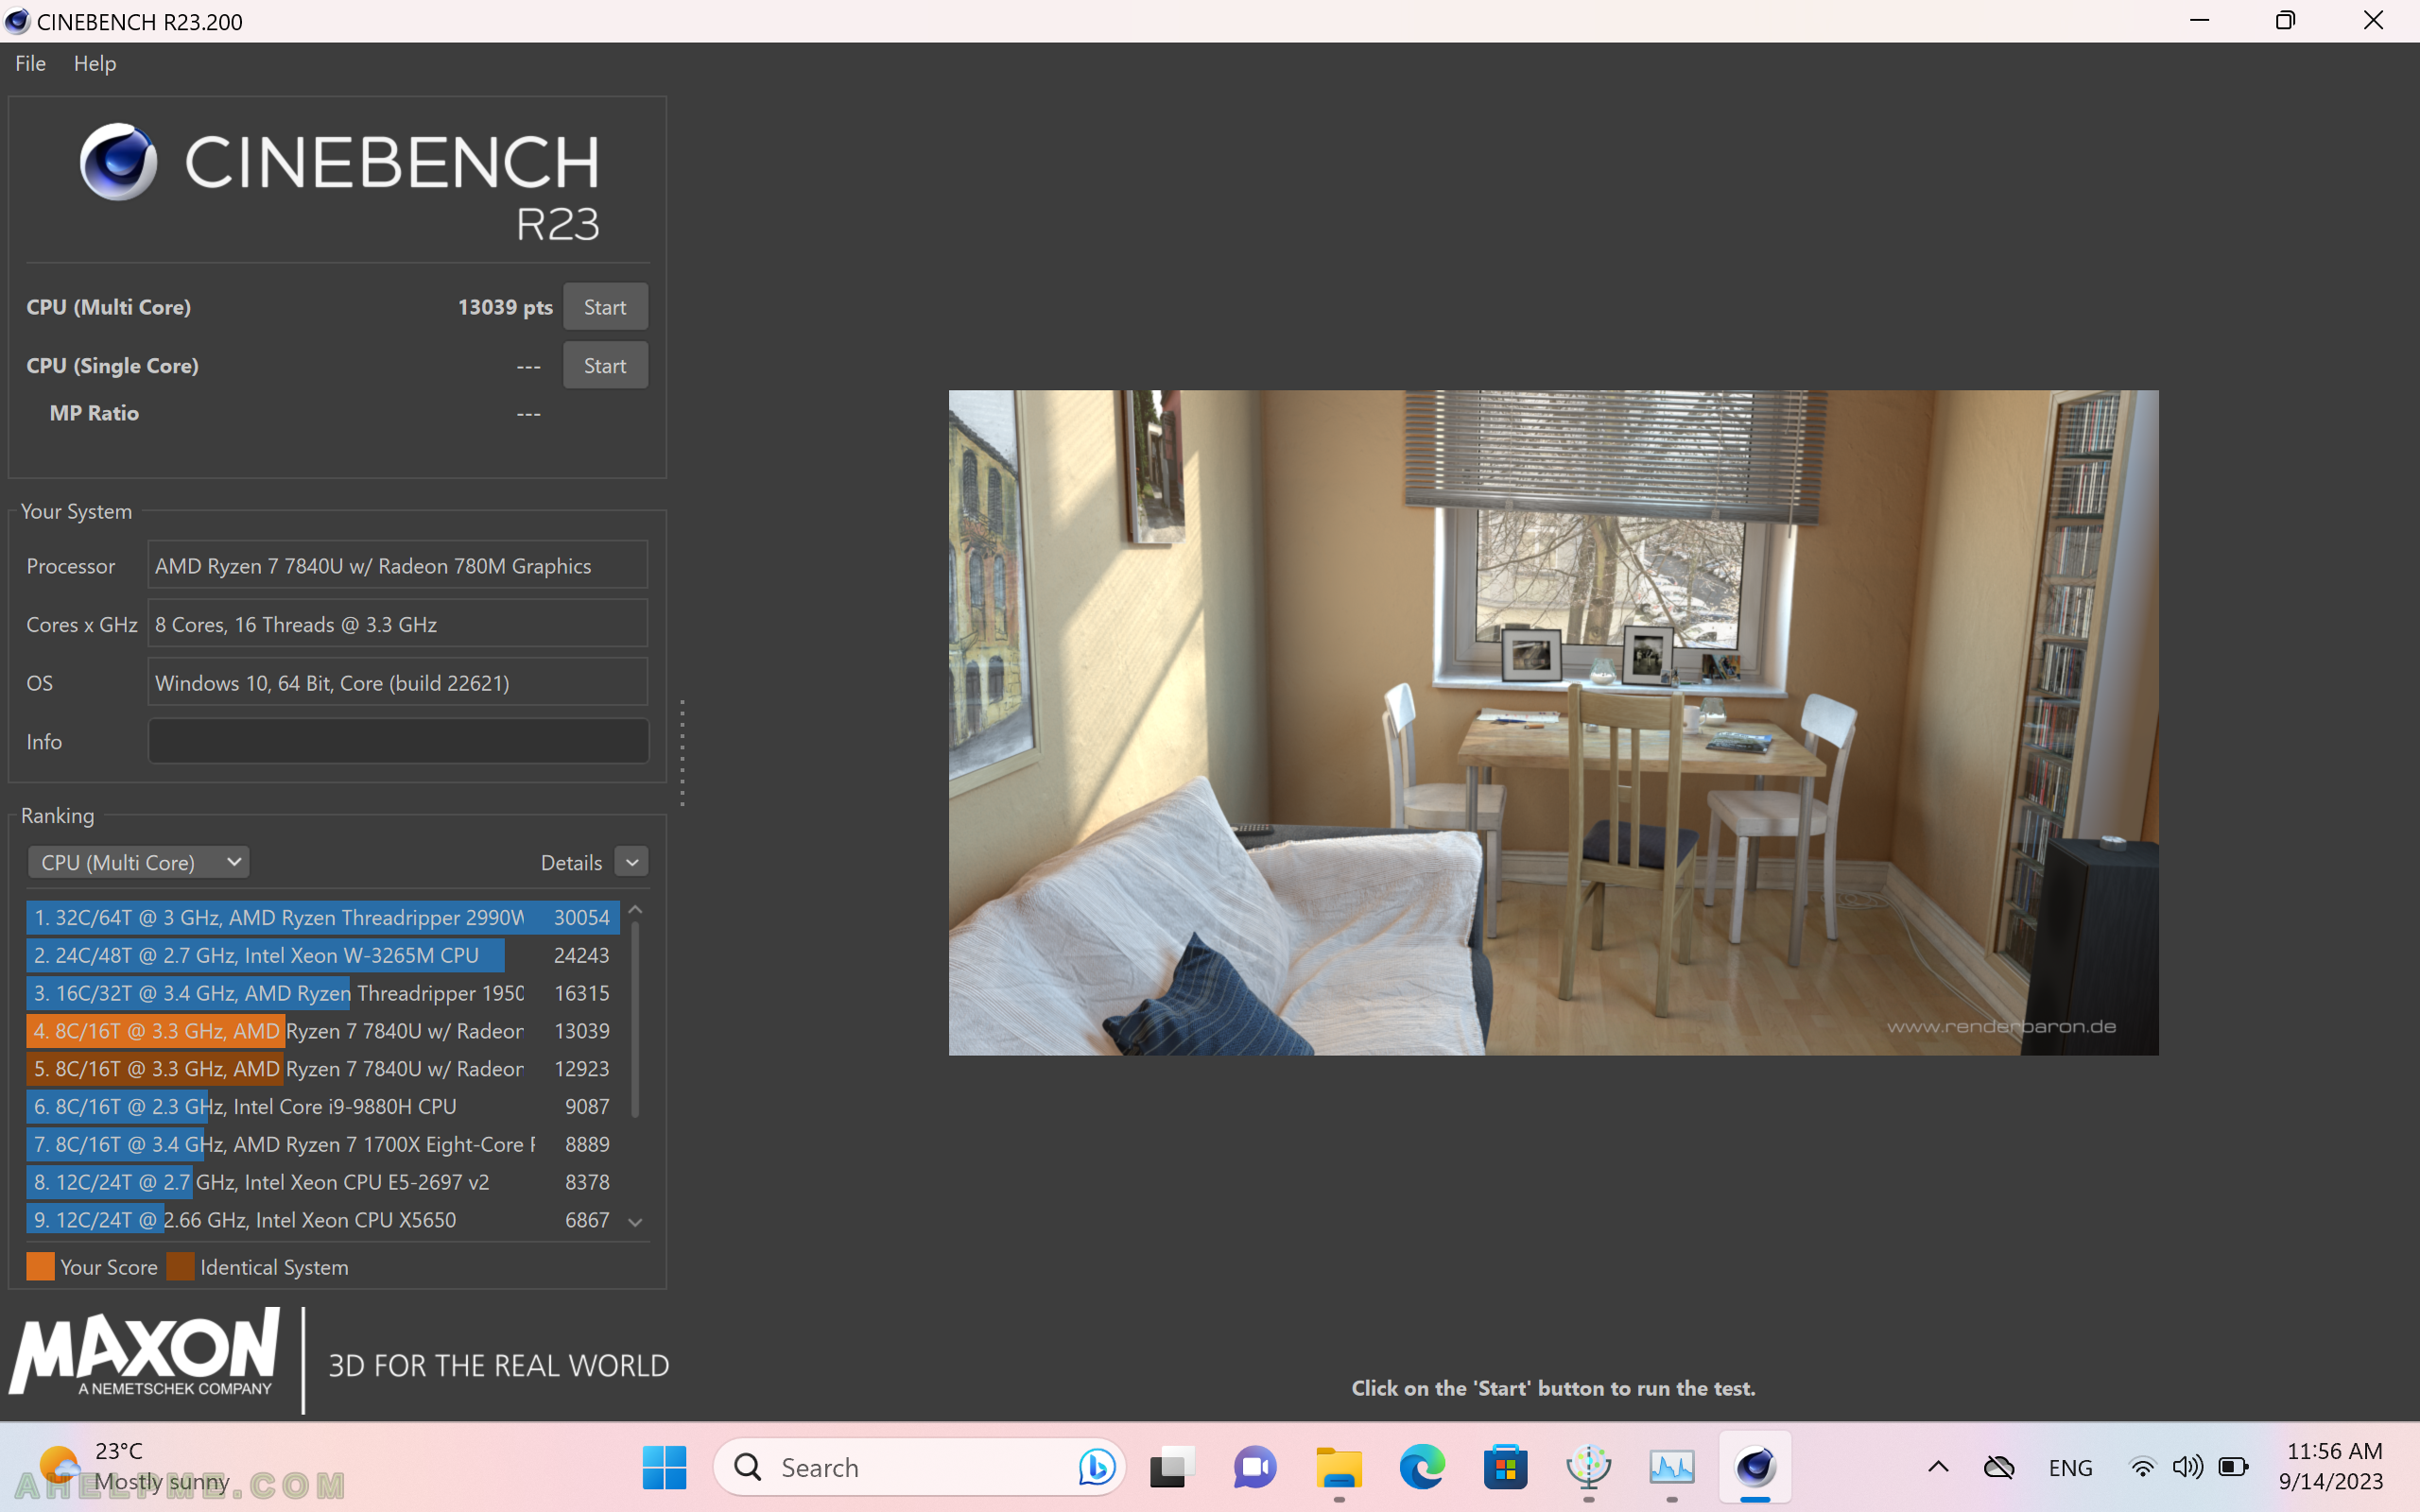
SCREENSHOT 43) 28 watts TDP limit single core test with no FAN noise (2403 rpm) and CPU temperature 50.4’C.
No real change since 5 watts. No FAN noise.
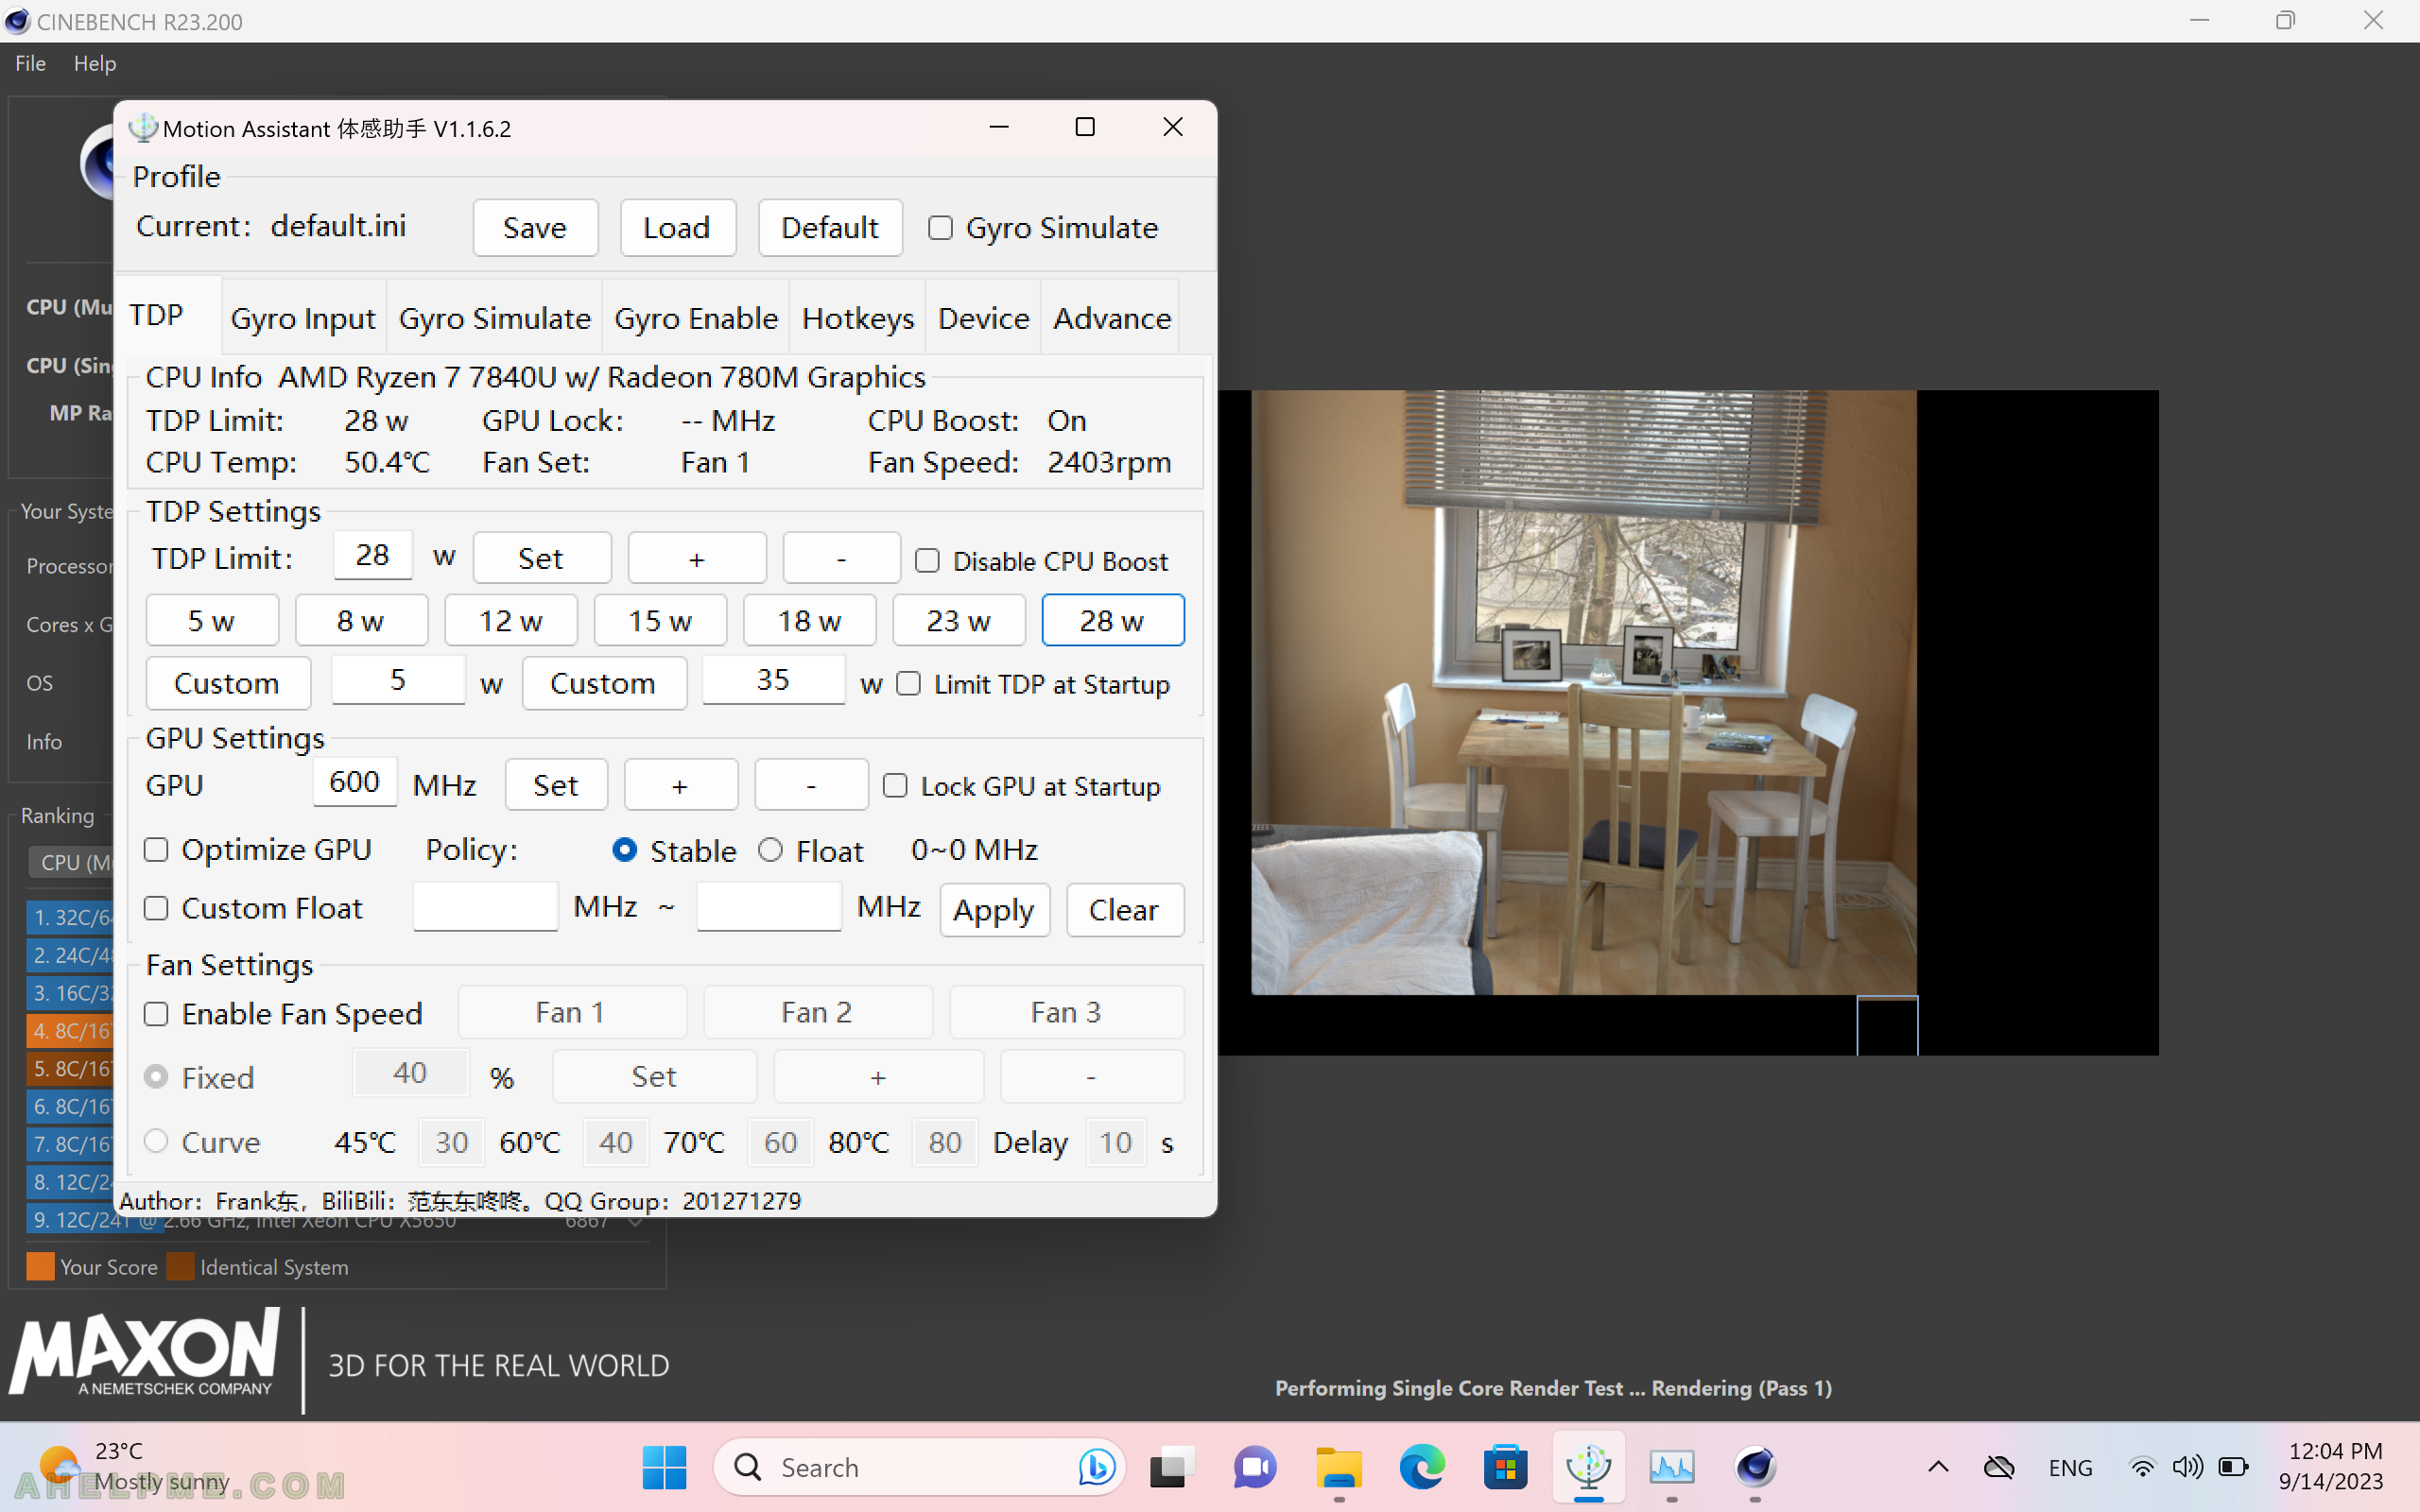
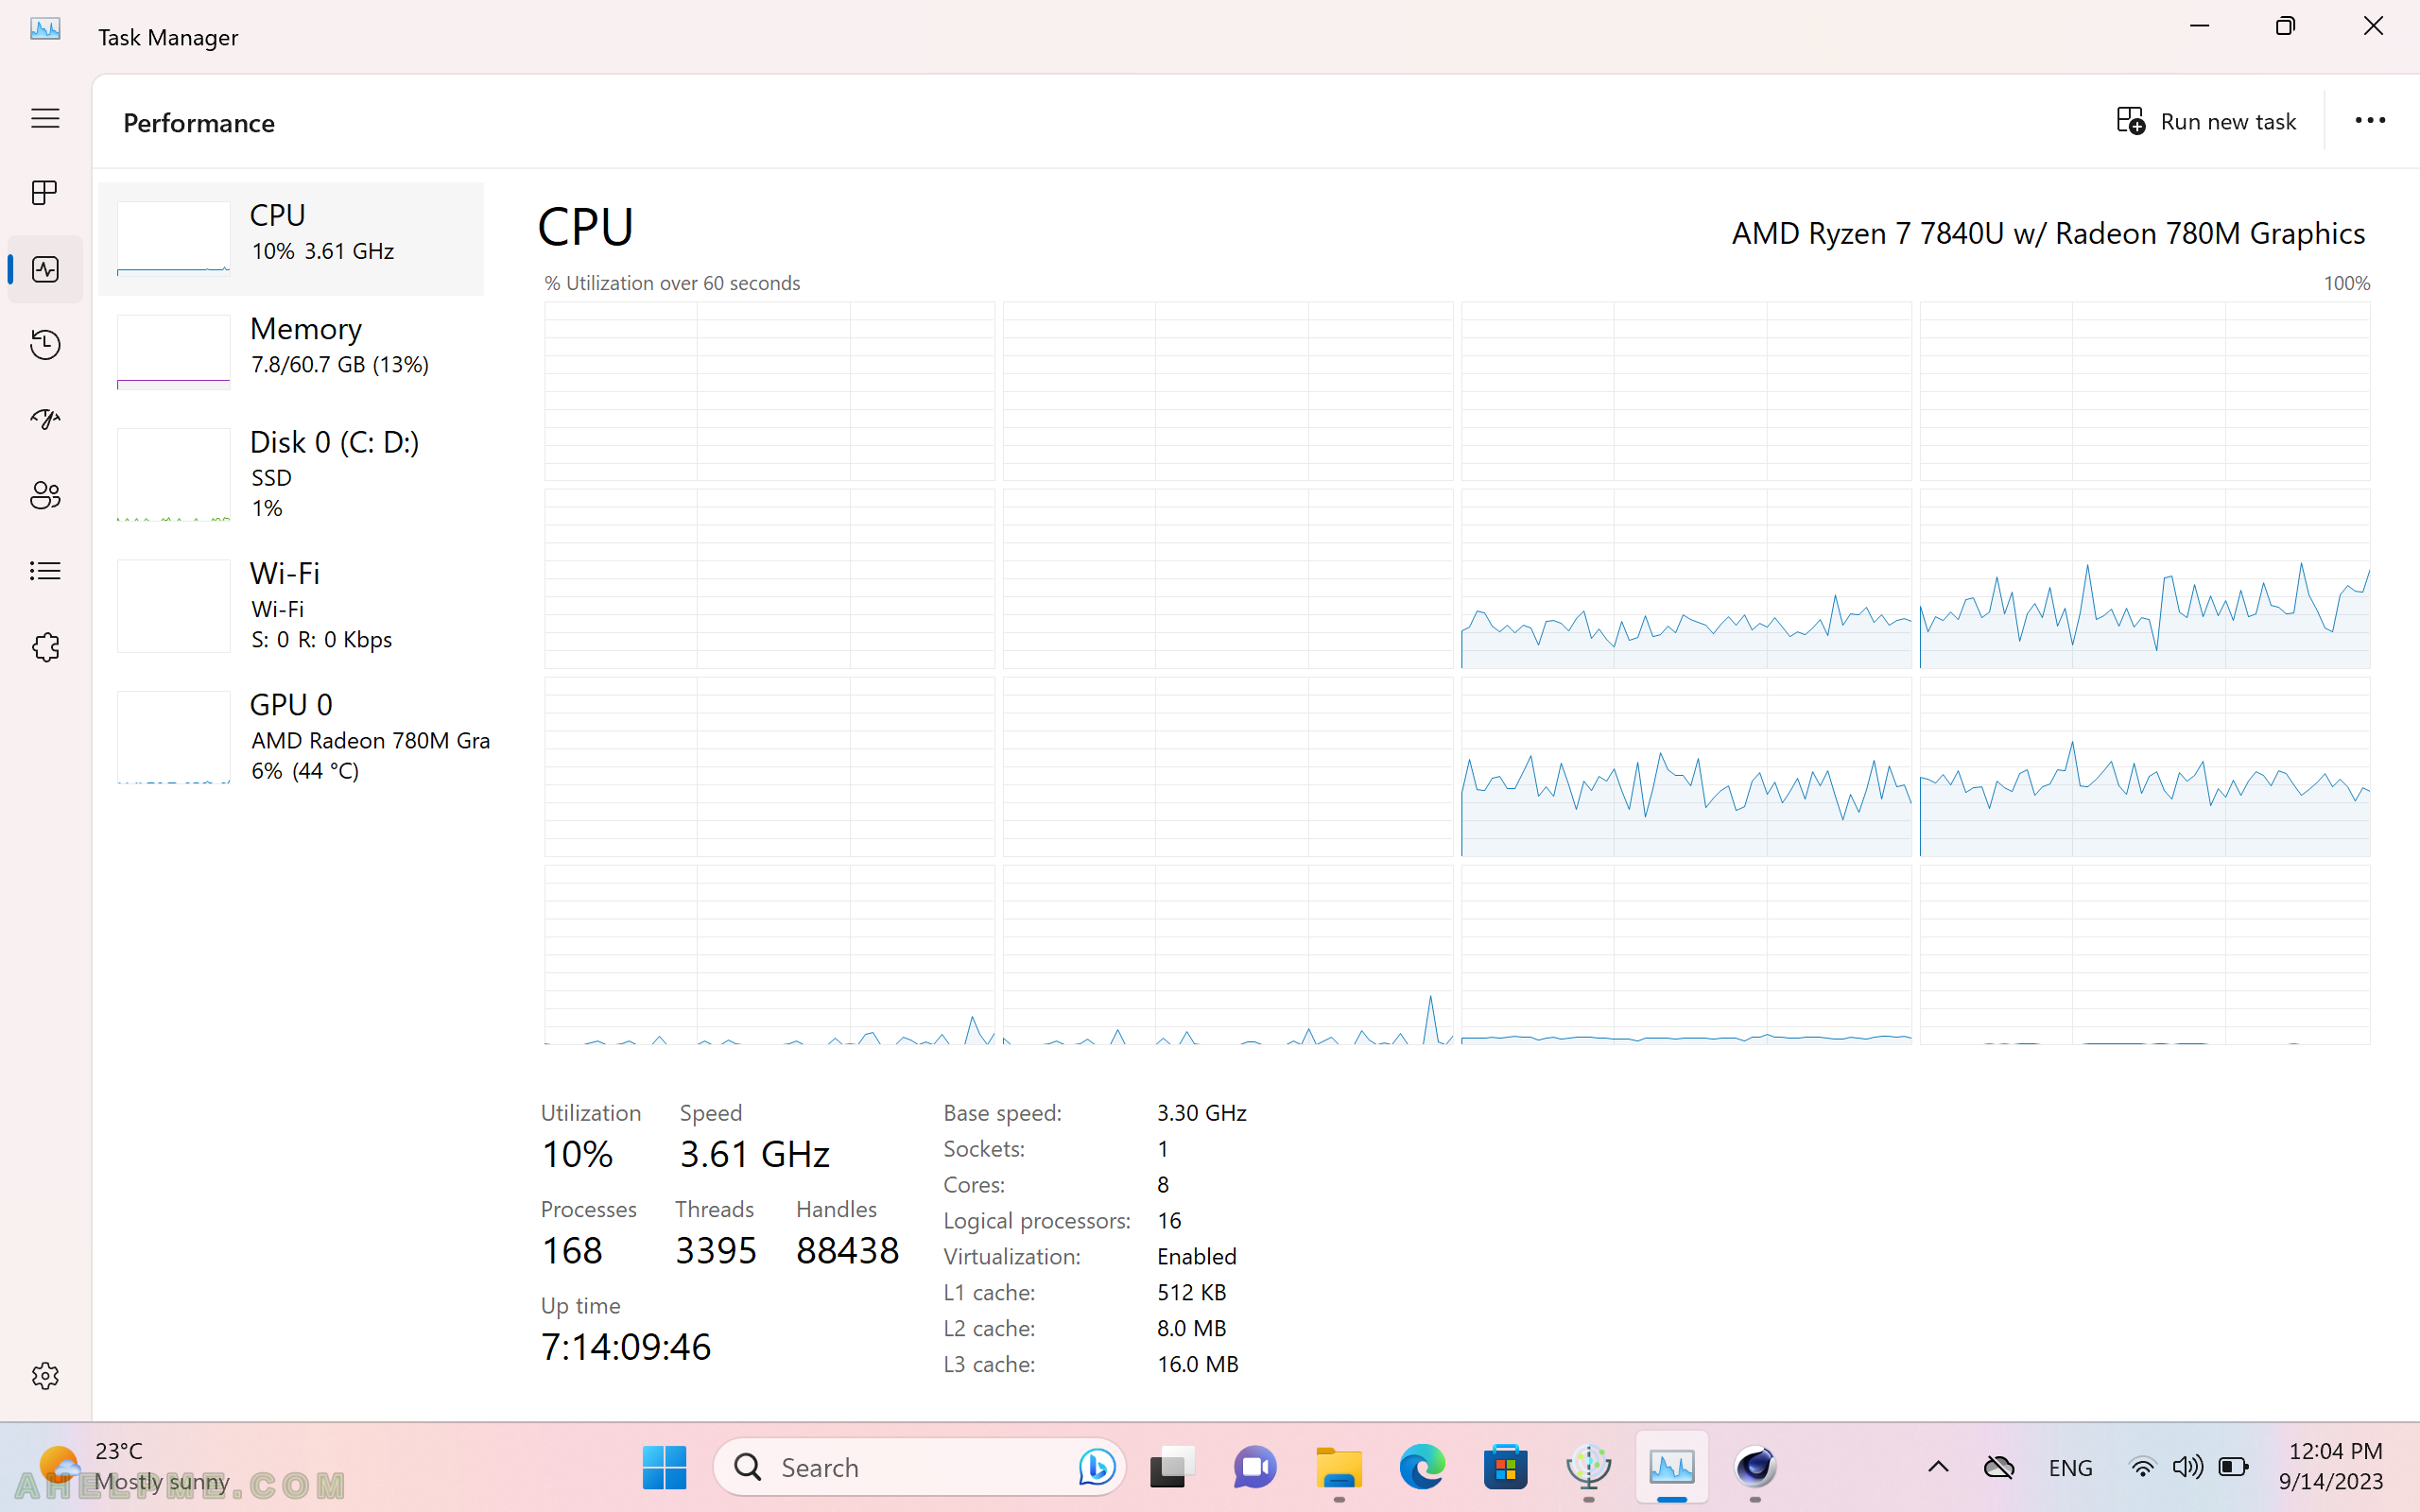
SCREENSHOT 44) The task manager shows 4 cores are mainly used with limited CPU speed of 3.67 GHz.
The system utilization is only 10%. 8 CPUs seem parked and they have no graphs at all. But most are barely used. No real change since 5 watts.
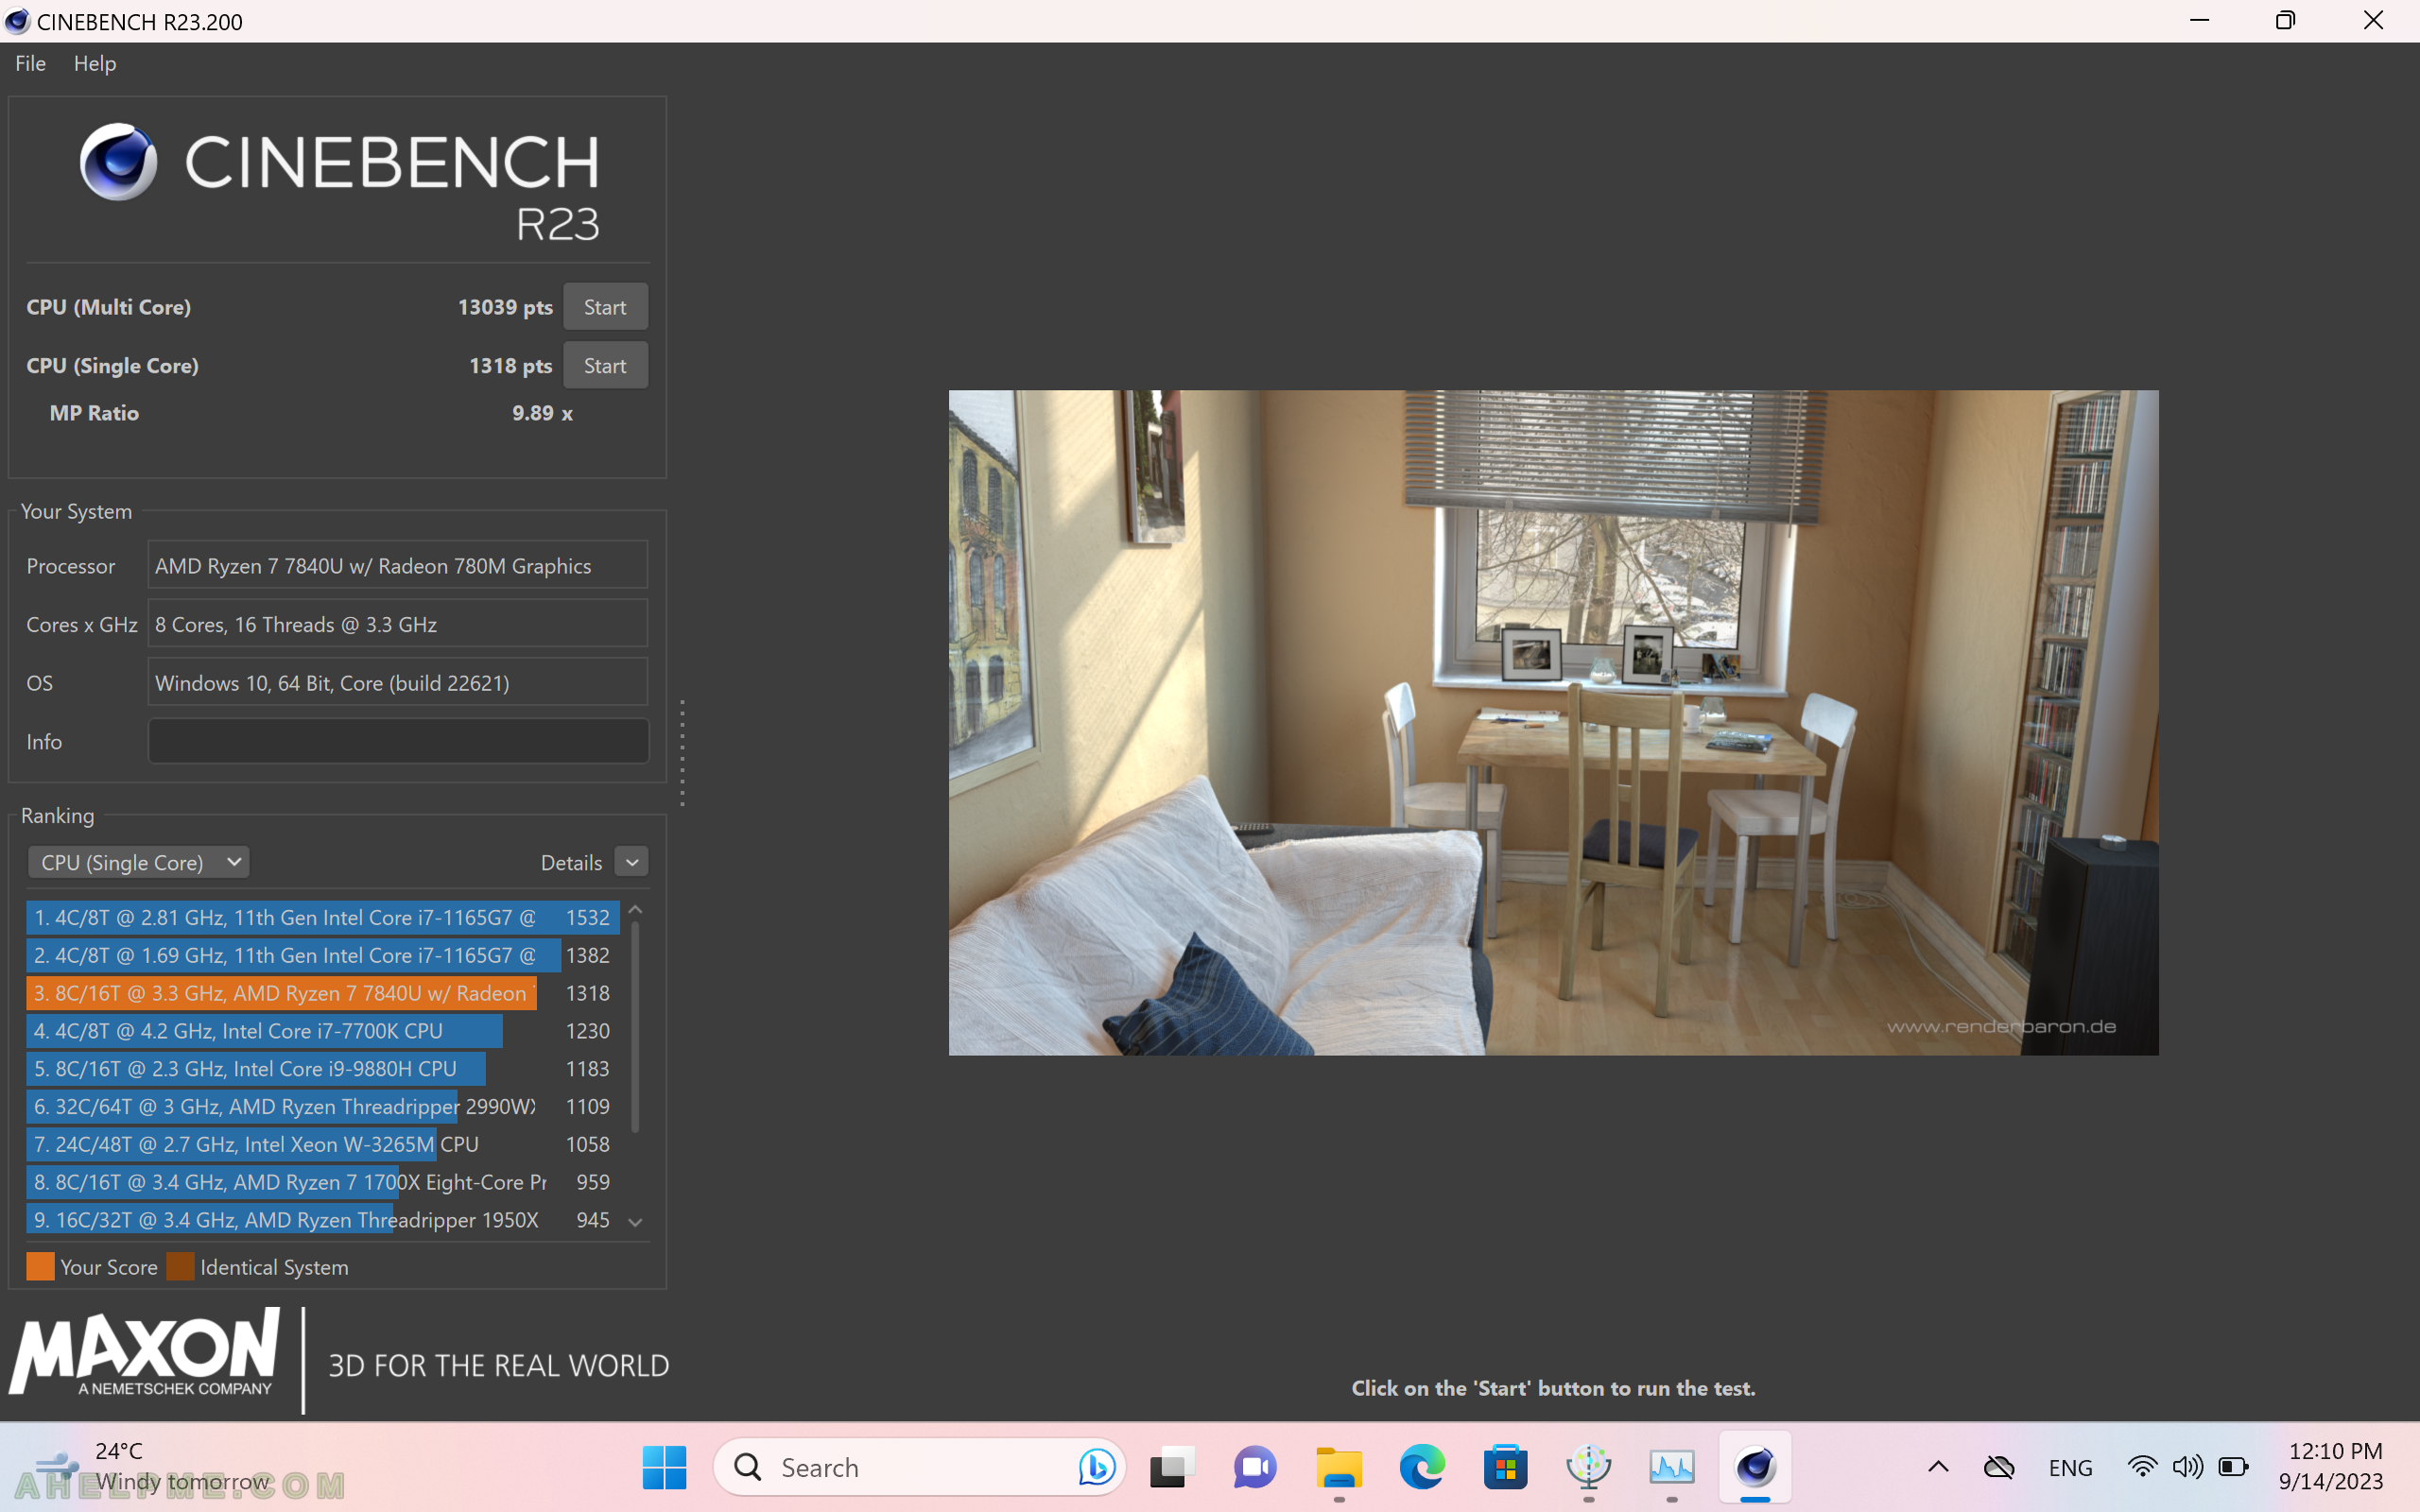
SCREENSHOT 45) The Cinebench r23 28 watts TDP limit single core test points are 1318, which is the maximum points, which this CPU can reach.
No higher results with higher TDP for the single core.
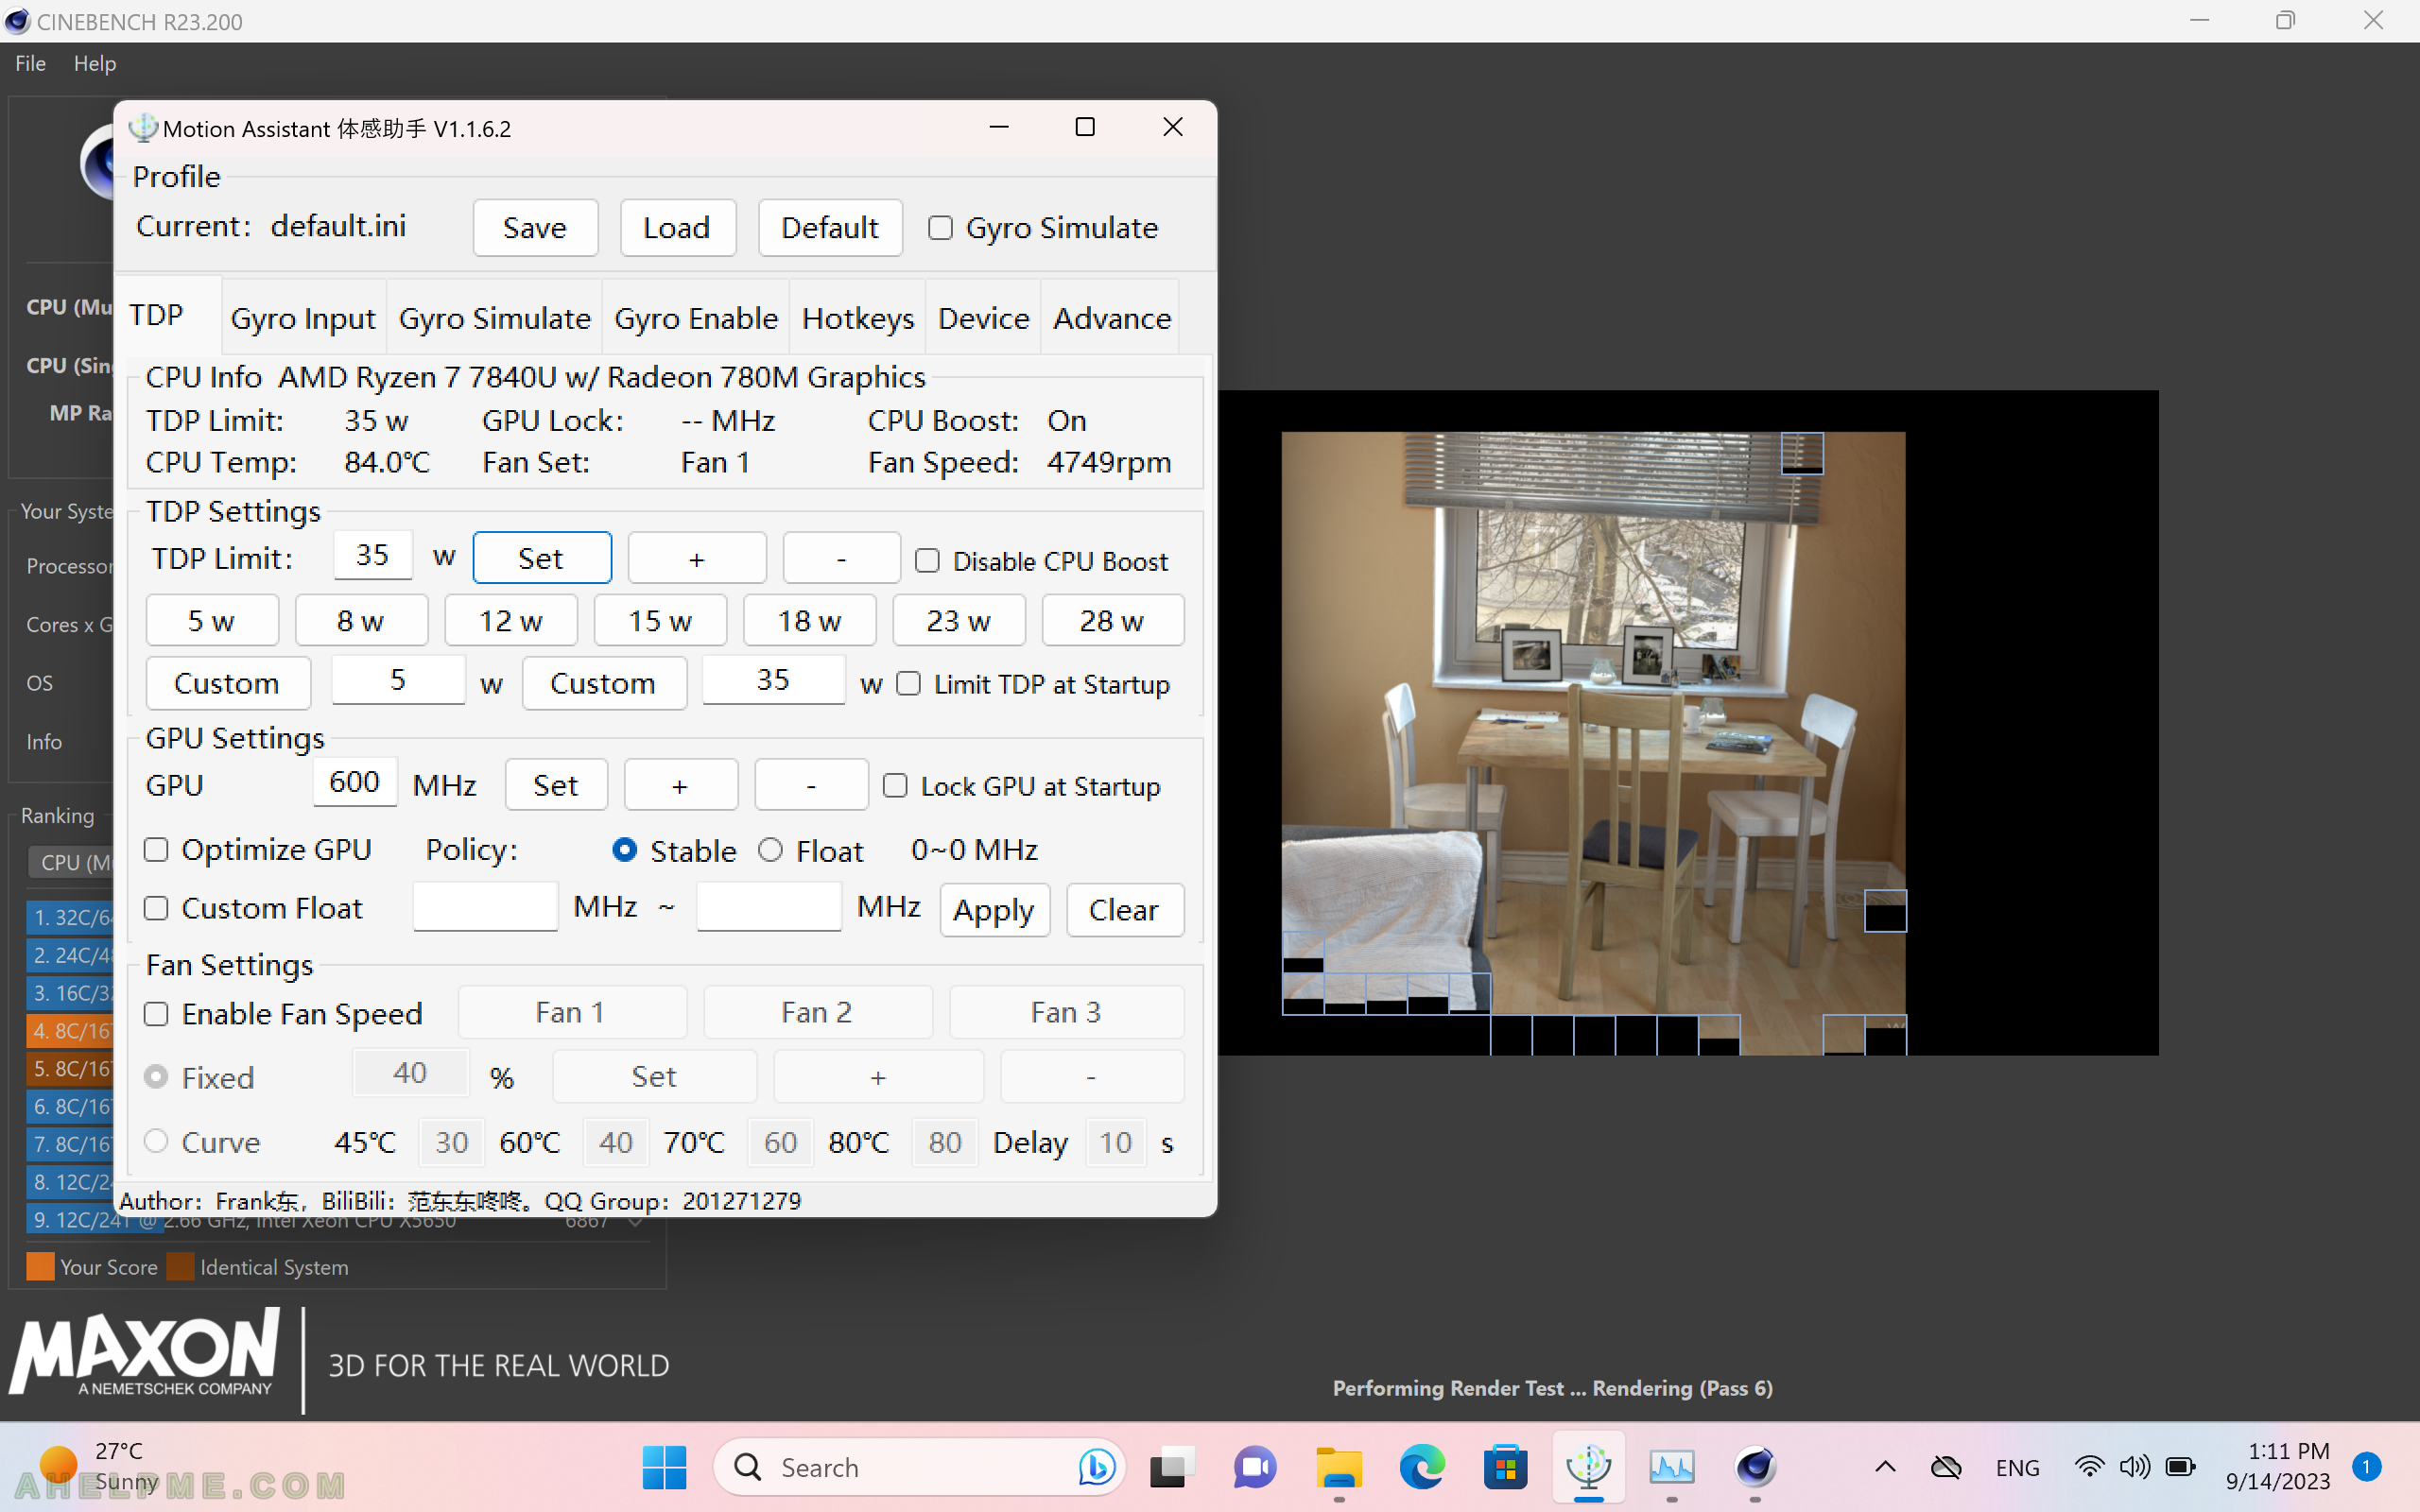
SCREENSHOT 46) 35 watts TDP limit multi core test with no FAN noise (4749 rpm) and CPU temperature 84.0’C.
The FAN makes a lot of noise and it is clearly heard.
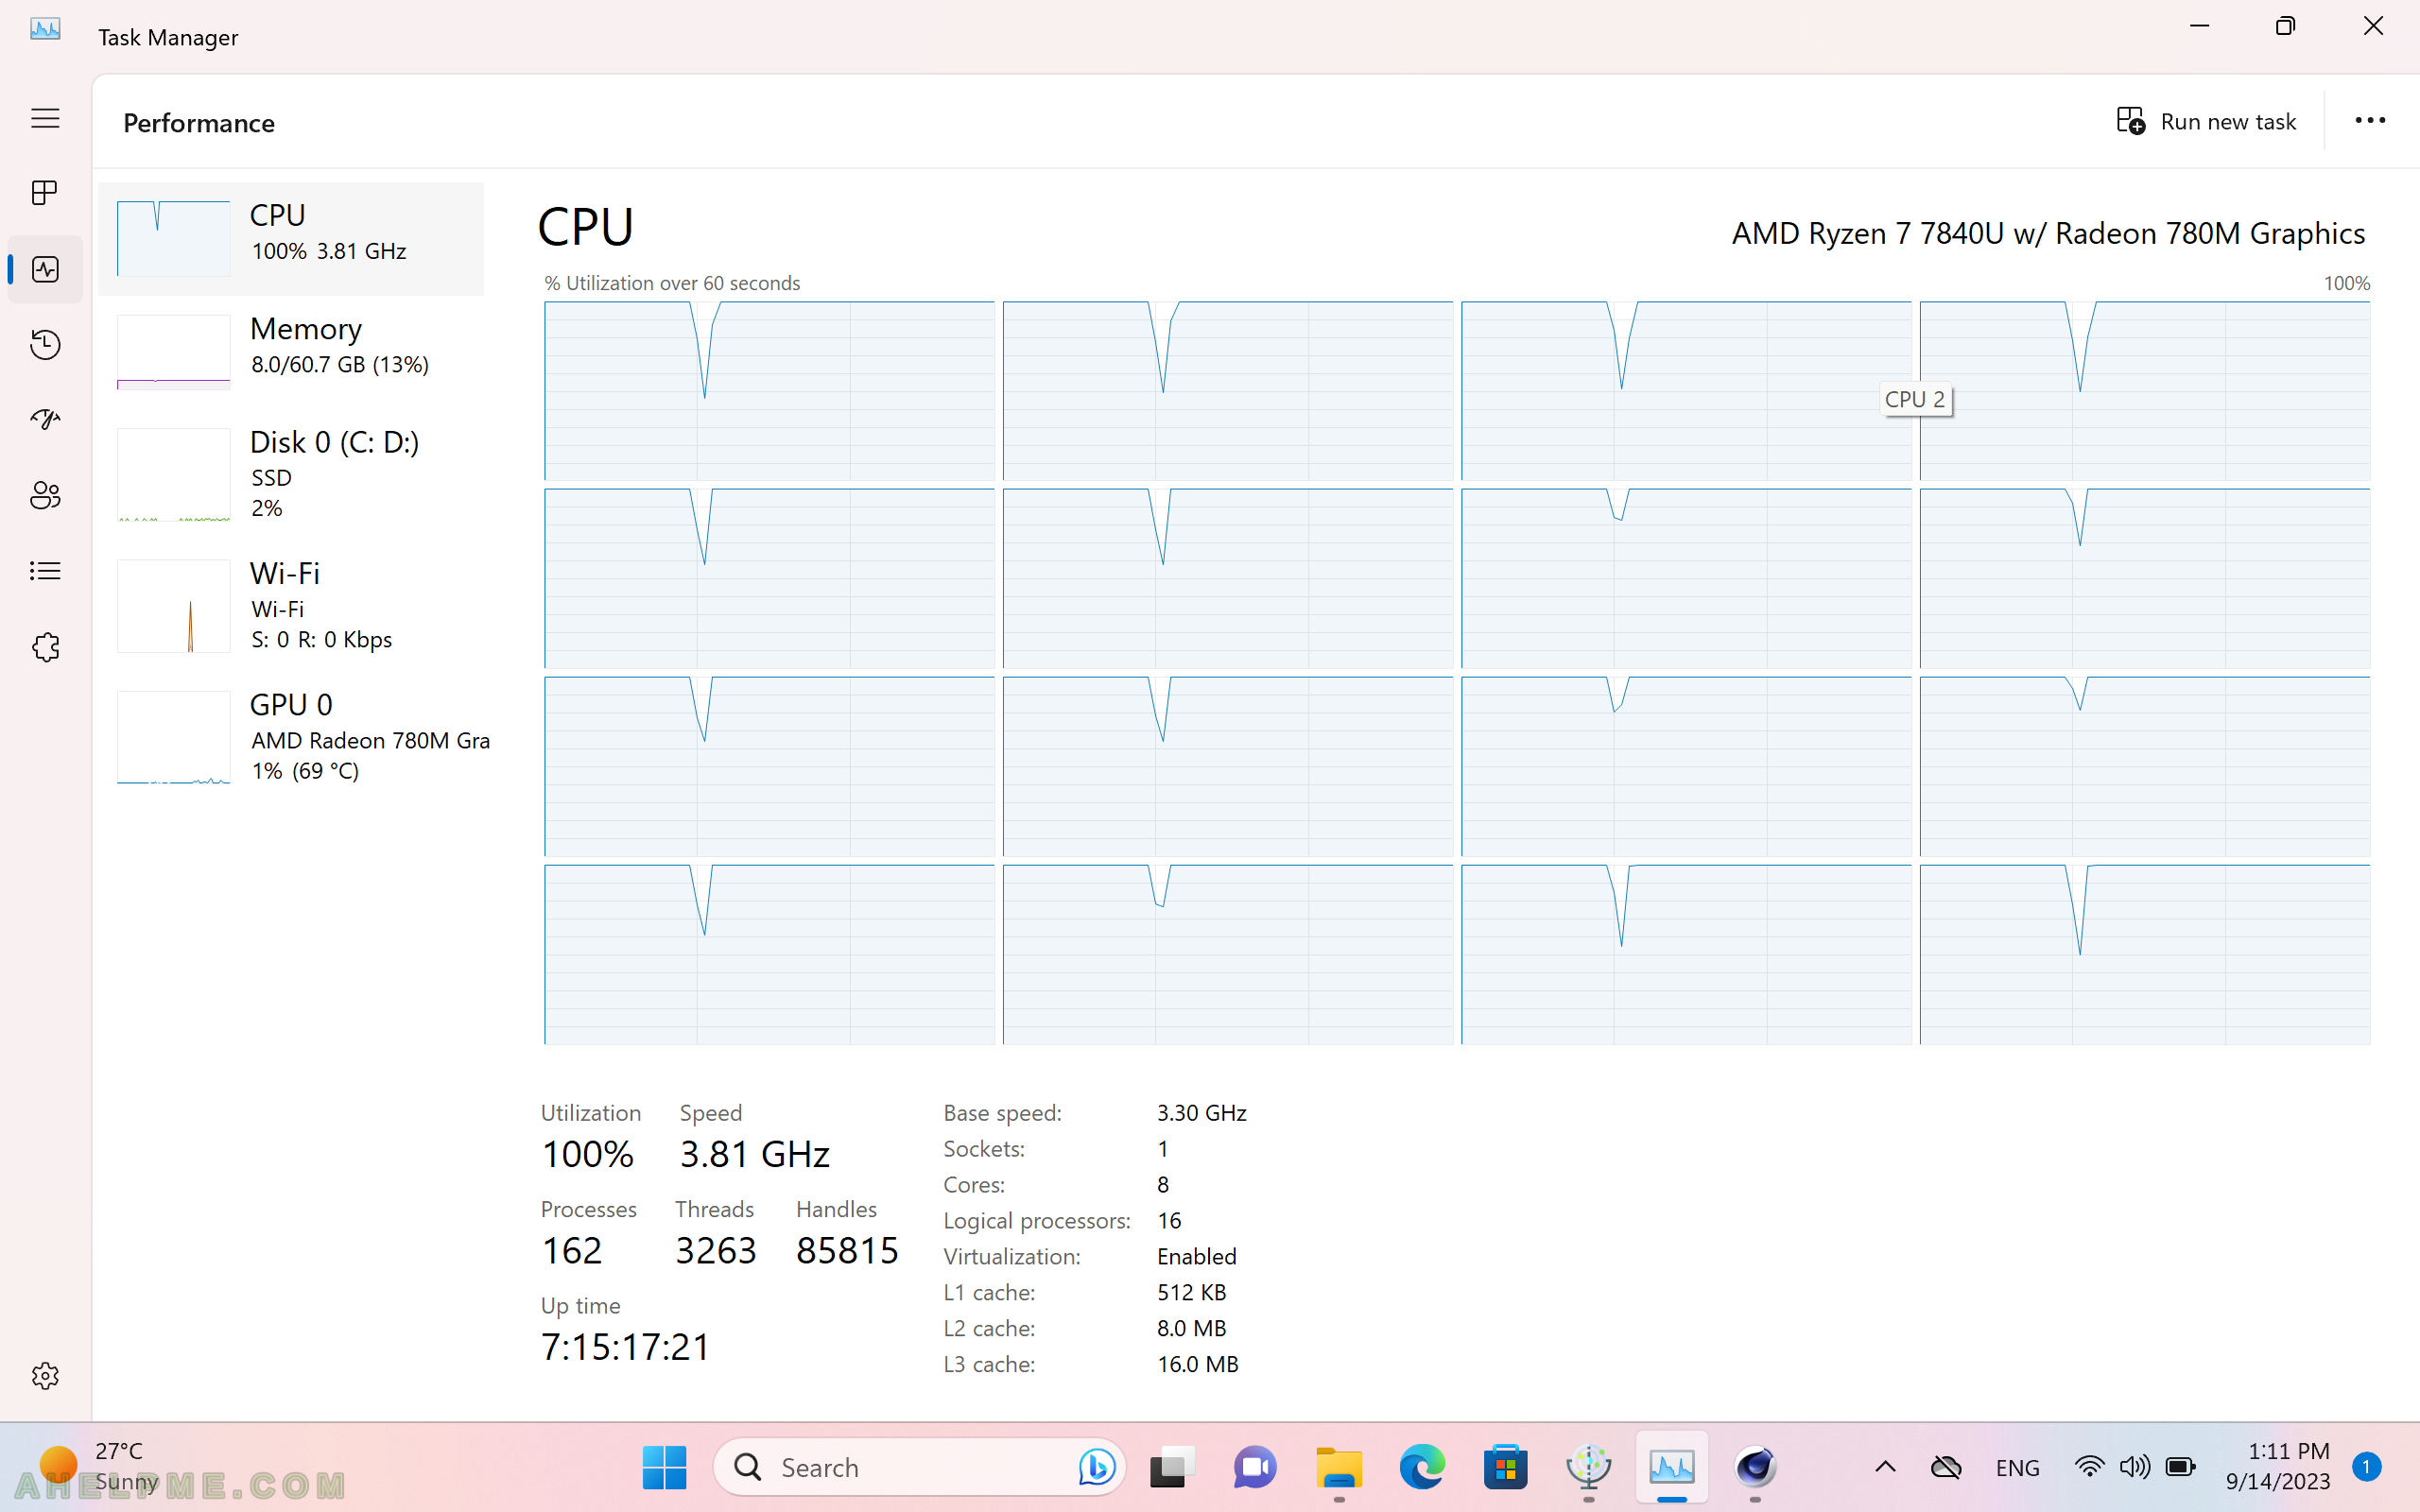
SCREENSHOT 47) The task manager shows all cores are used, but with limited CPU speed of 3.81 GHz.
The system utilization is only 100% and the CPU temperature is 84.0’C even with almost maxed out FAN. The CPU clock is above the base clock on all cores.
SCREENSHOT 48) The Cinebench r23 35 watts TDP limit multi core test points are 13991.
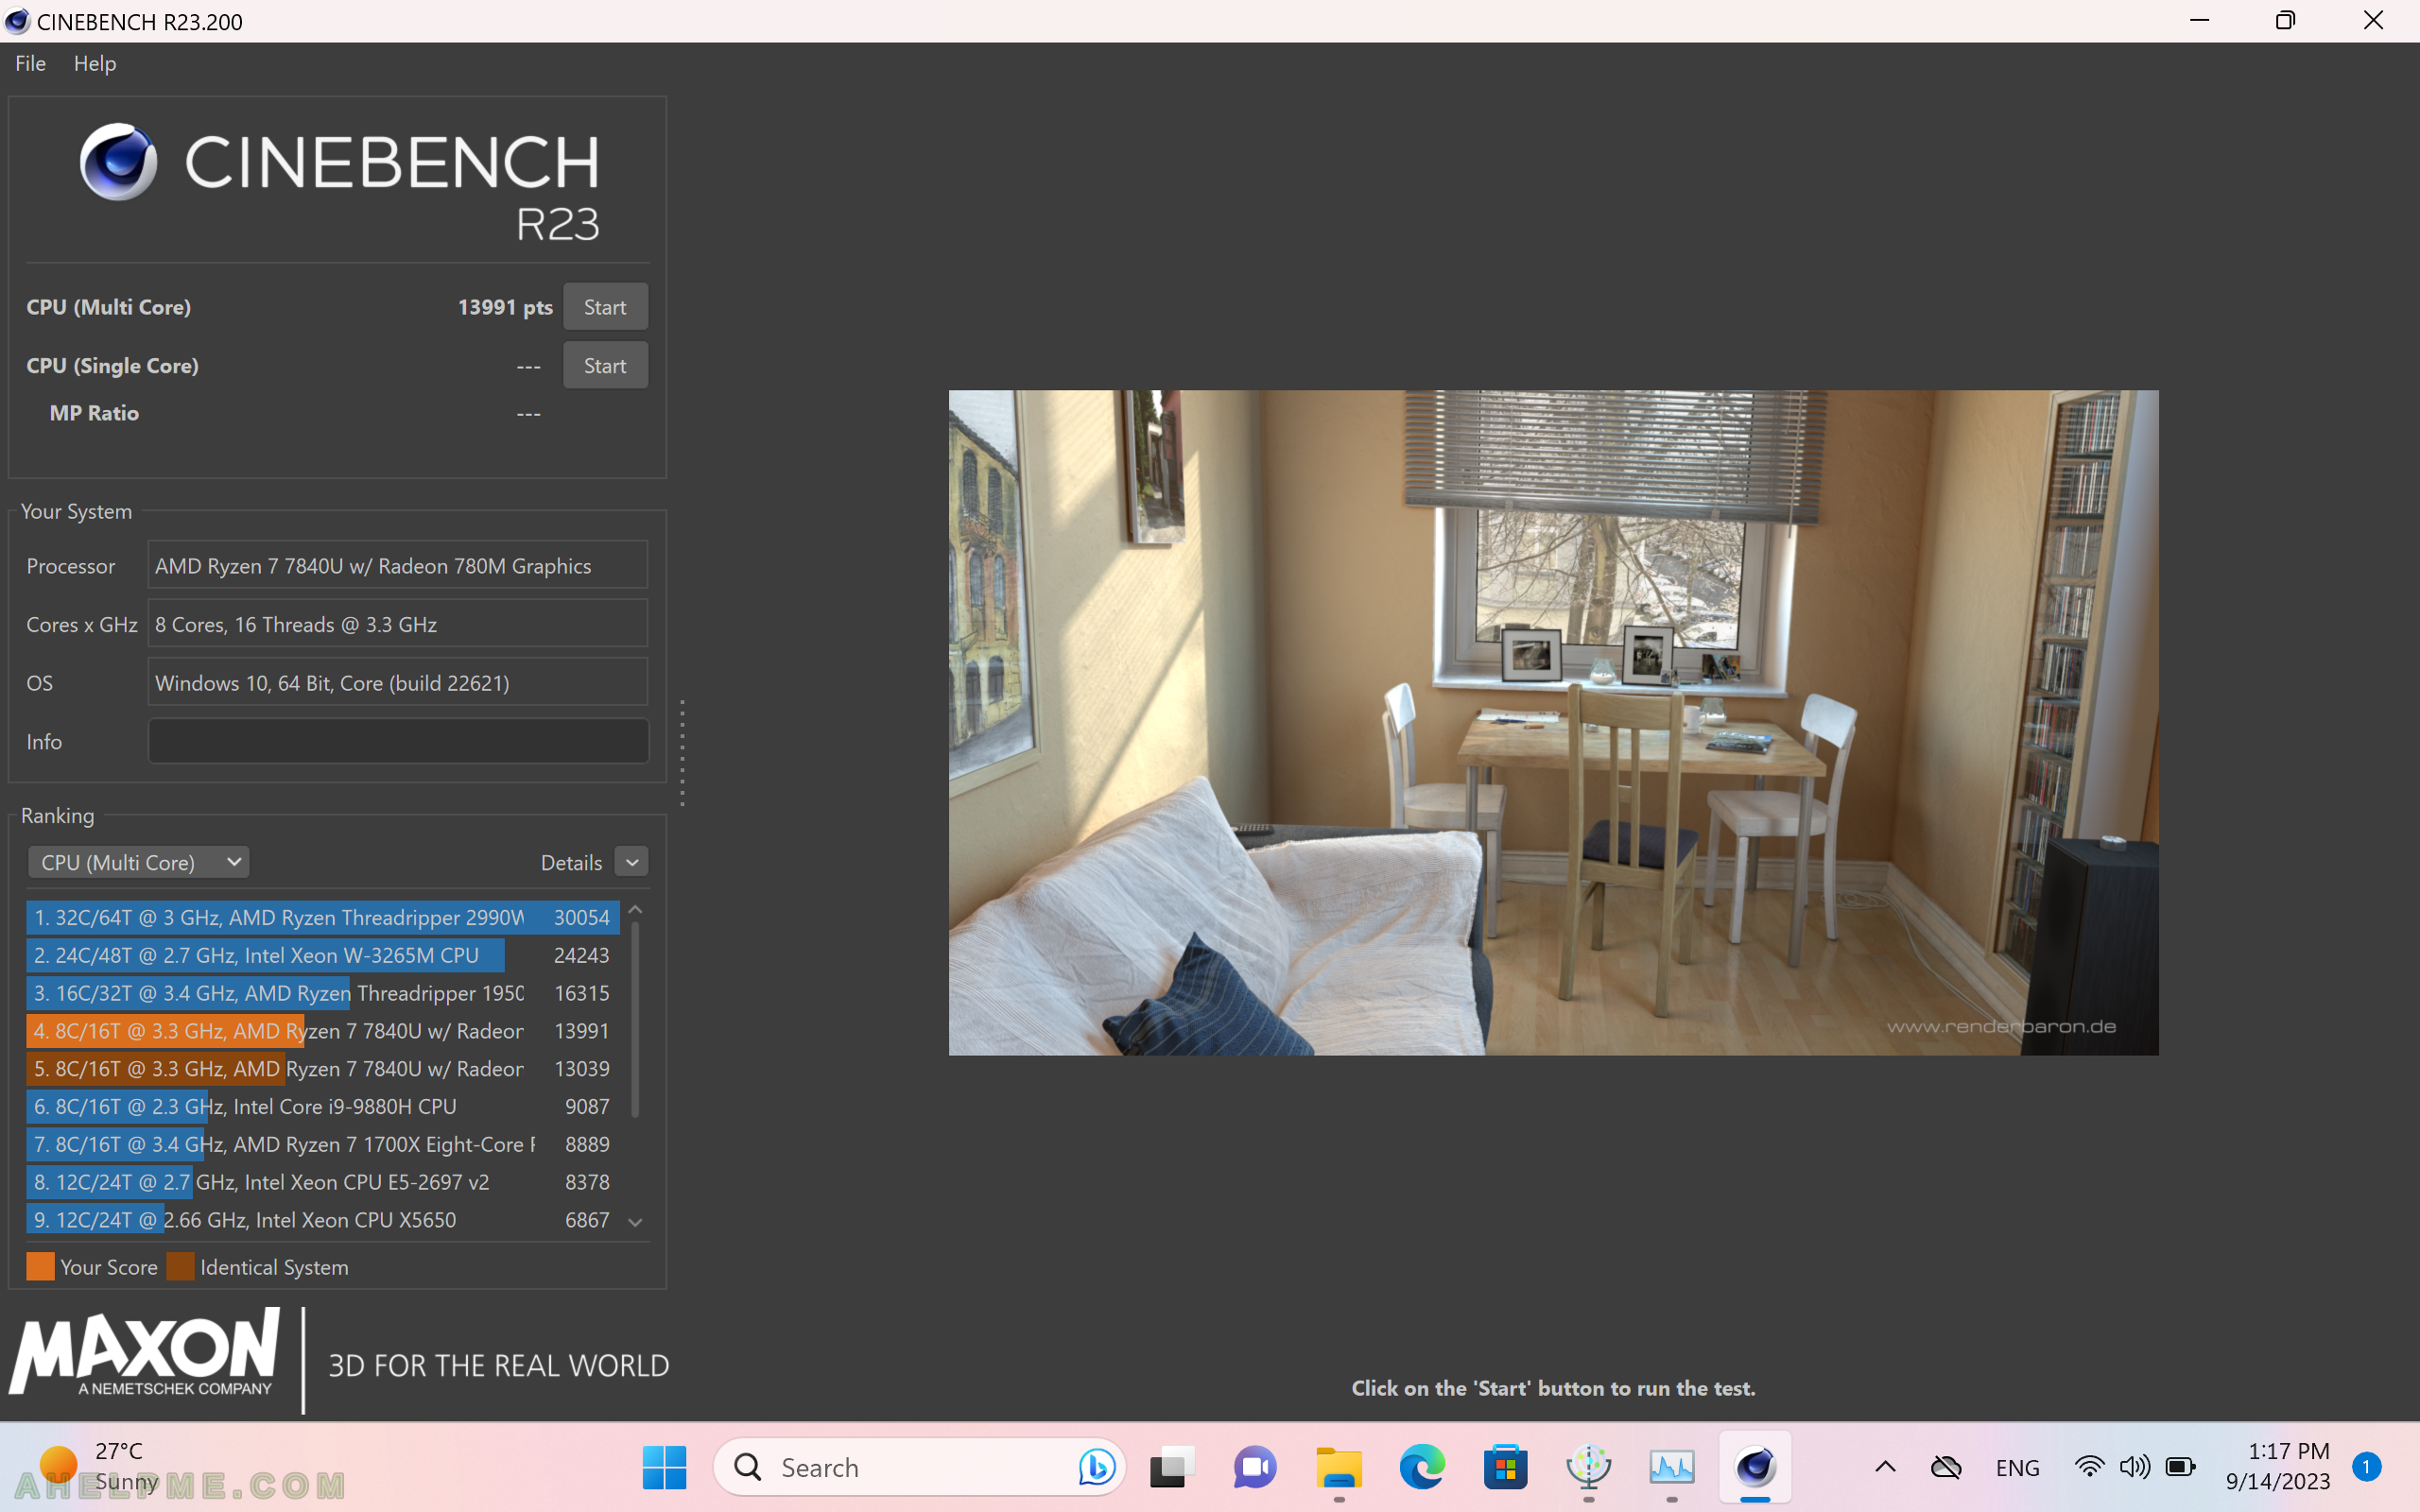
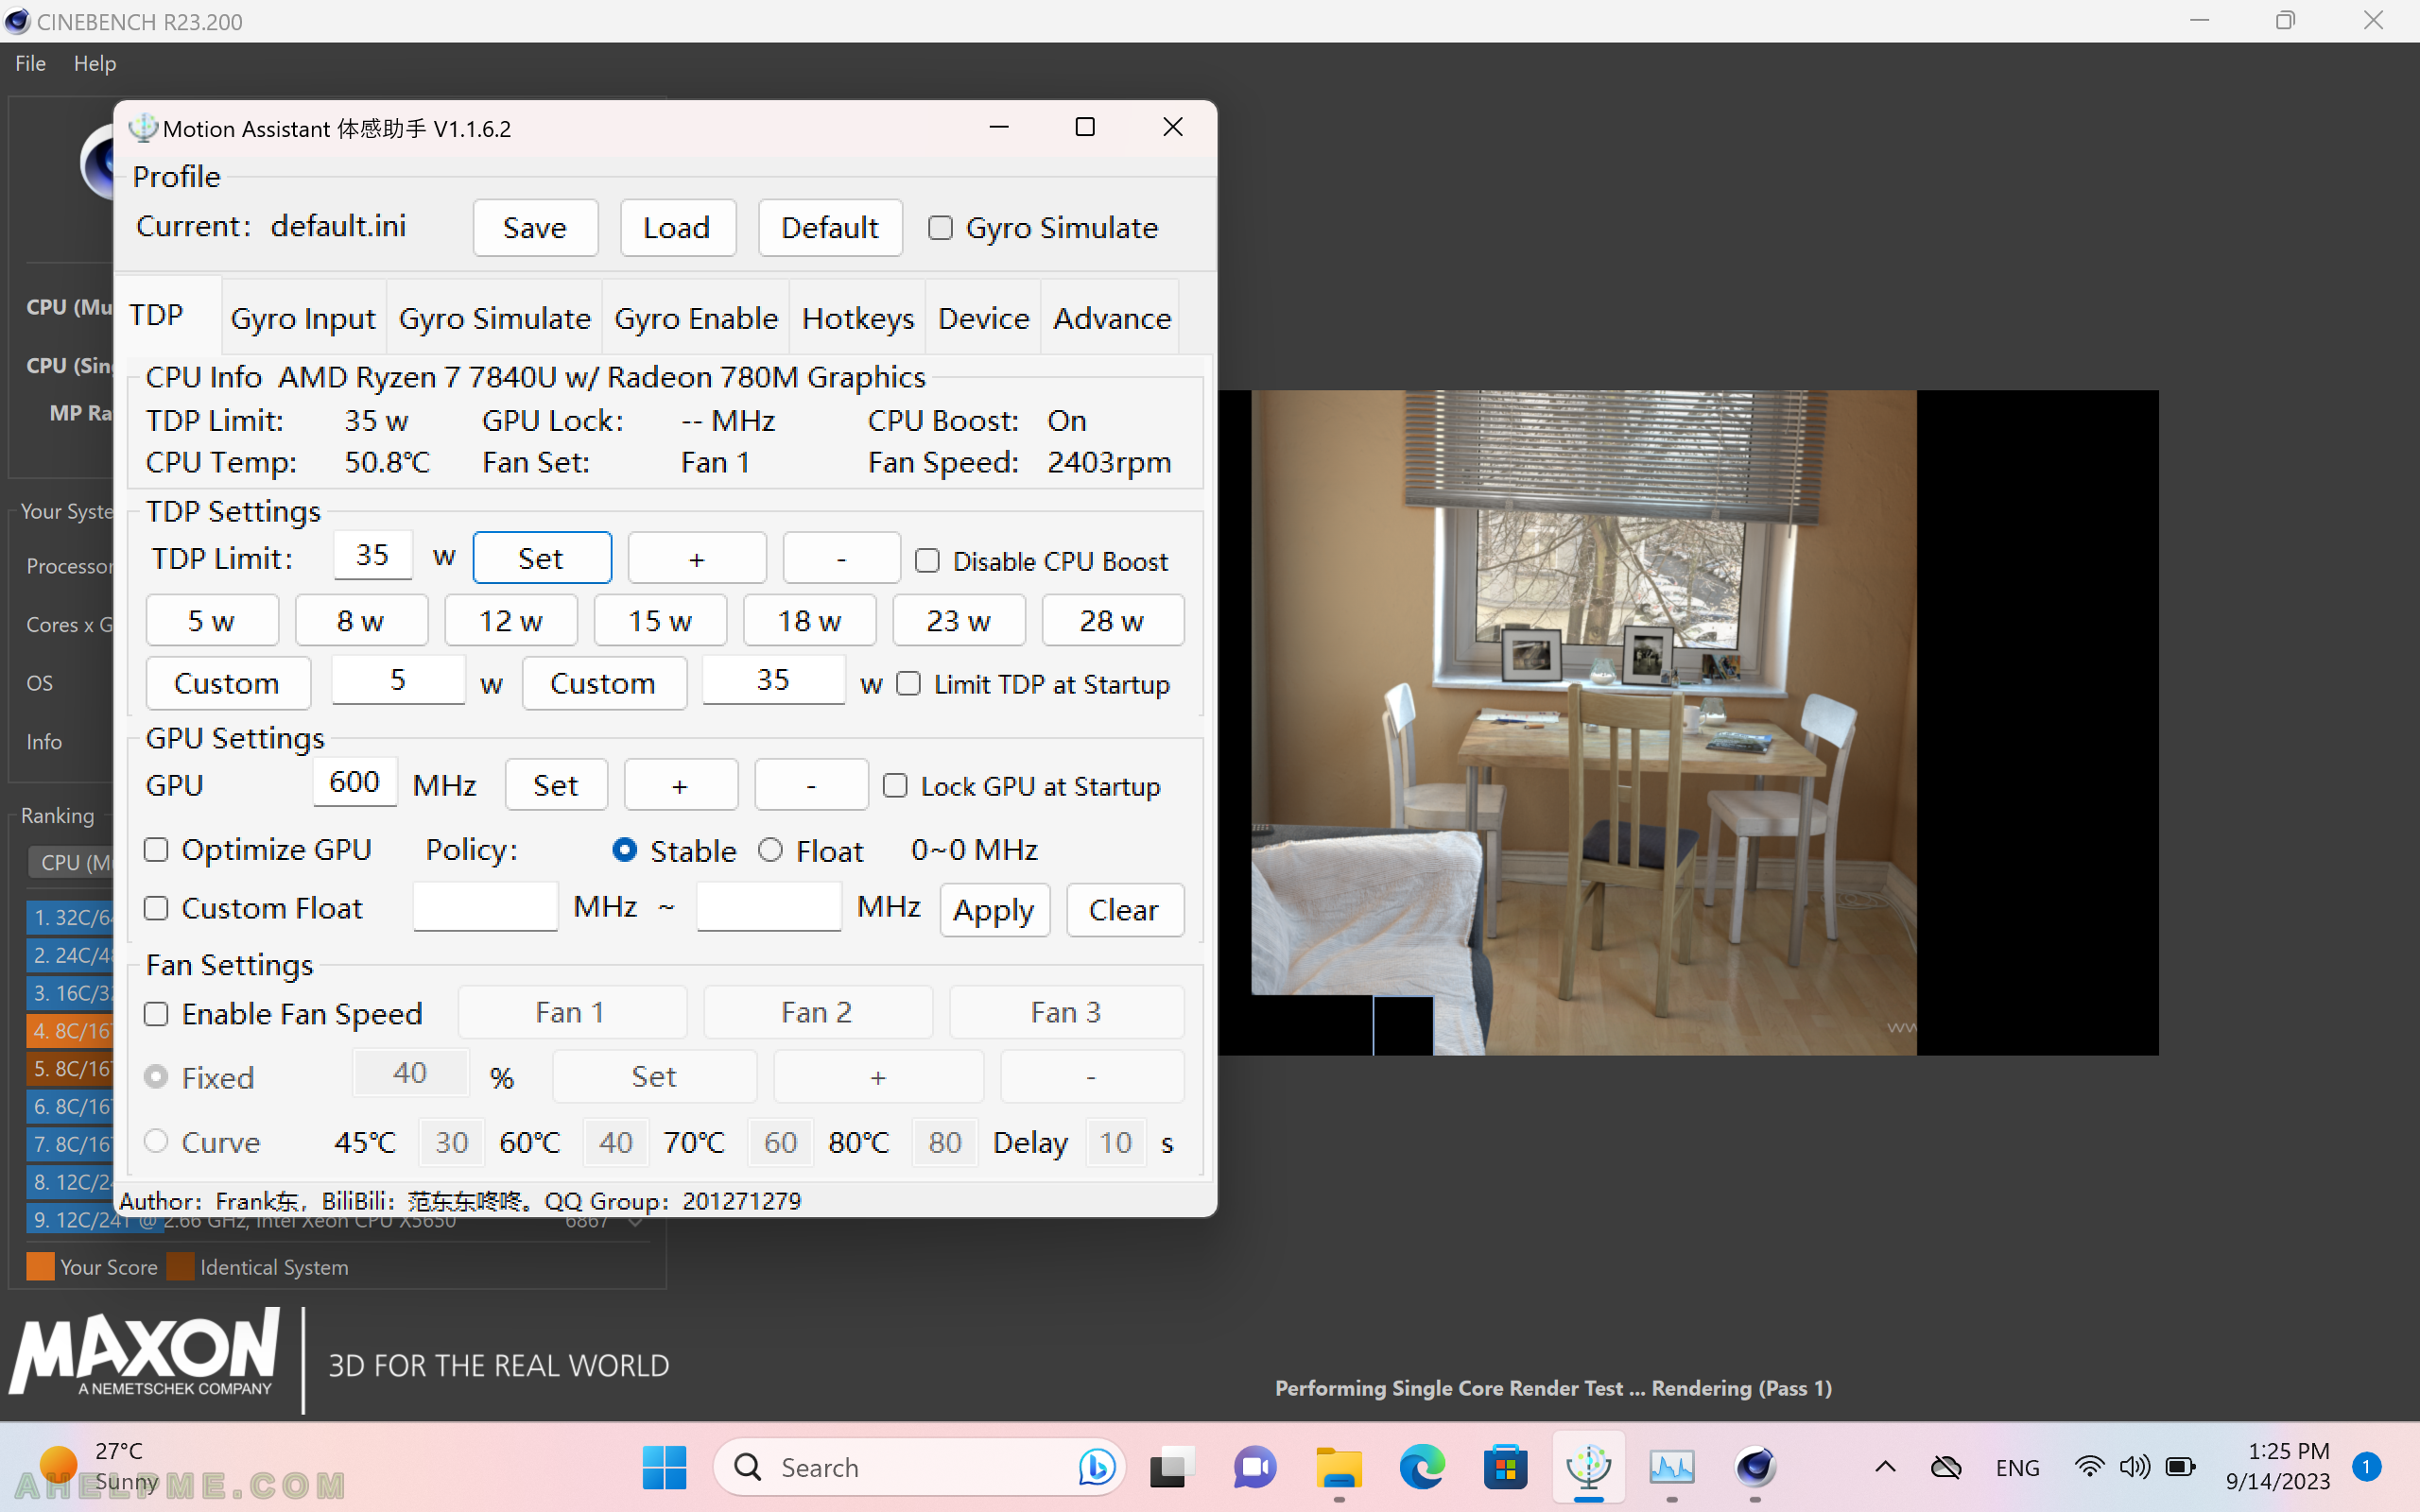
SCREENSHOT 49) 35 watts TDP limit single core test with no FAN noise (2403 rpm) and CPU temperature 50.8’C.
No real change since 5 watts. No FAN noise.
SCREENSHOT 50) The task manager shows 4 cores are mainly used with limited CPU speed of 3.69 GHz.
The system utilization is only 9%. 8 CPUs seem parked and they have no graphs at all. But most are barely used. No real change since 5 watts.
