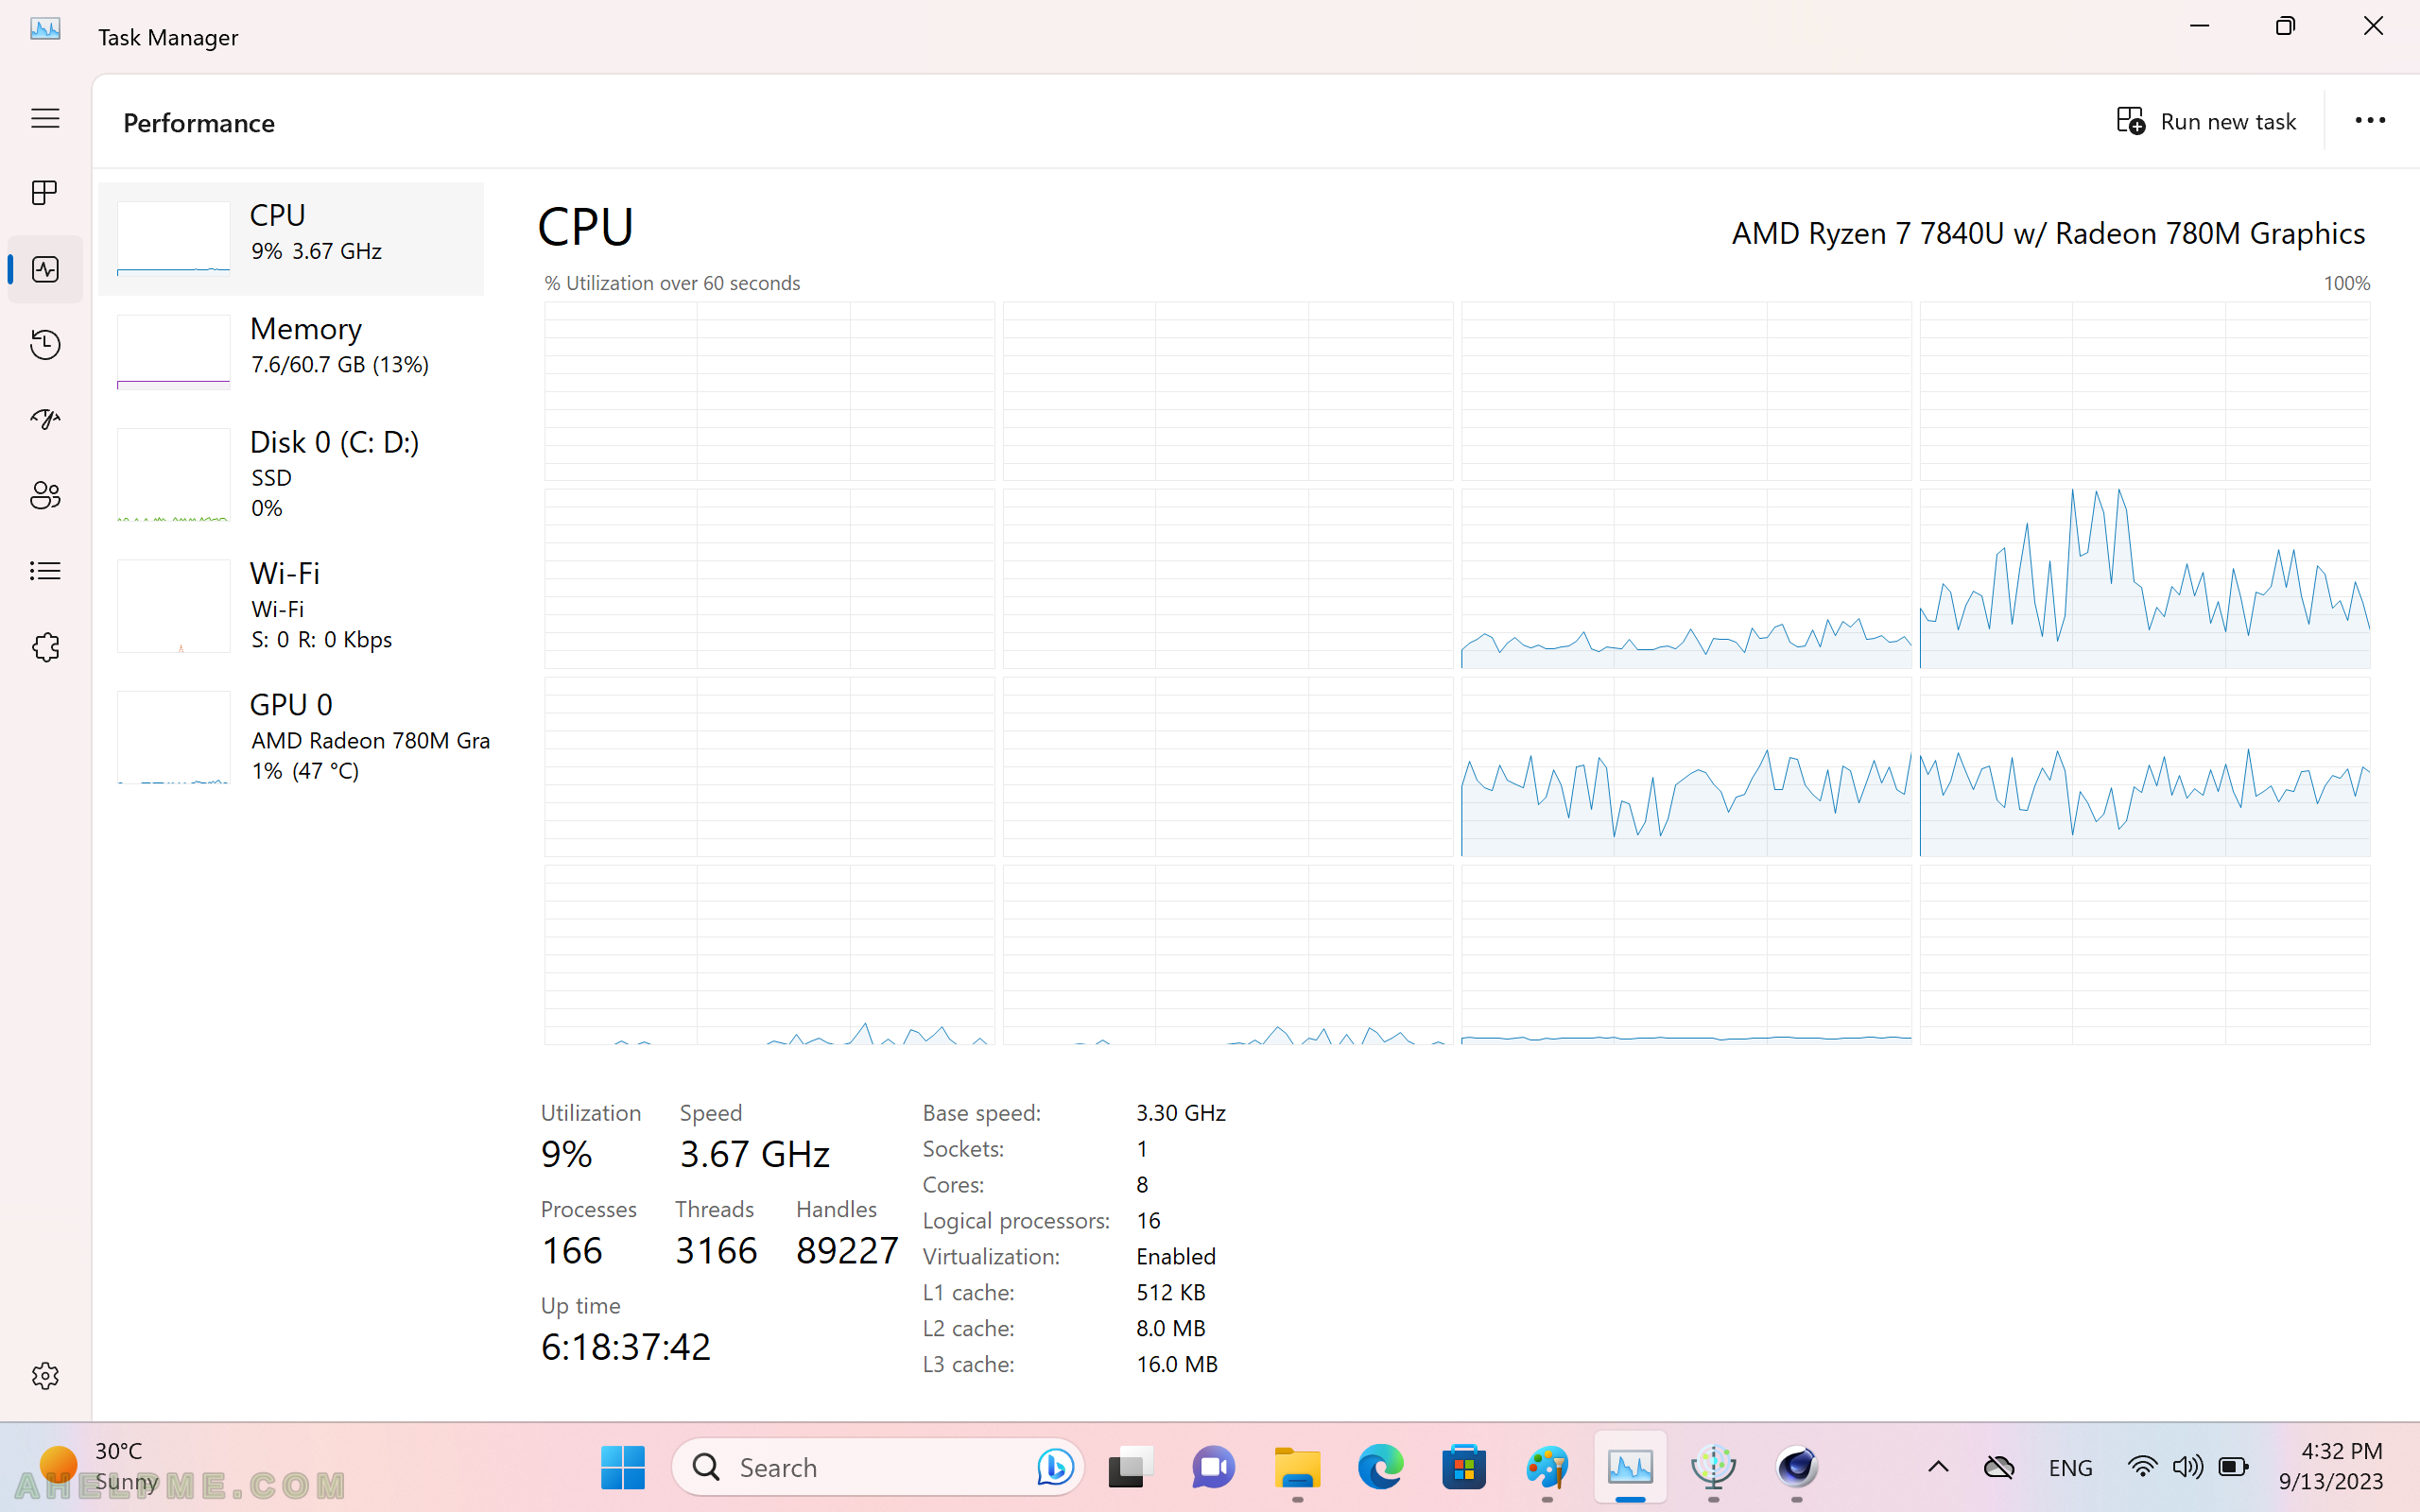
SCREENSHOT 11) The task manager shows all cores are used, but with limited CPU speed of 1.21 GHz.
The system utilization is only 37% and the CPU temperature is just 43.5’C.
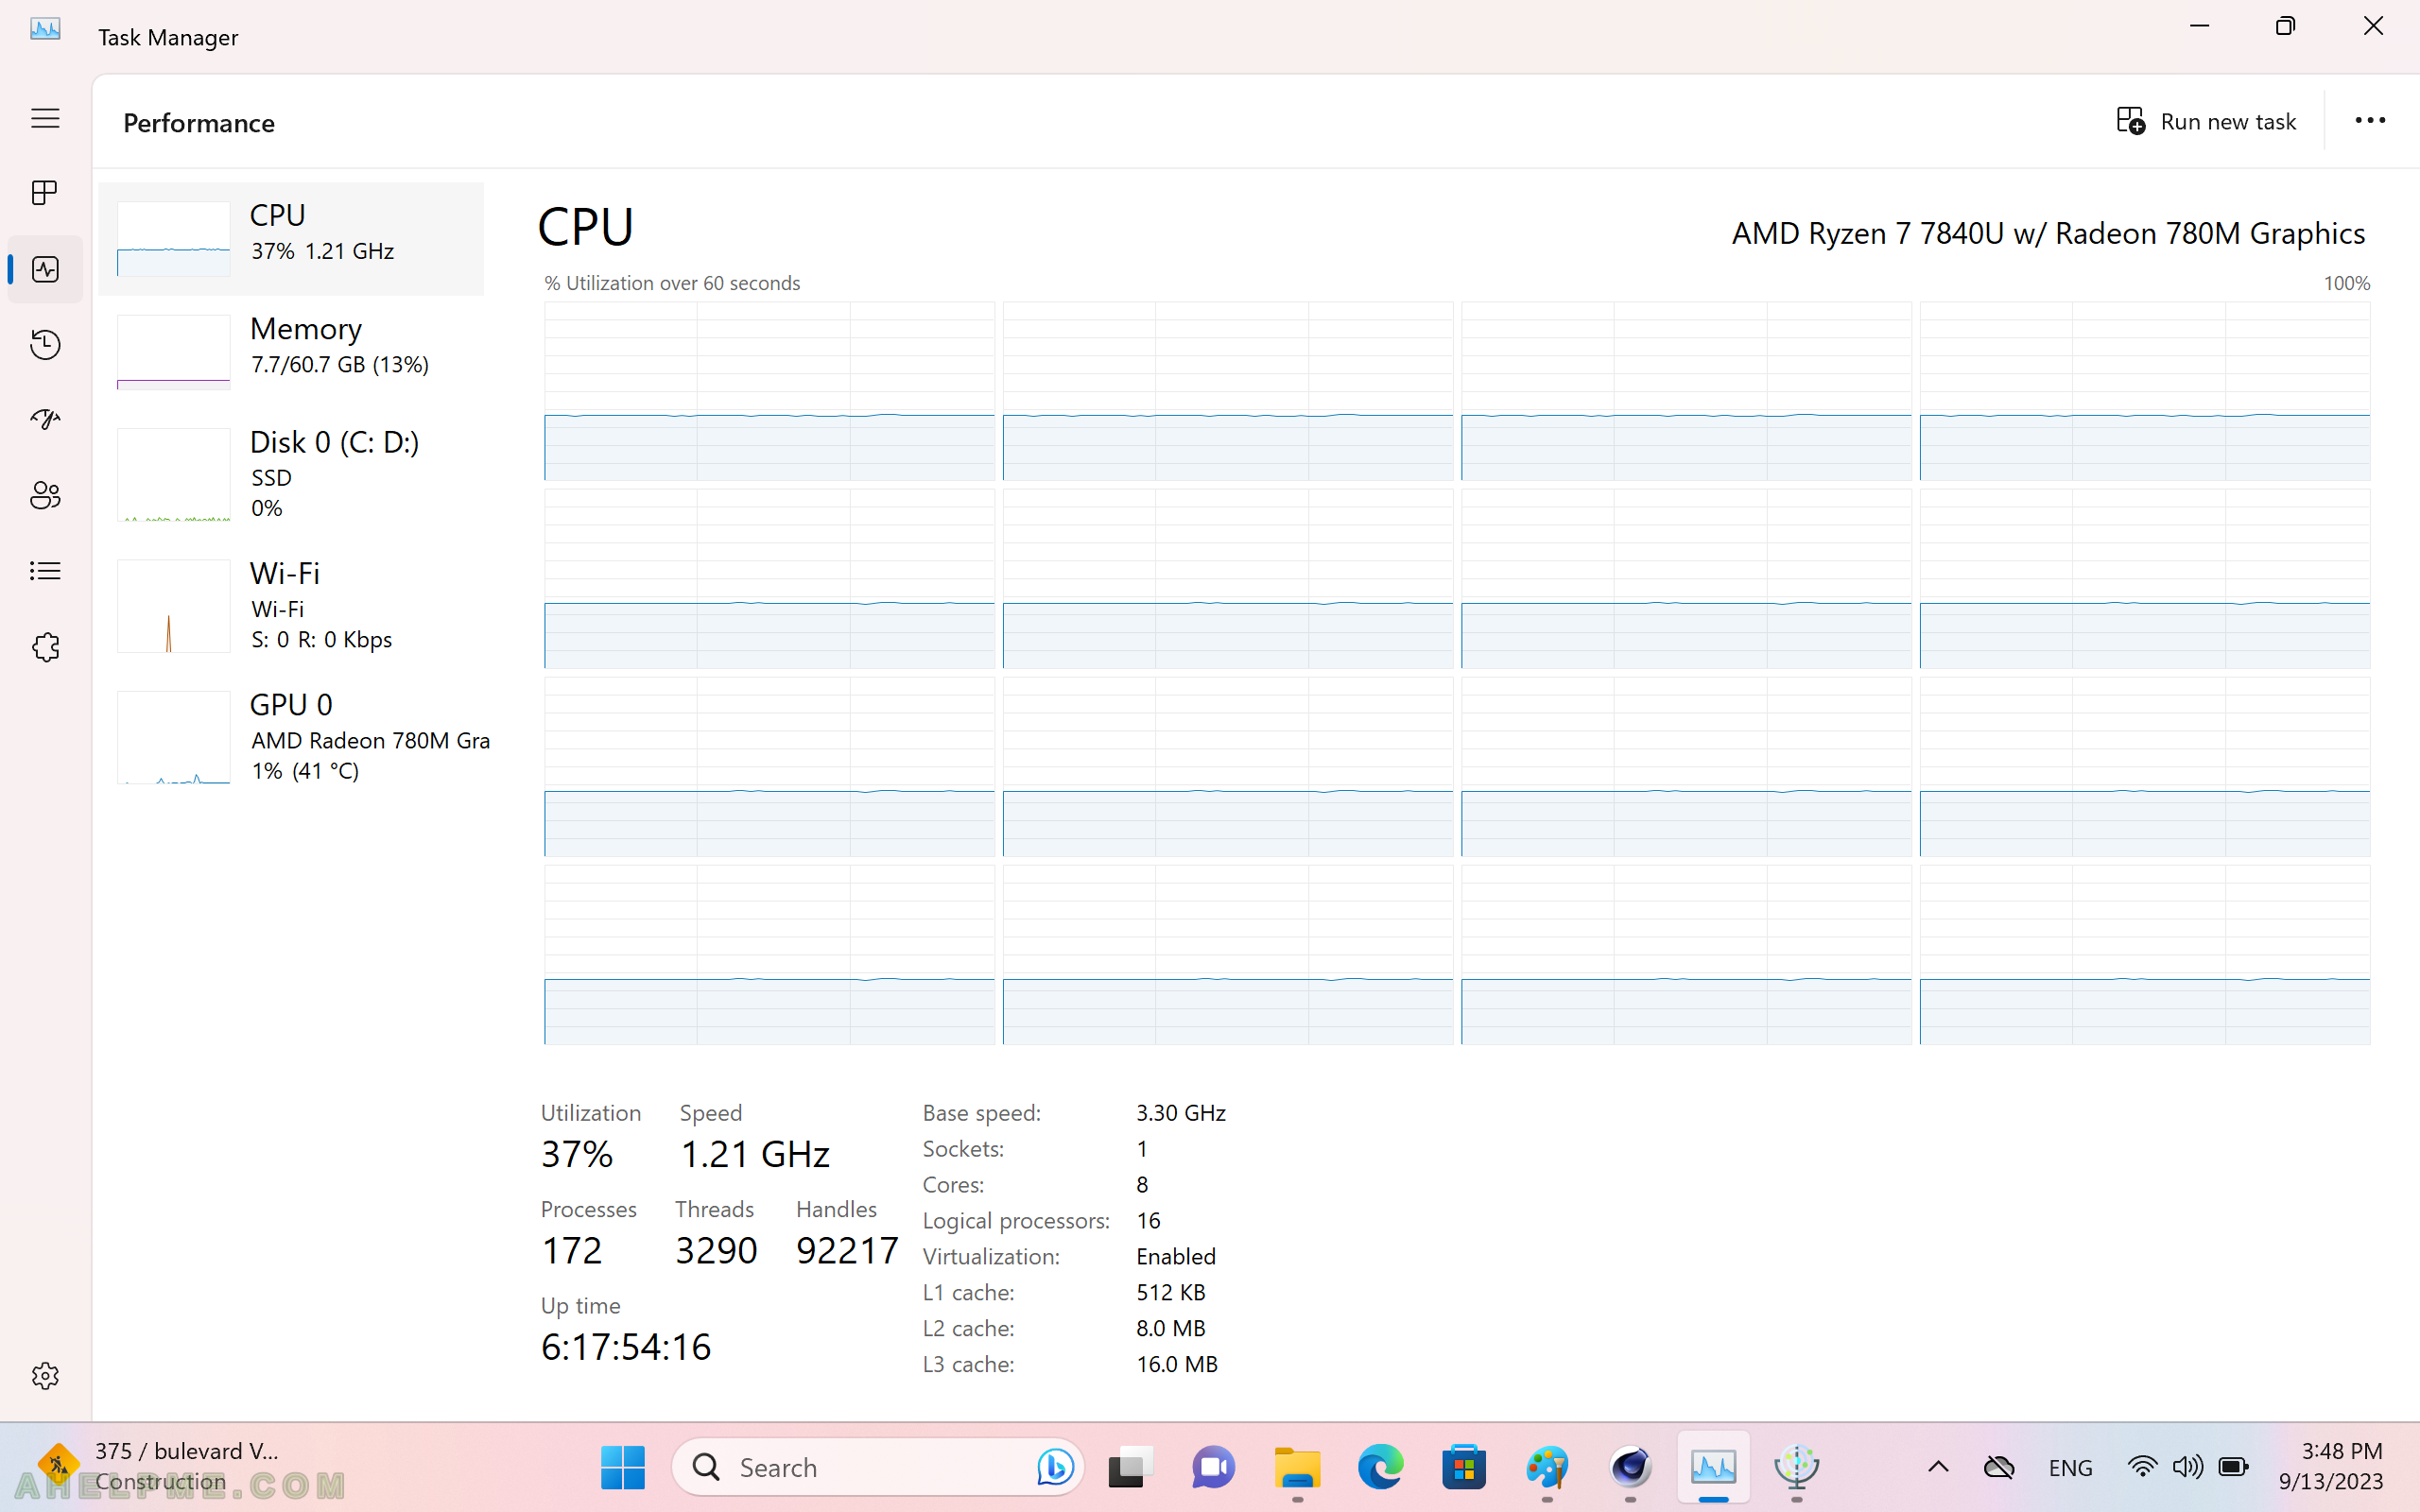
SCREENSHOT 12) The Cinebench r23 8 watts TDP limit multi core test points are 4449.
More than double of the previous 5 watts TDP.
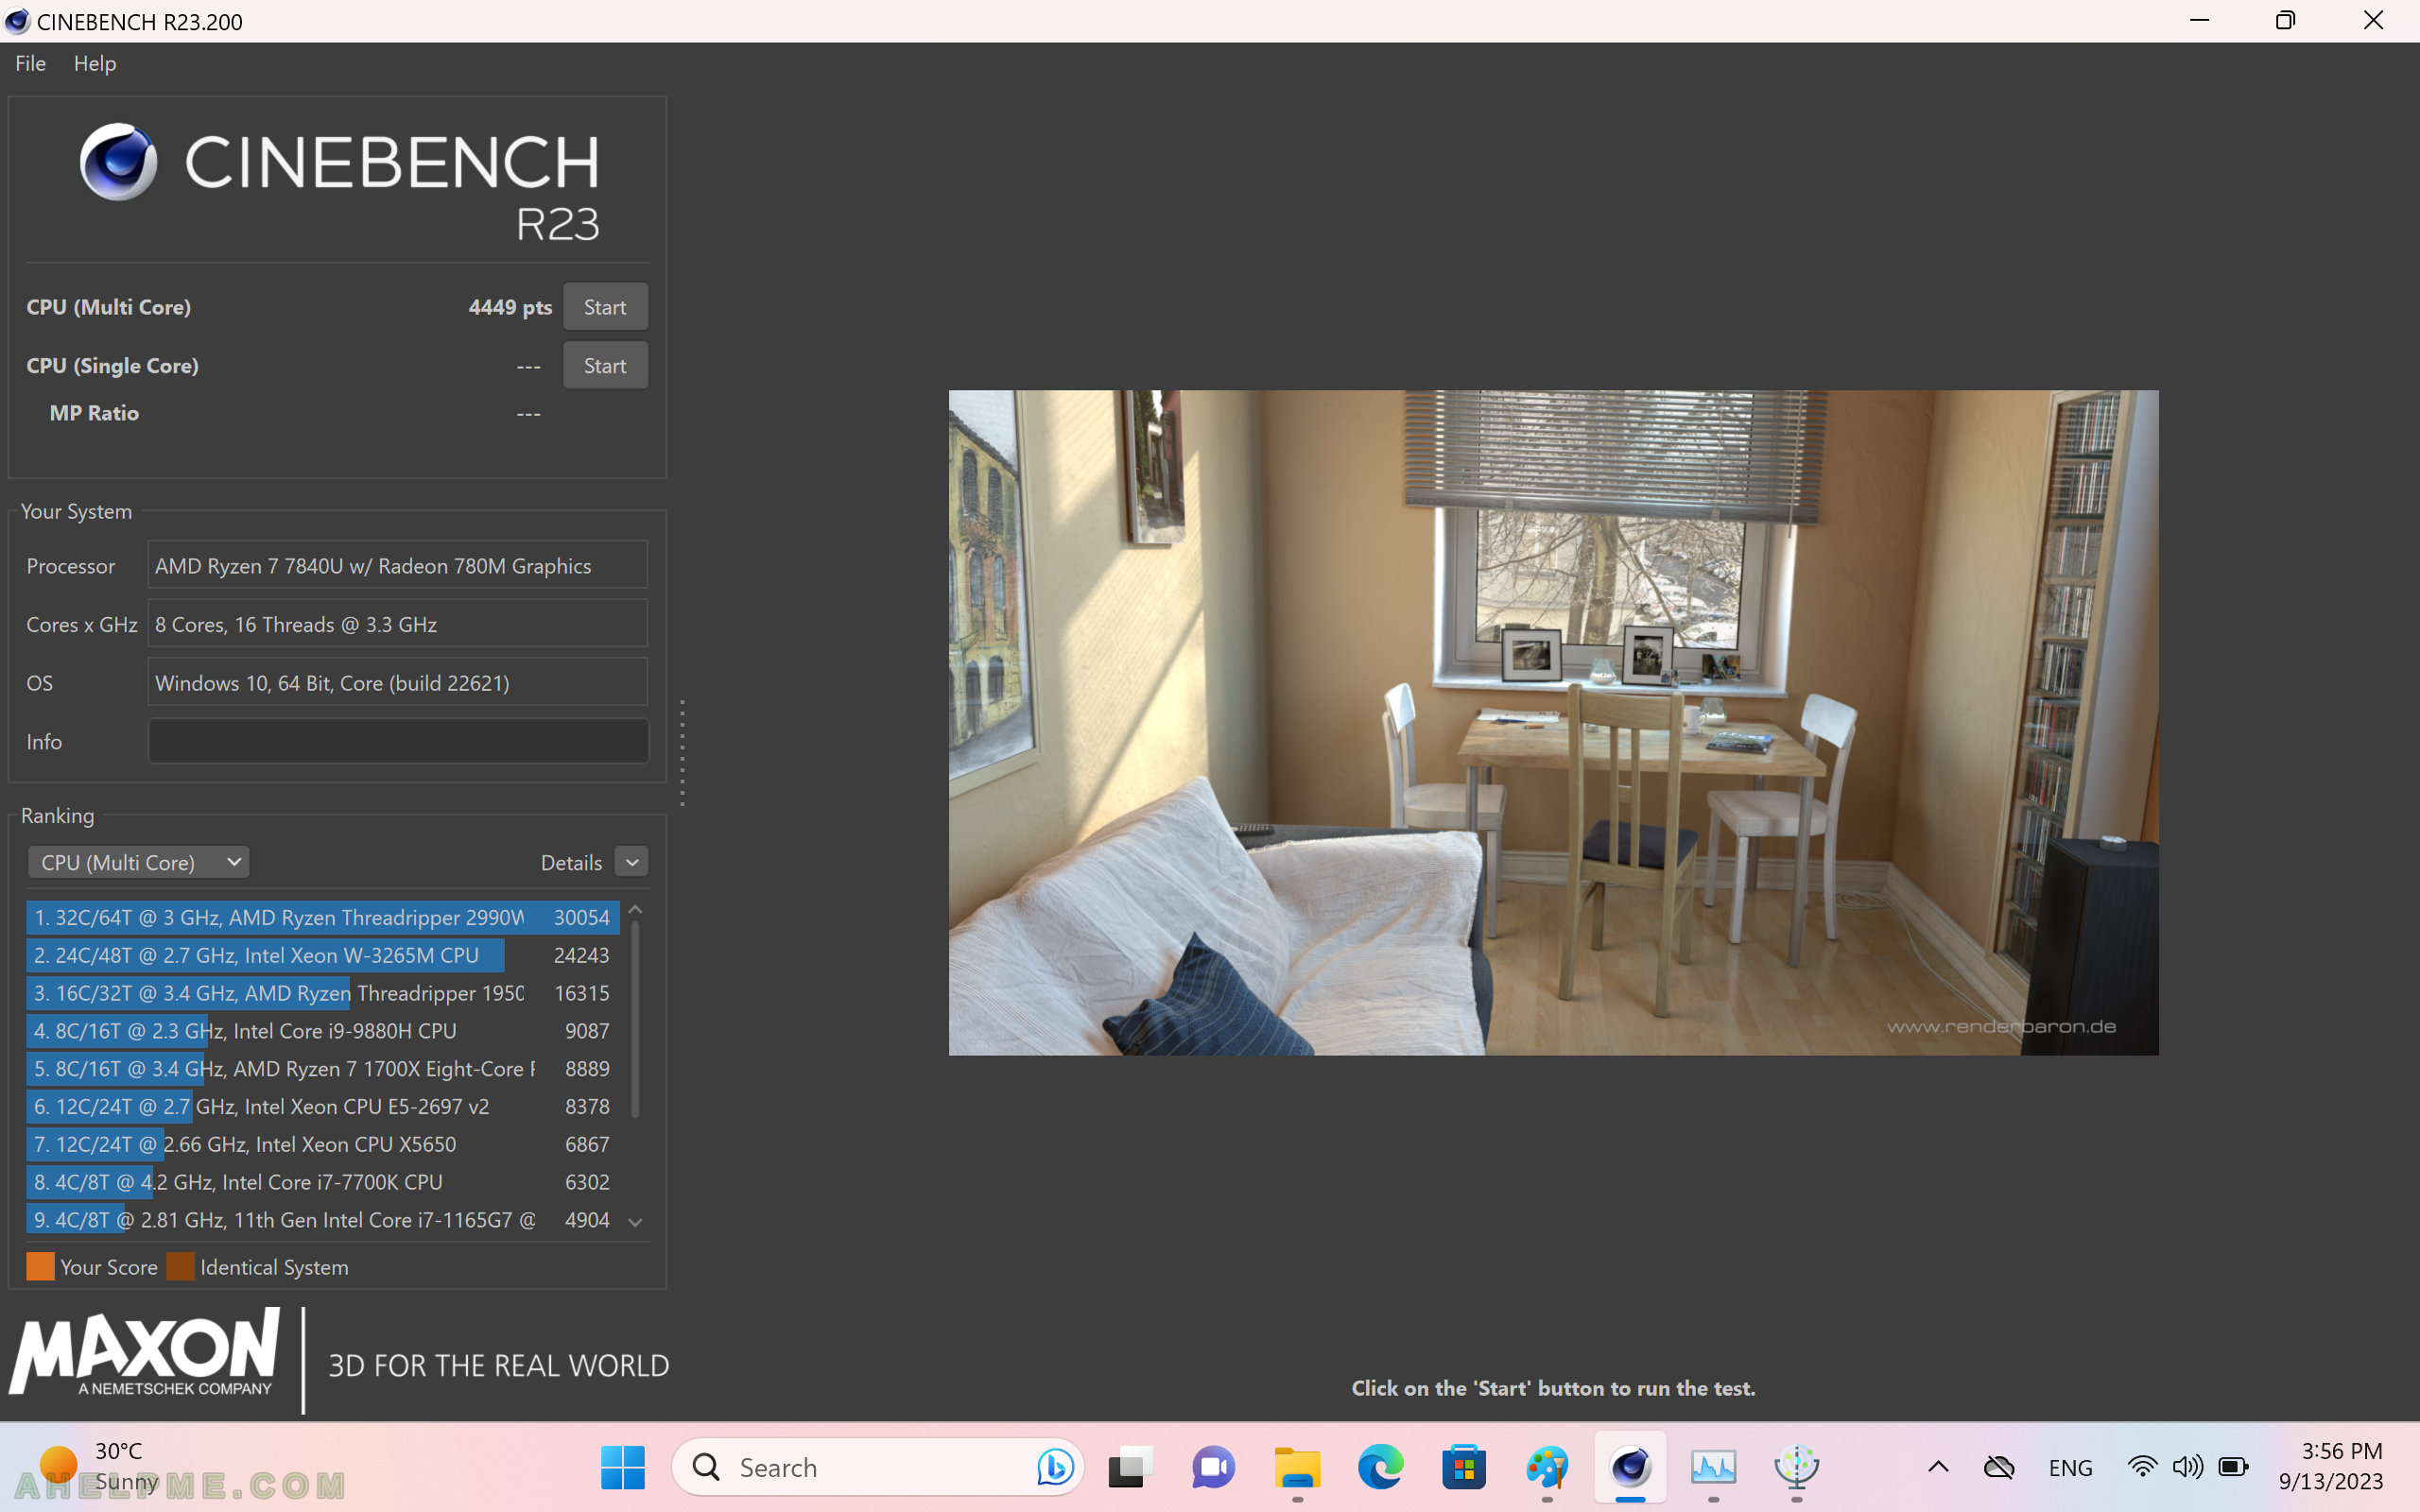
SCREENSHOT 13) 8 watts TDP limit single core test with no FAN noise (2079 rpm) and CPU temperature 50.3’C.
The temperature is a little bit higher than the multi core test, probably because of the higher clock speed.
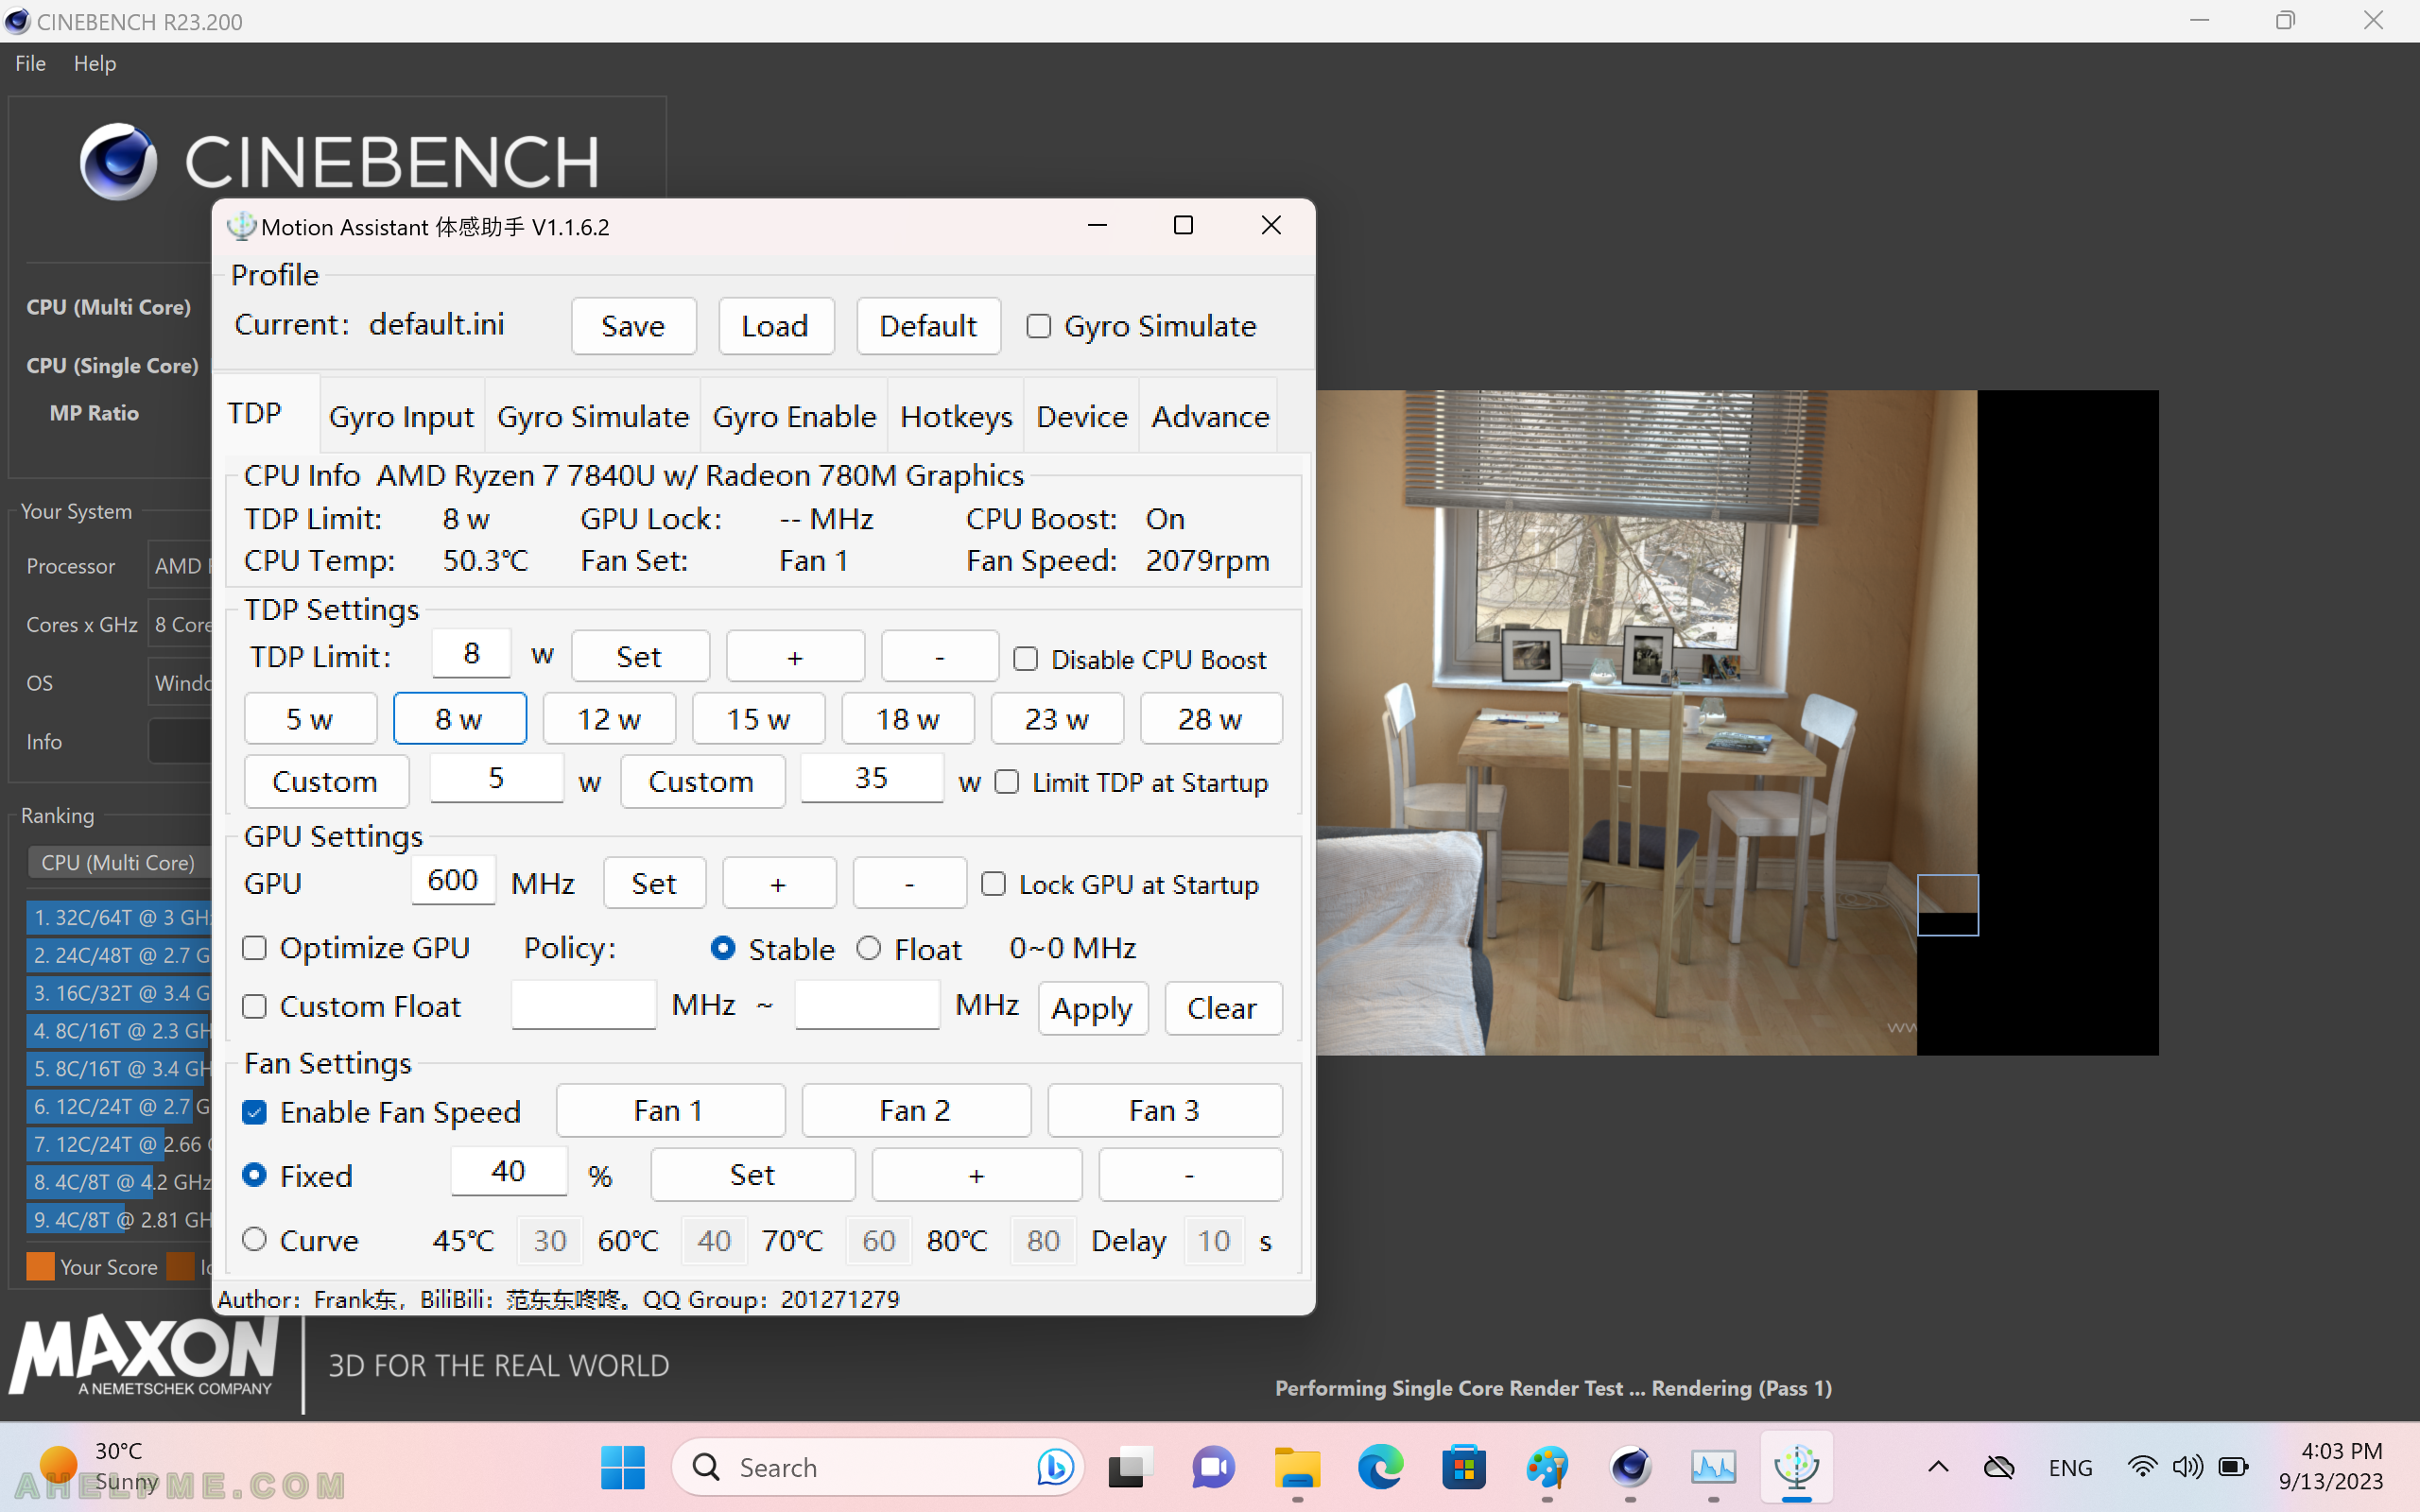
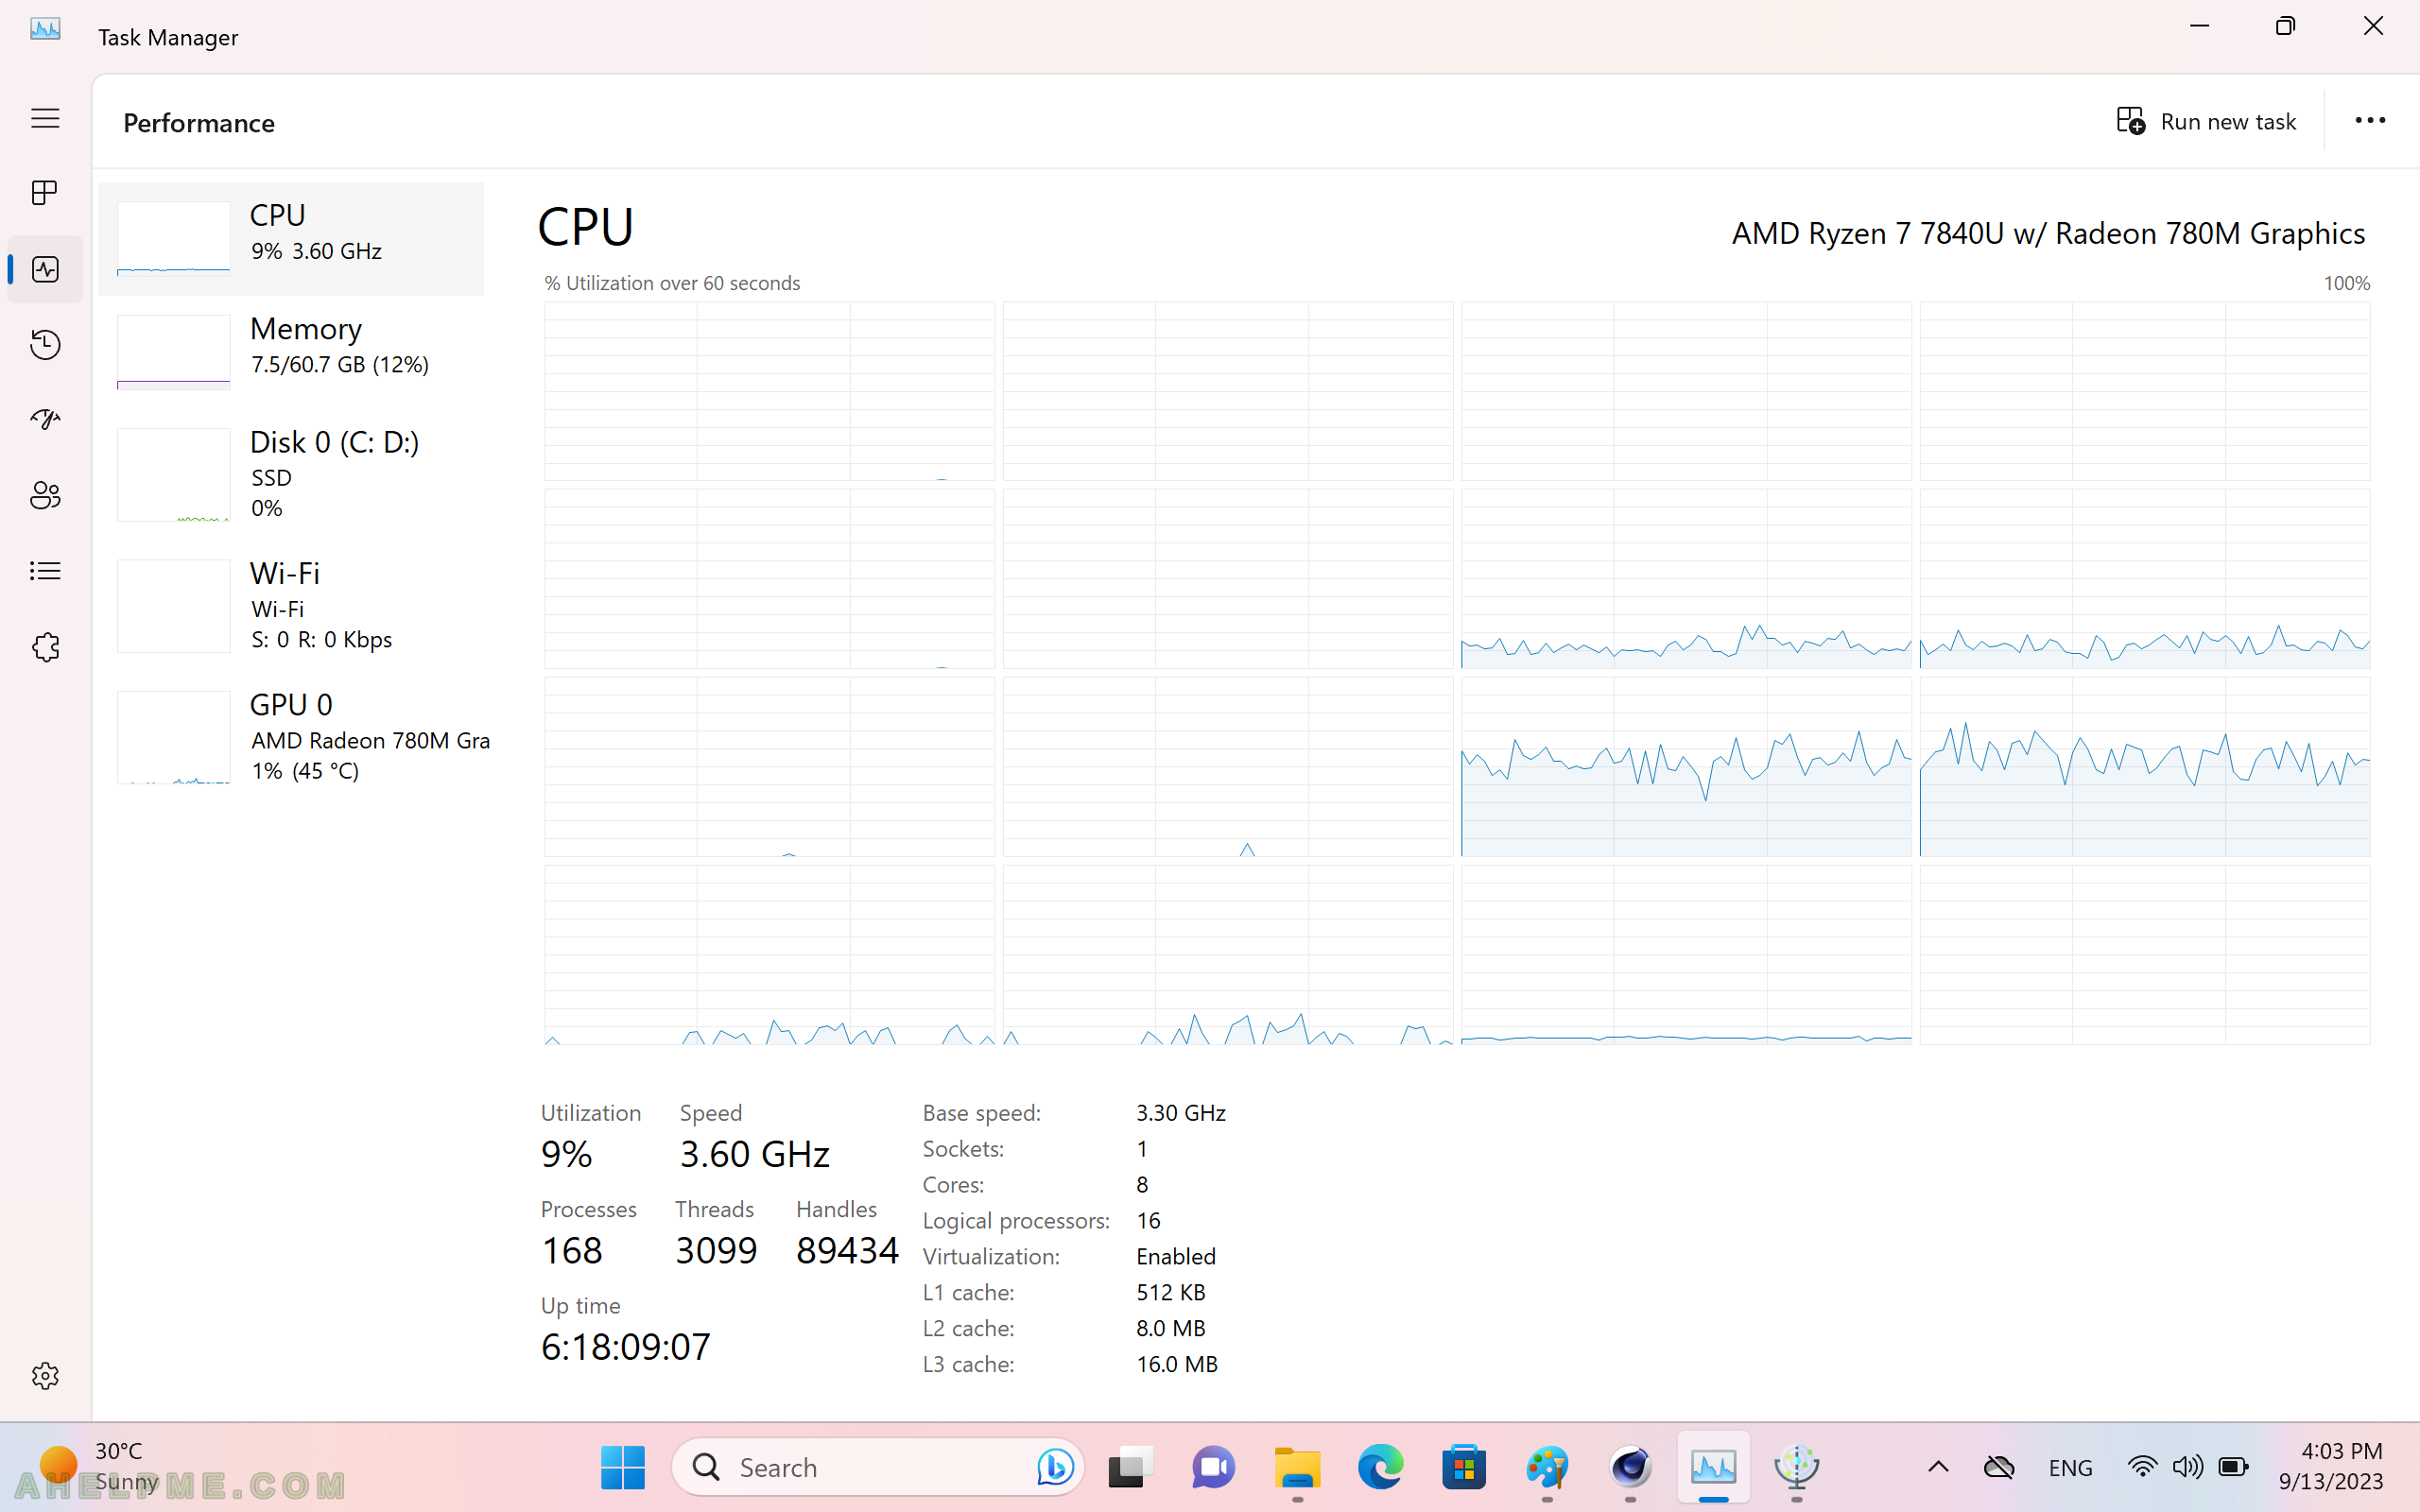
SCREENSHOT 14) The task manager shows 4 cores are mainly used with limited CPU speed of 3.60 GHz.
The system utilization is only 9%. 7 CPUs seem parked and they have no graphs at all.
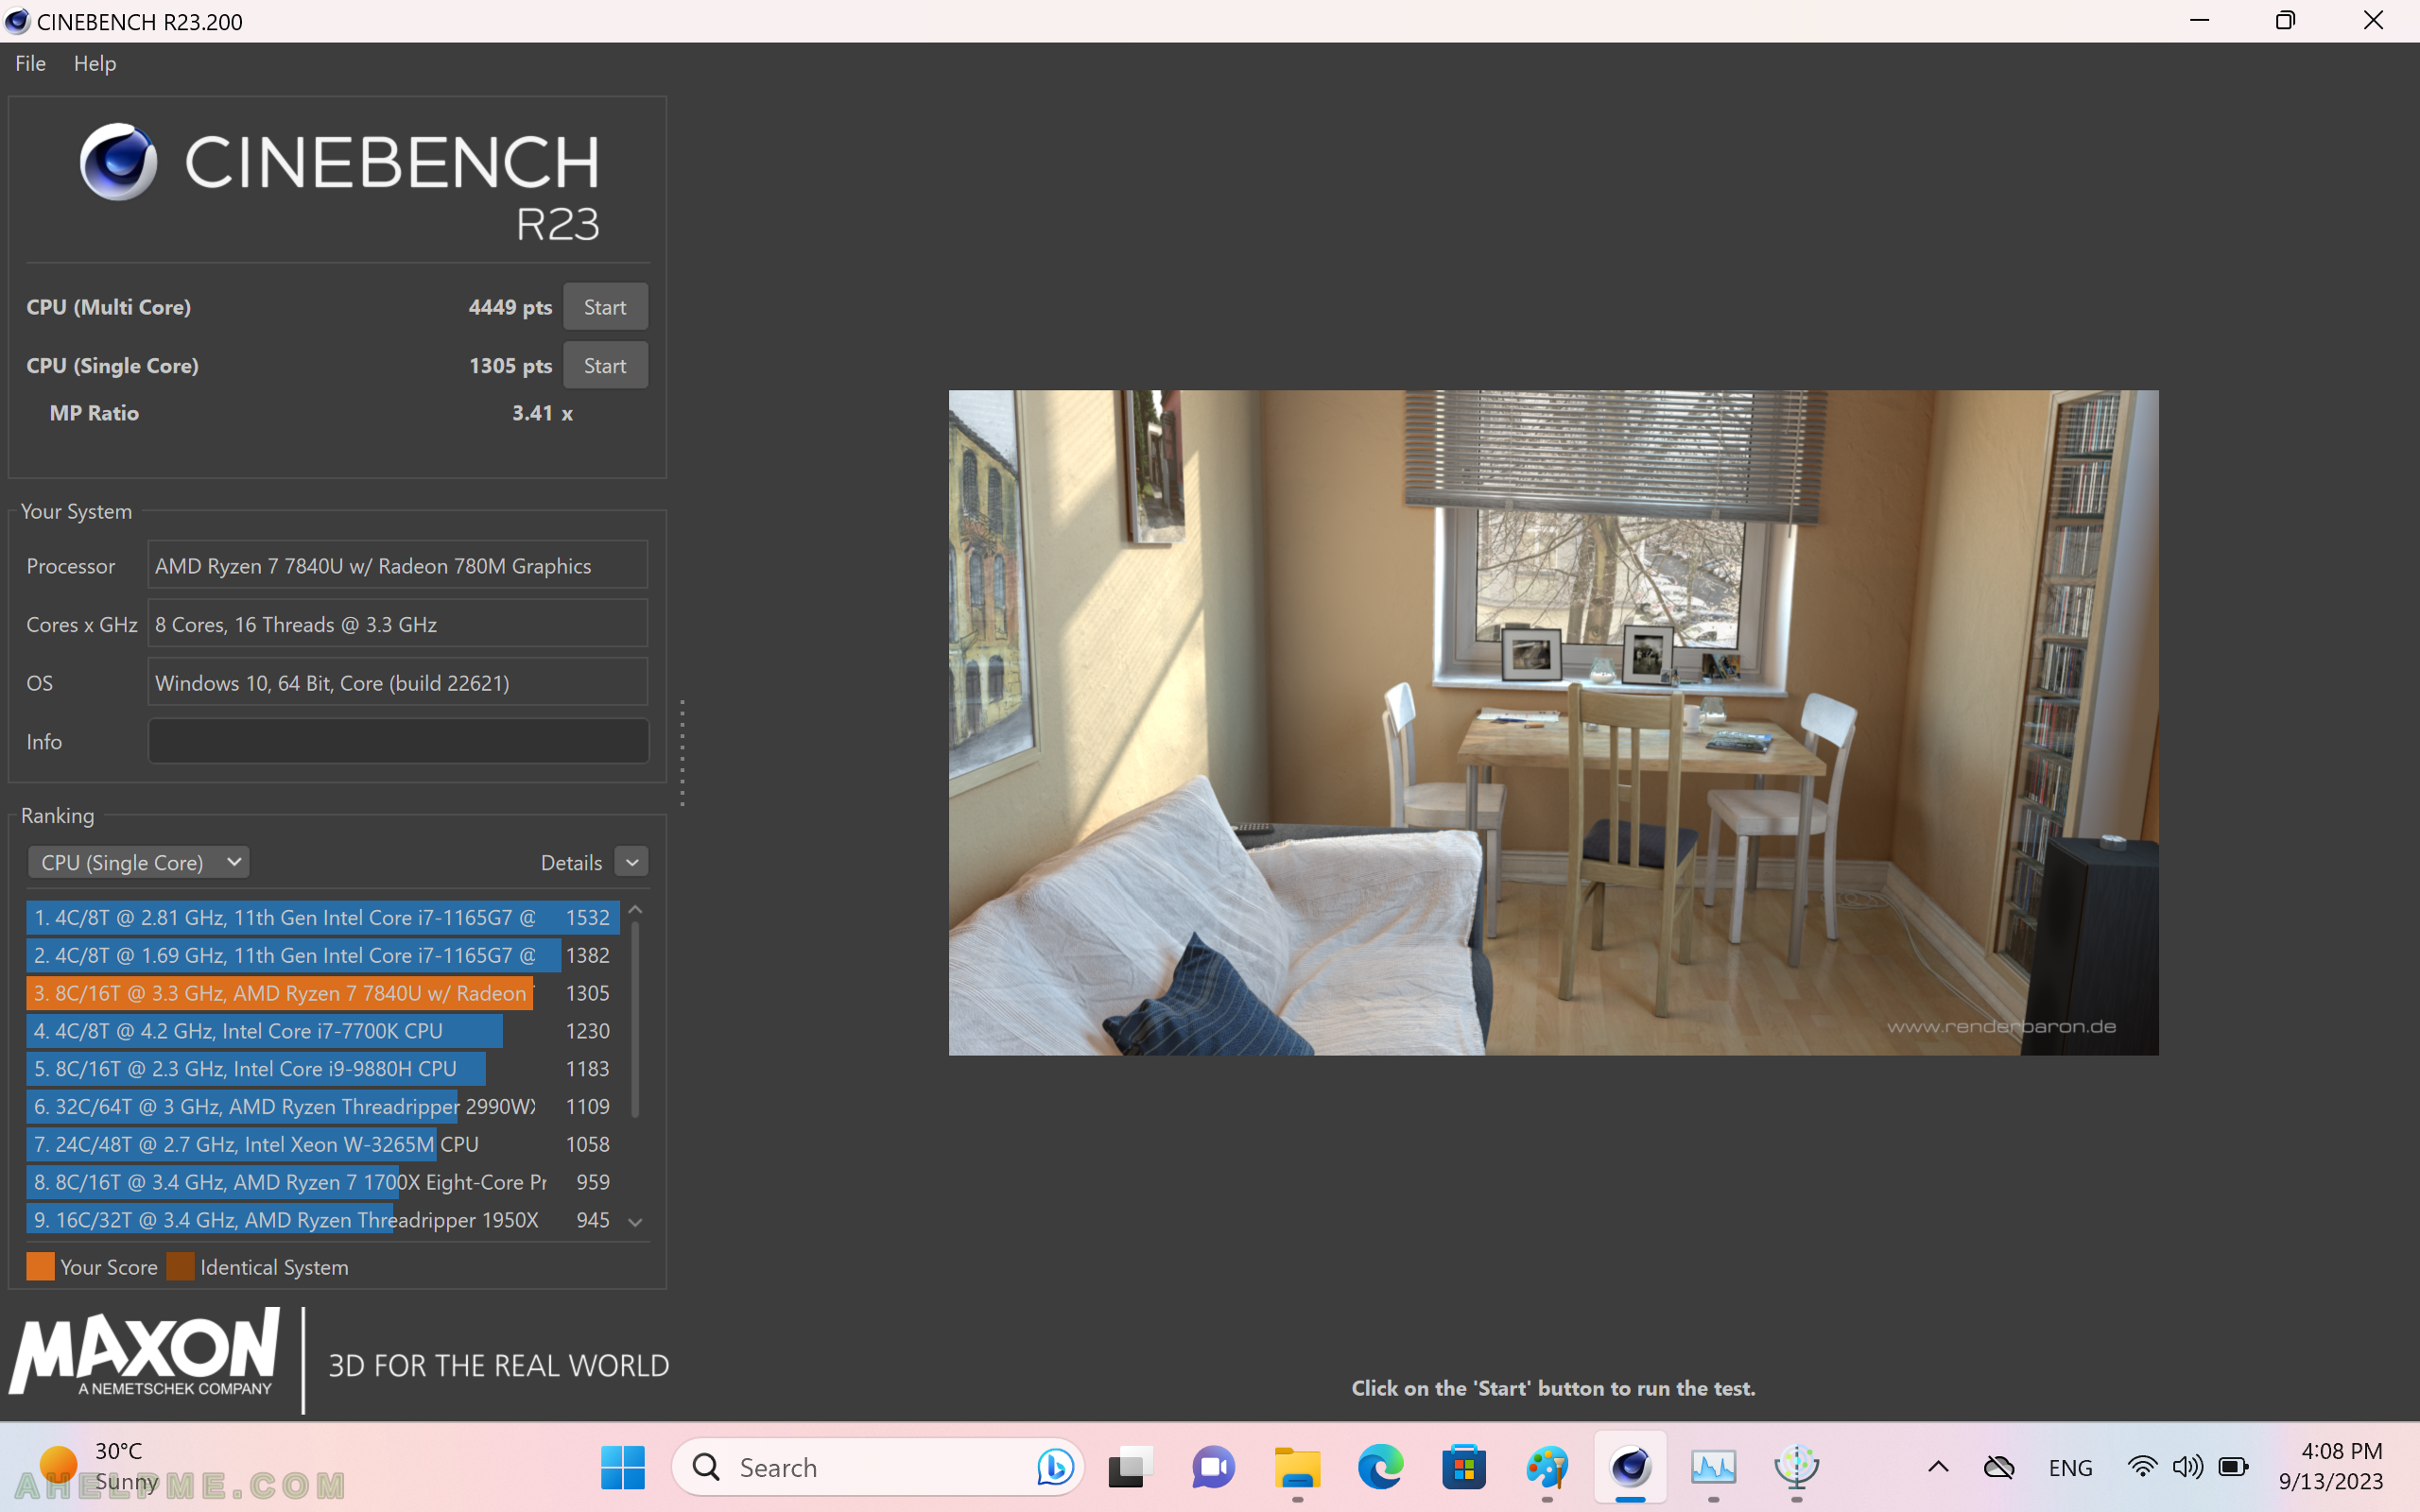
SCREENSHOT 15) The Cinebench r23 8 watts TDP limit single core test points are 130, which is the maximum points, which this CPU can reach.
No higher results with higher TDP for the single core.
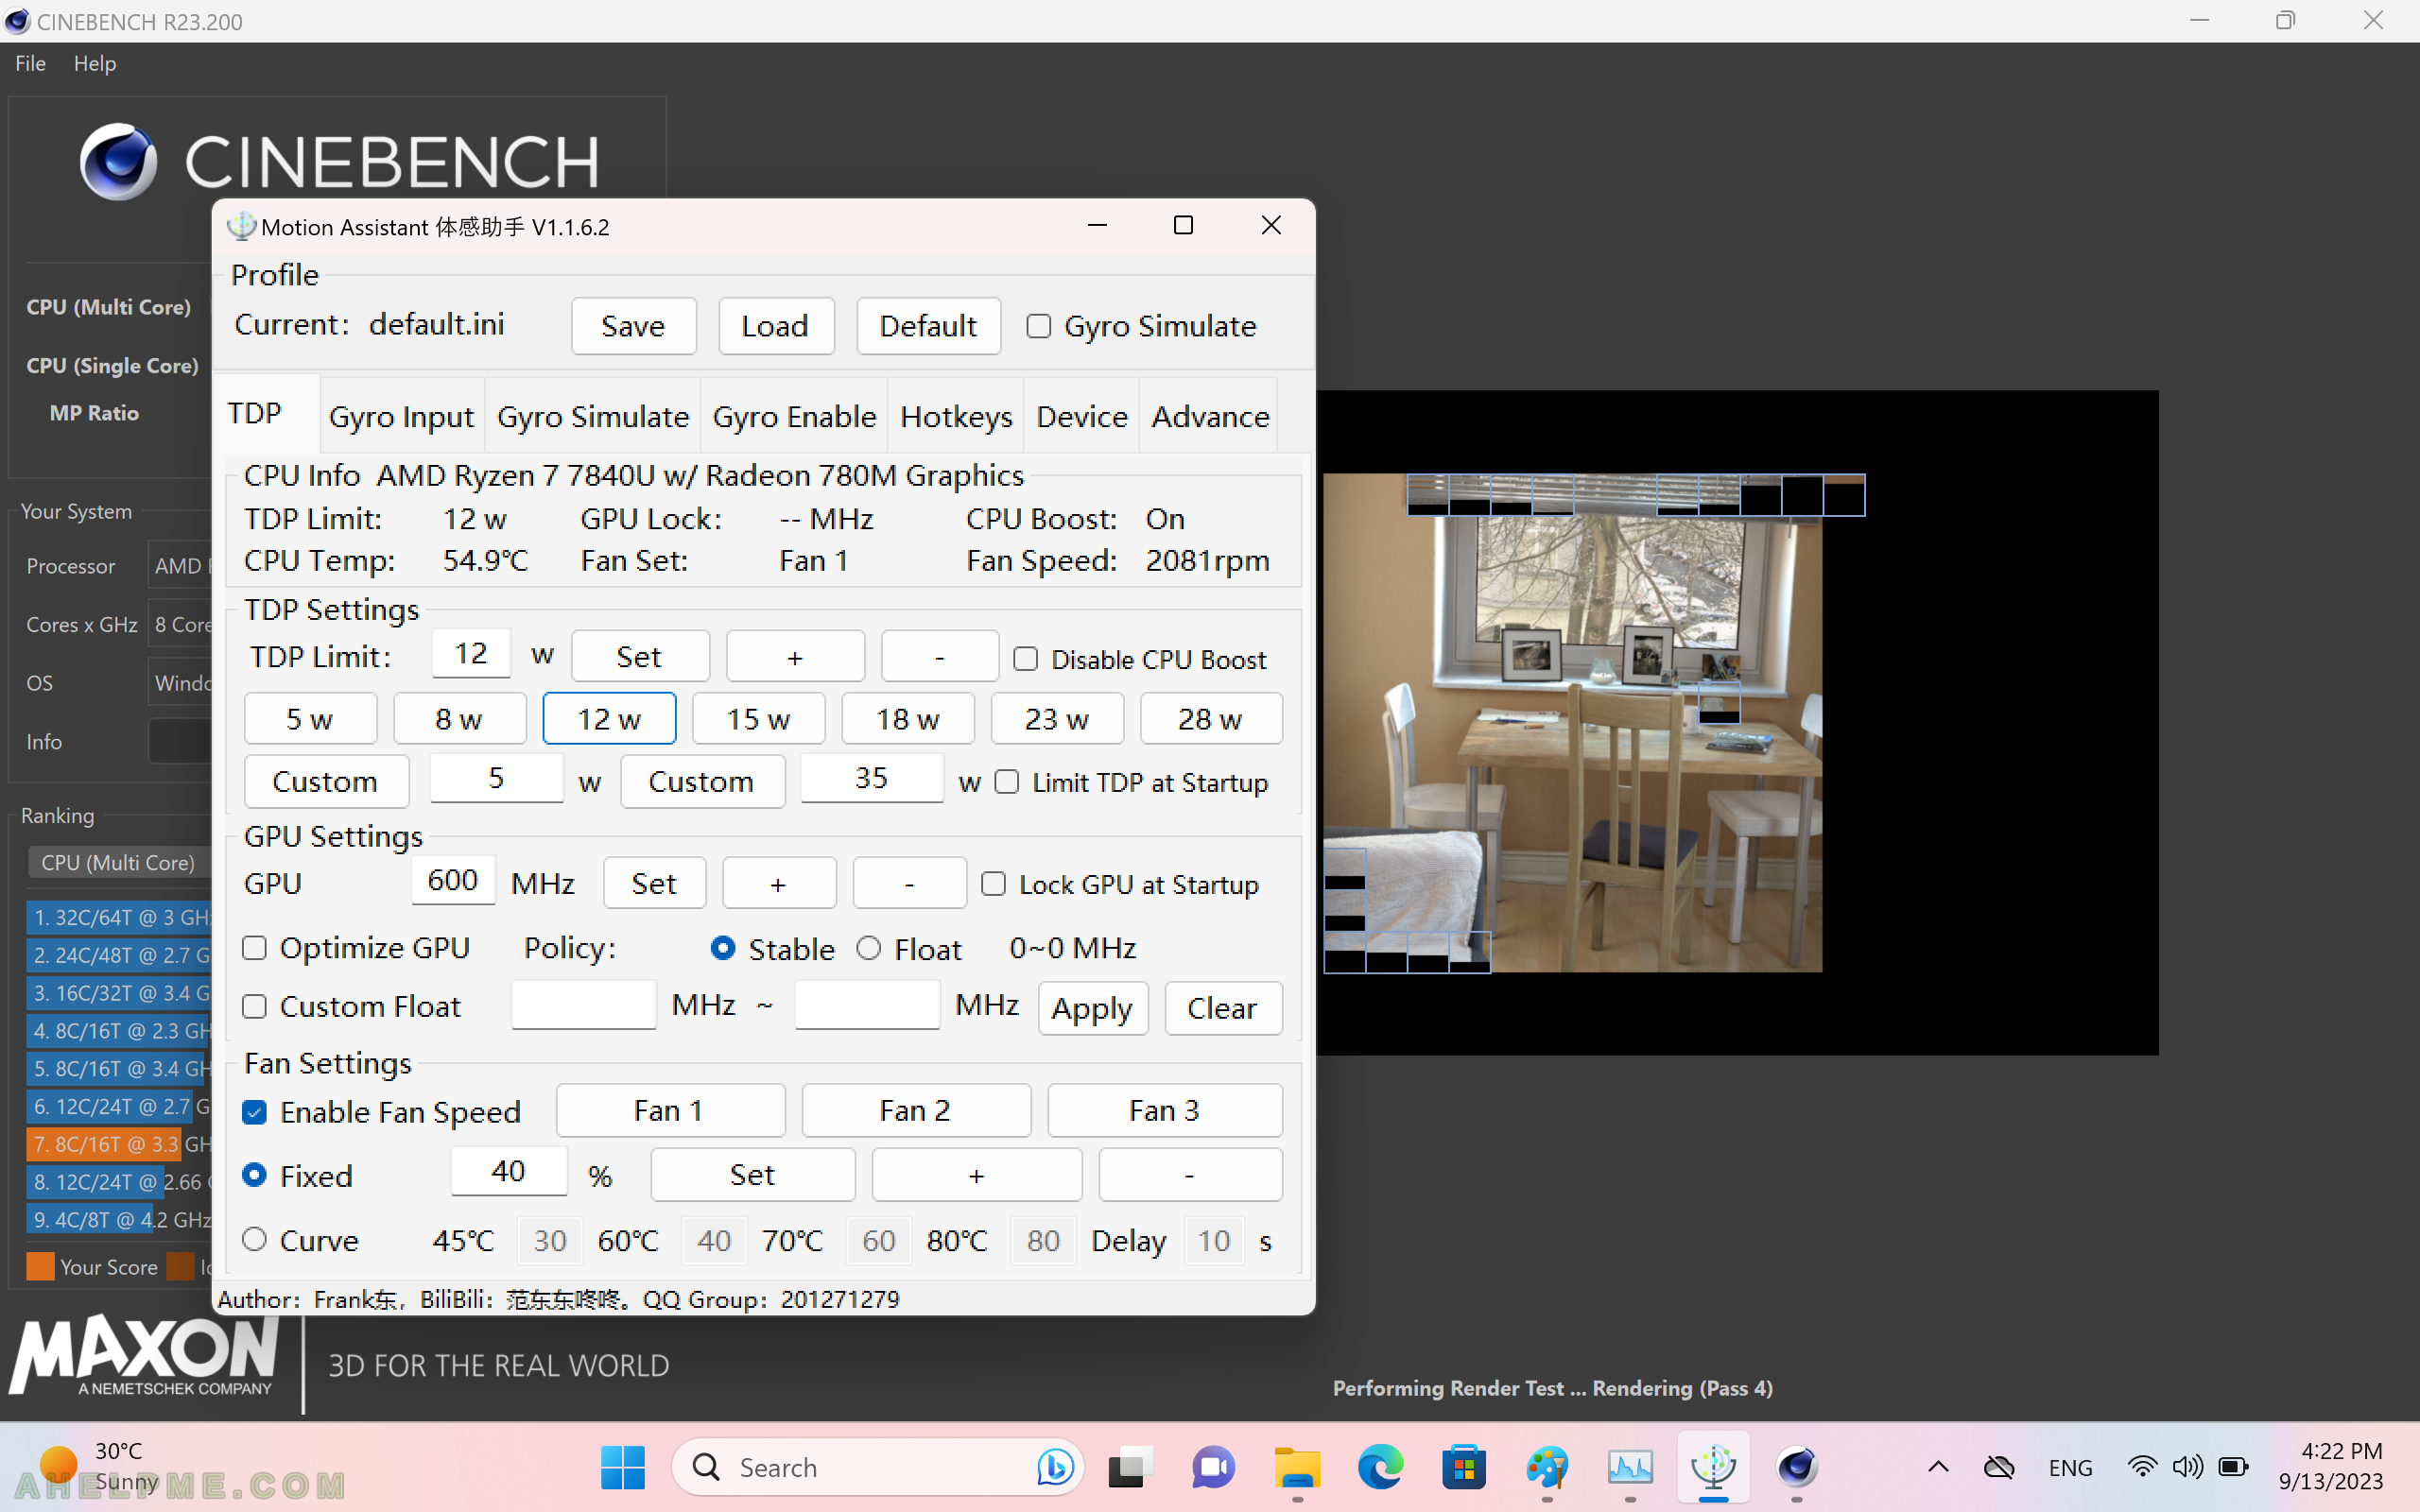
SCREENSHOT 16) 12 watts TDP limit multi core test with no FAN noise (2081 rpm) and CPU temperature 54.9’C.
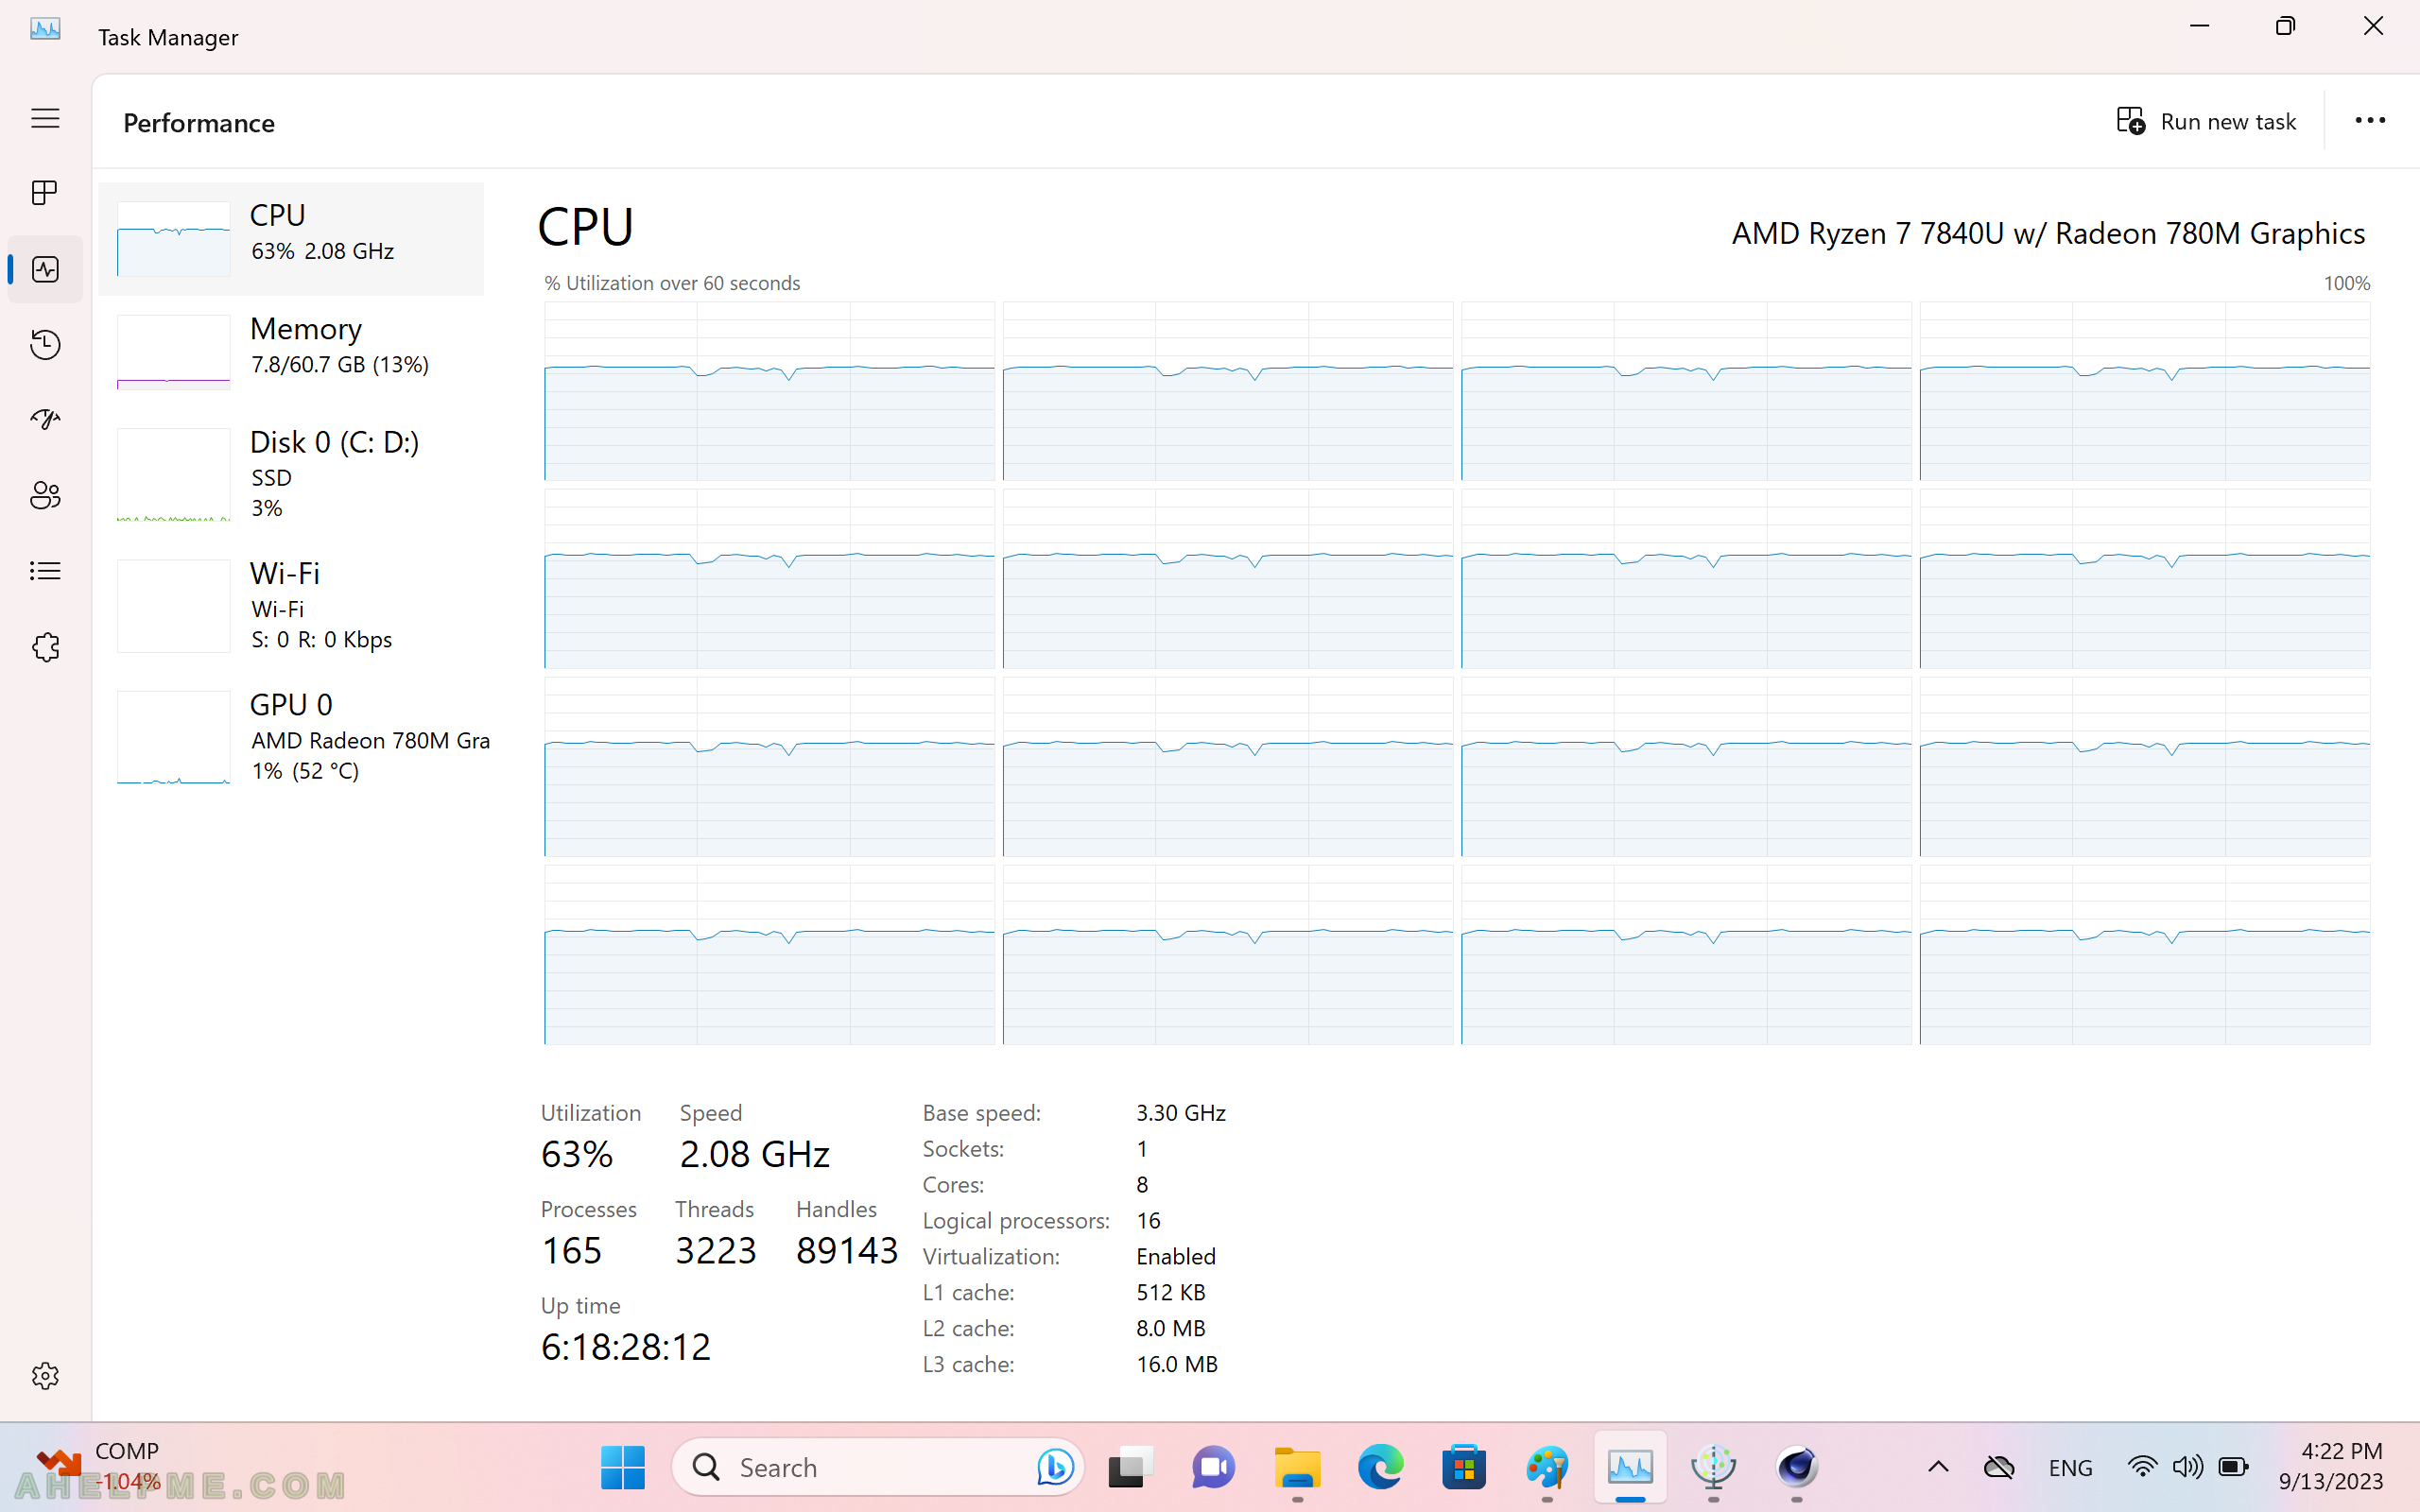
SCREENSHOT 17) The task manager shows all cores are used, but with limited CPU speed of 2.08 GHz.
The system utilization is only 63% and the CPU temperature is just 54.9’C.
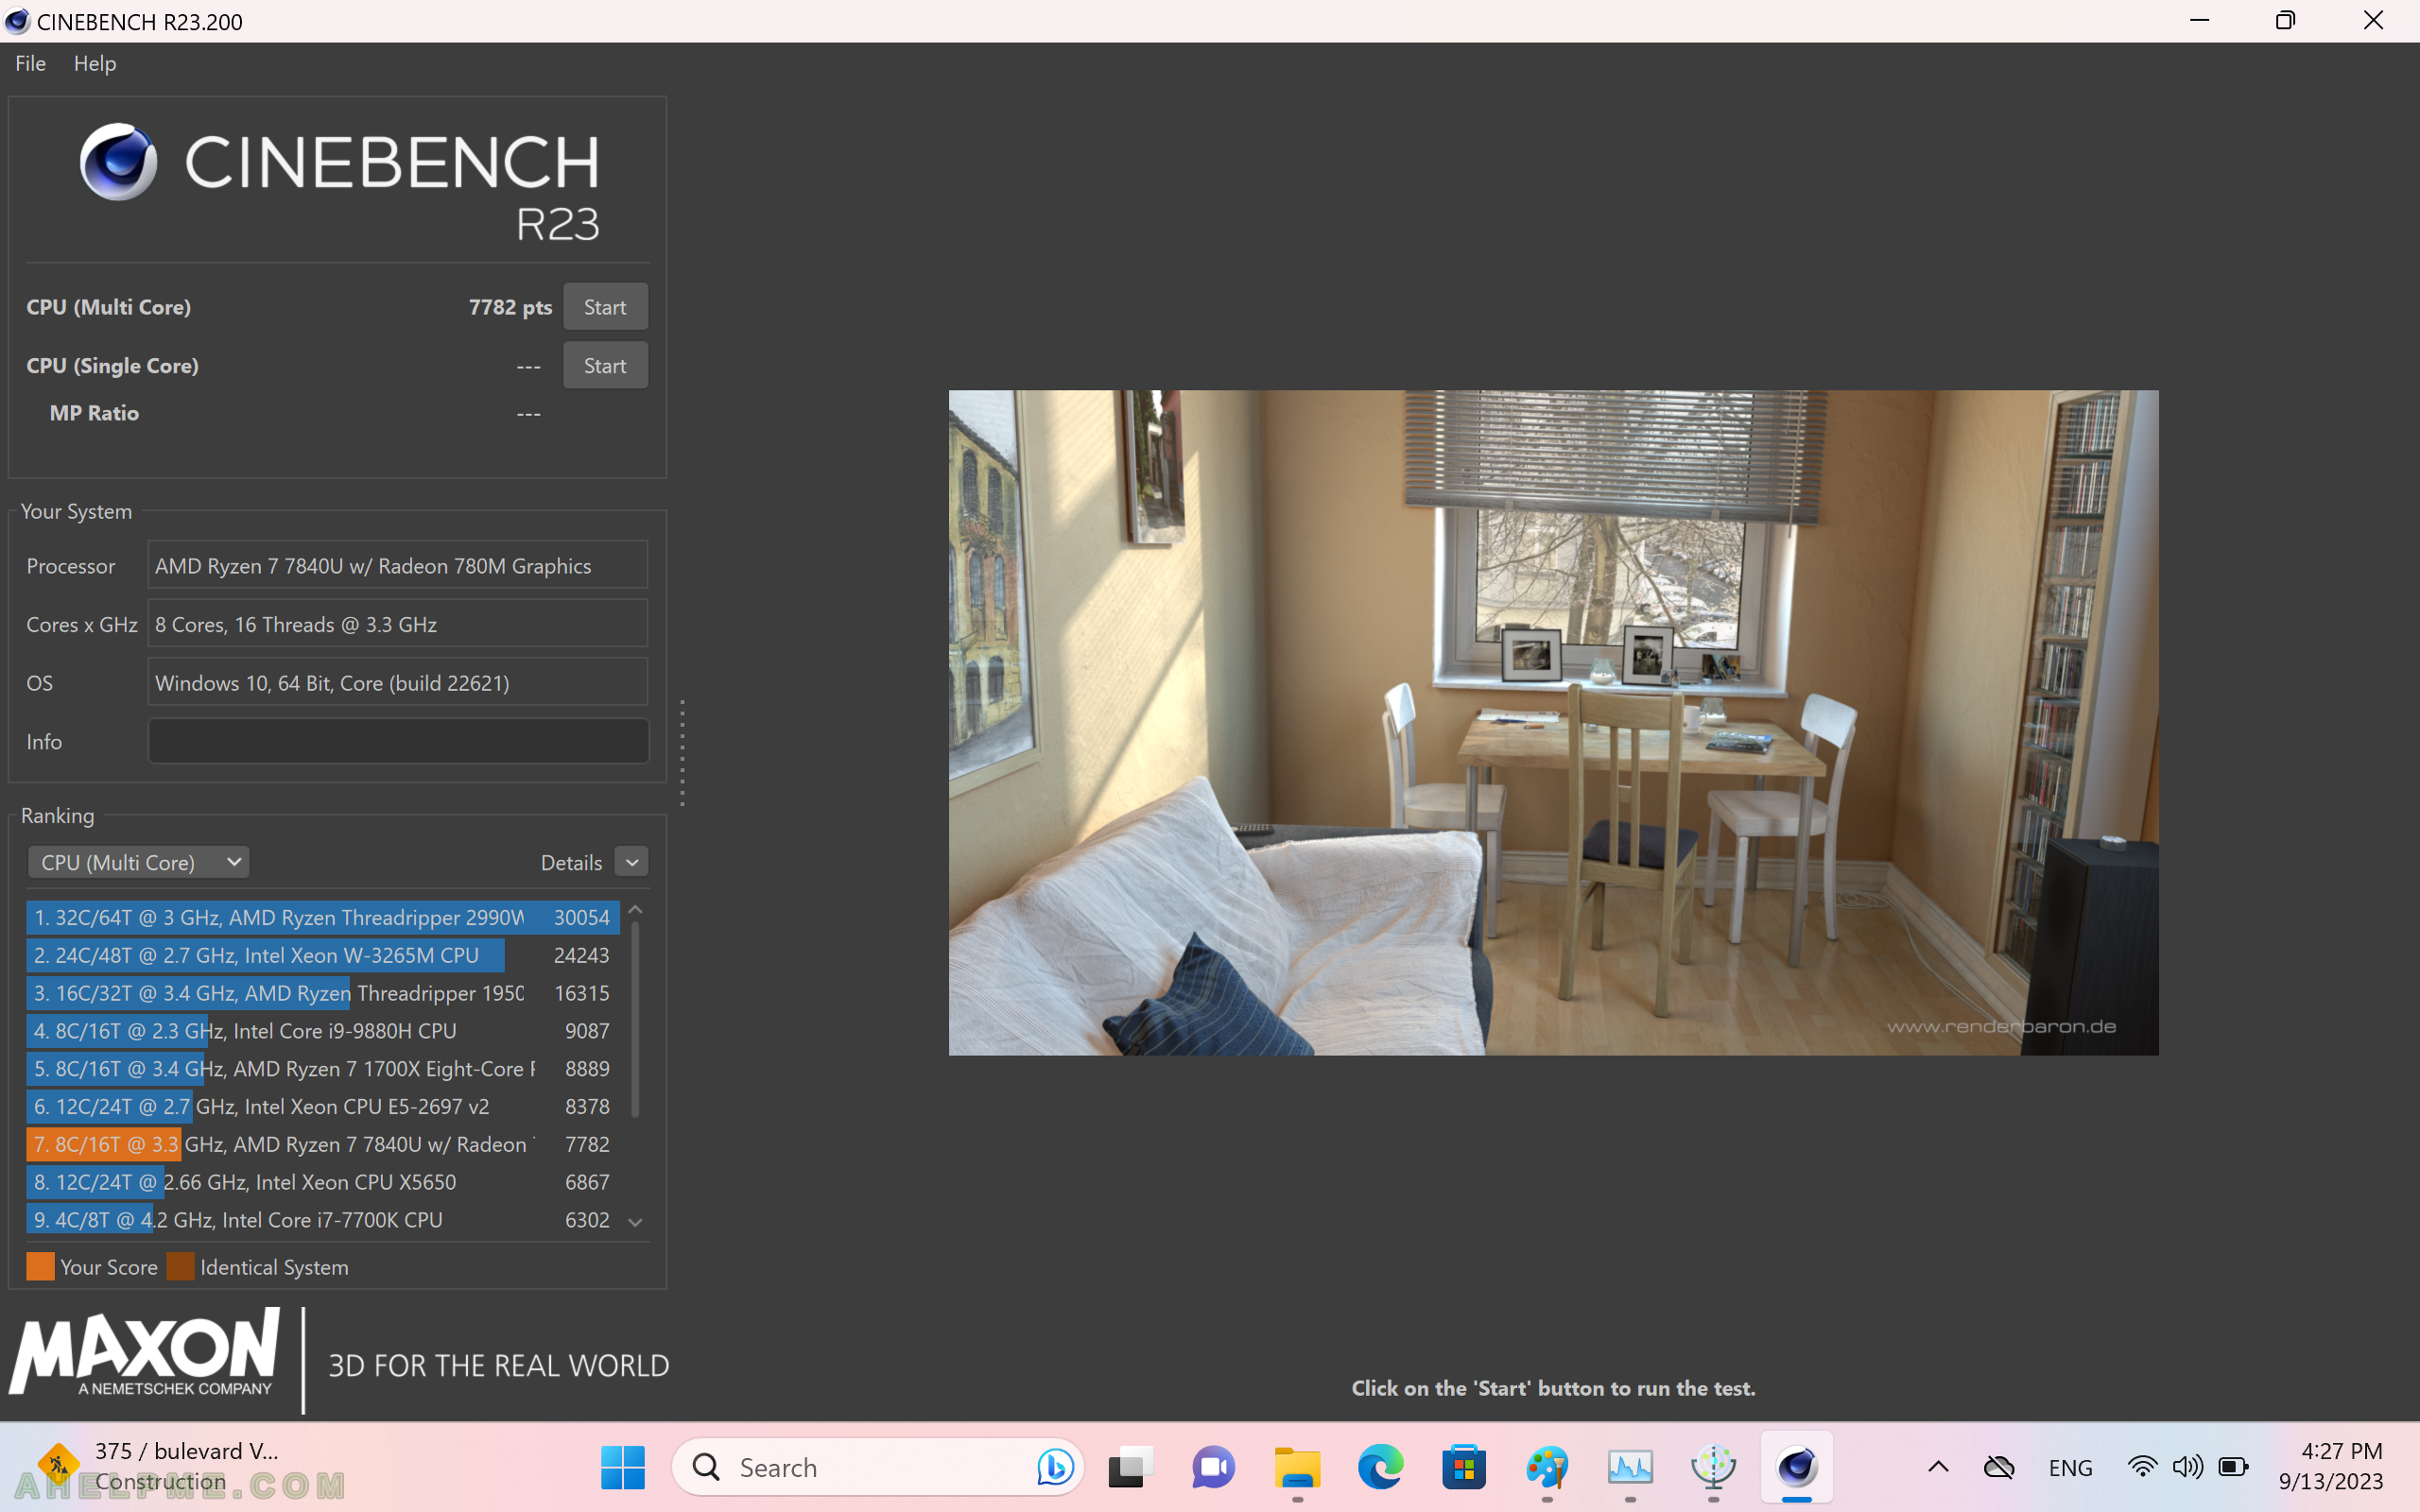
SCREENSHOT 18) The Cinebench r23 12 watts TDP limit multi core test points are 7782.
Almost double of the previous 8 watts TDP.
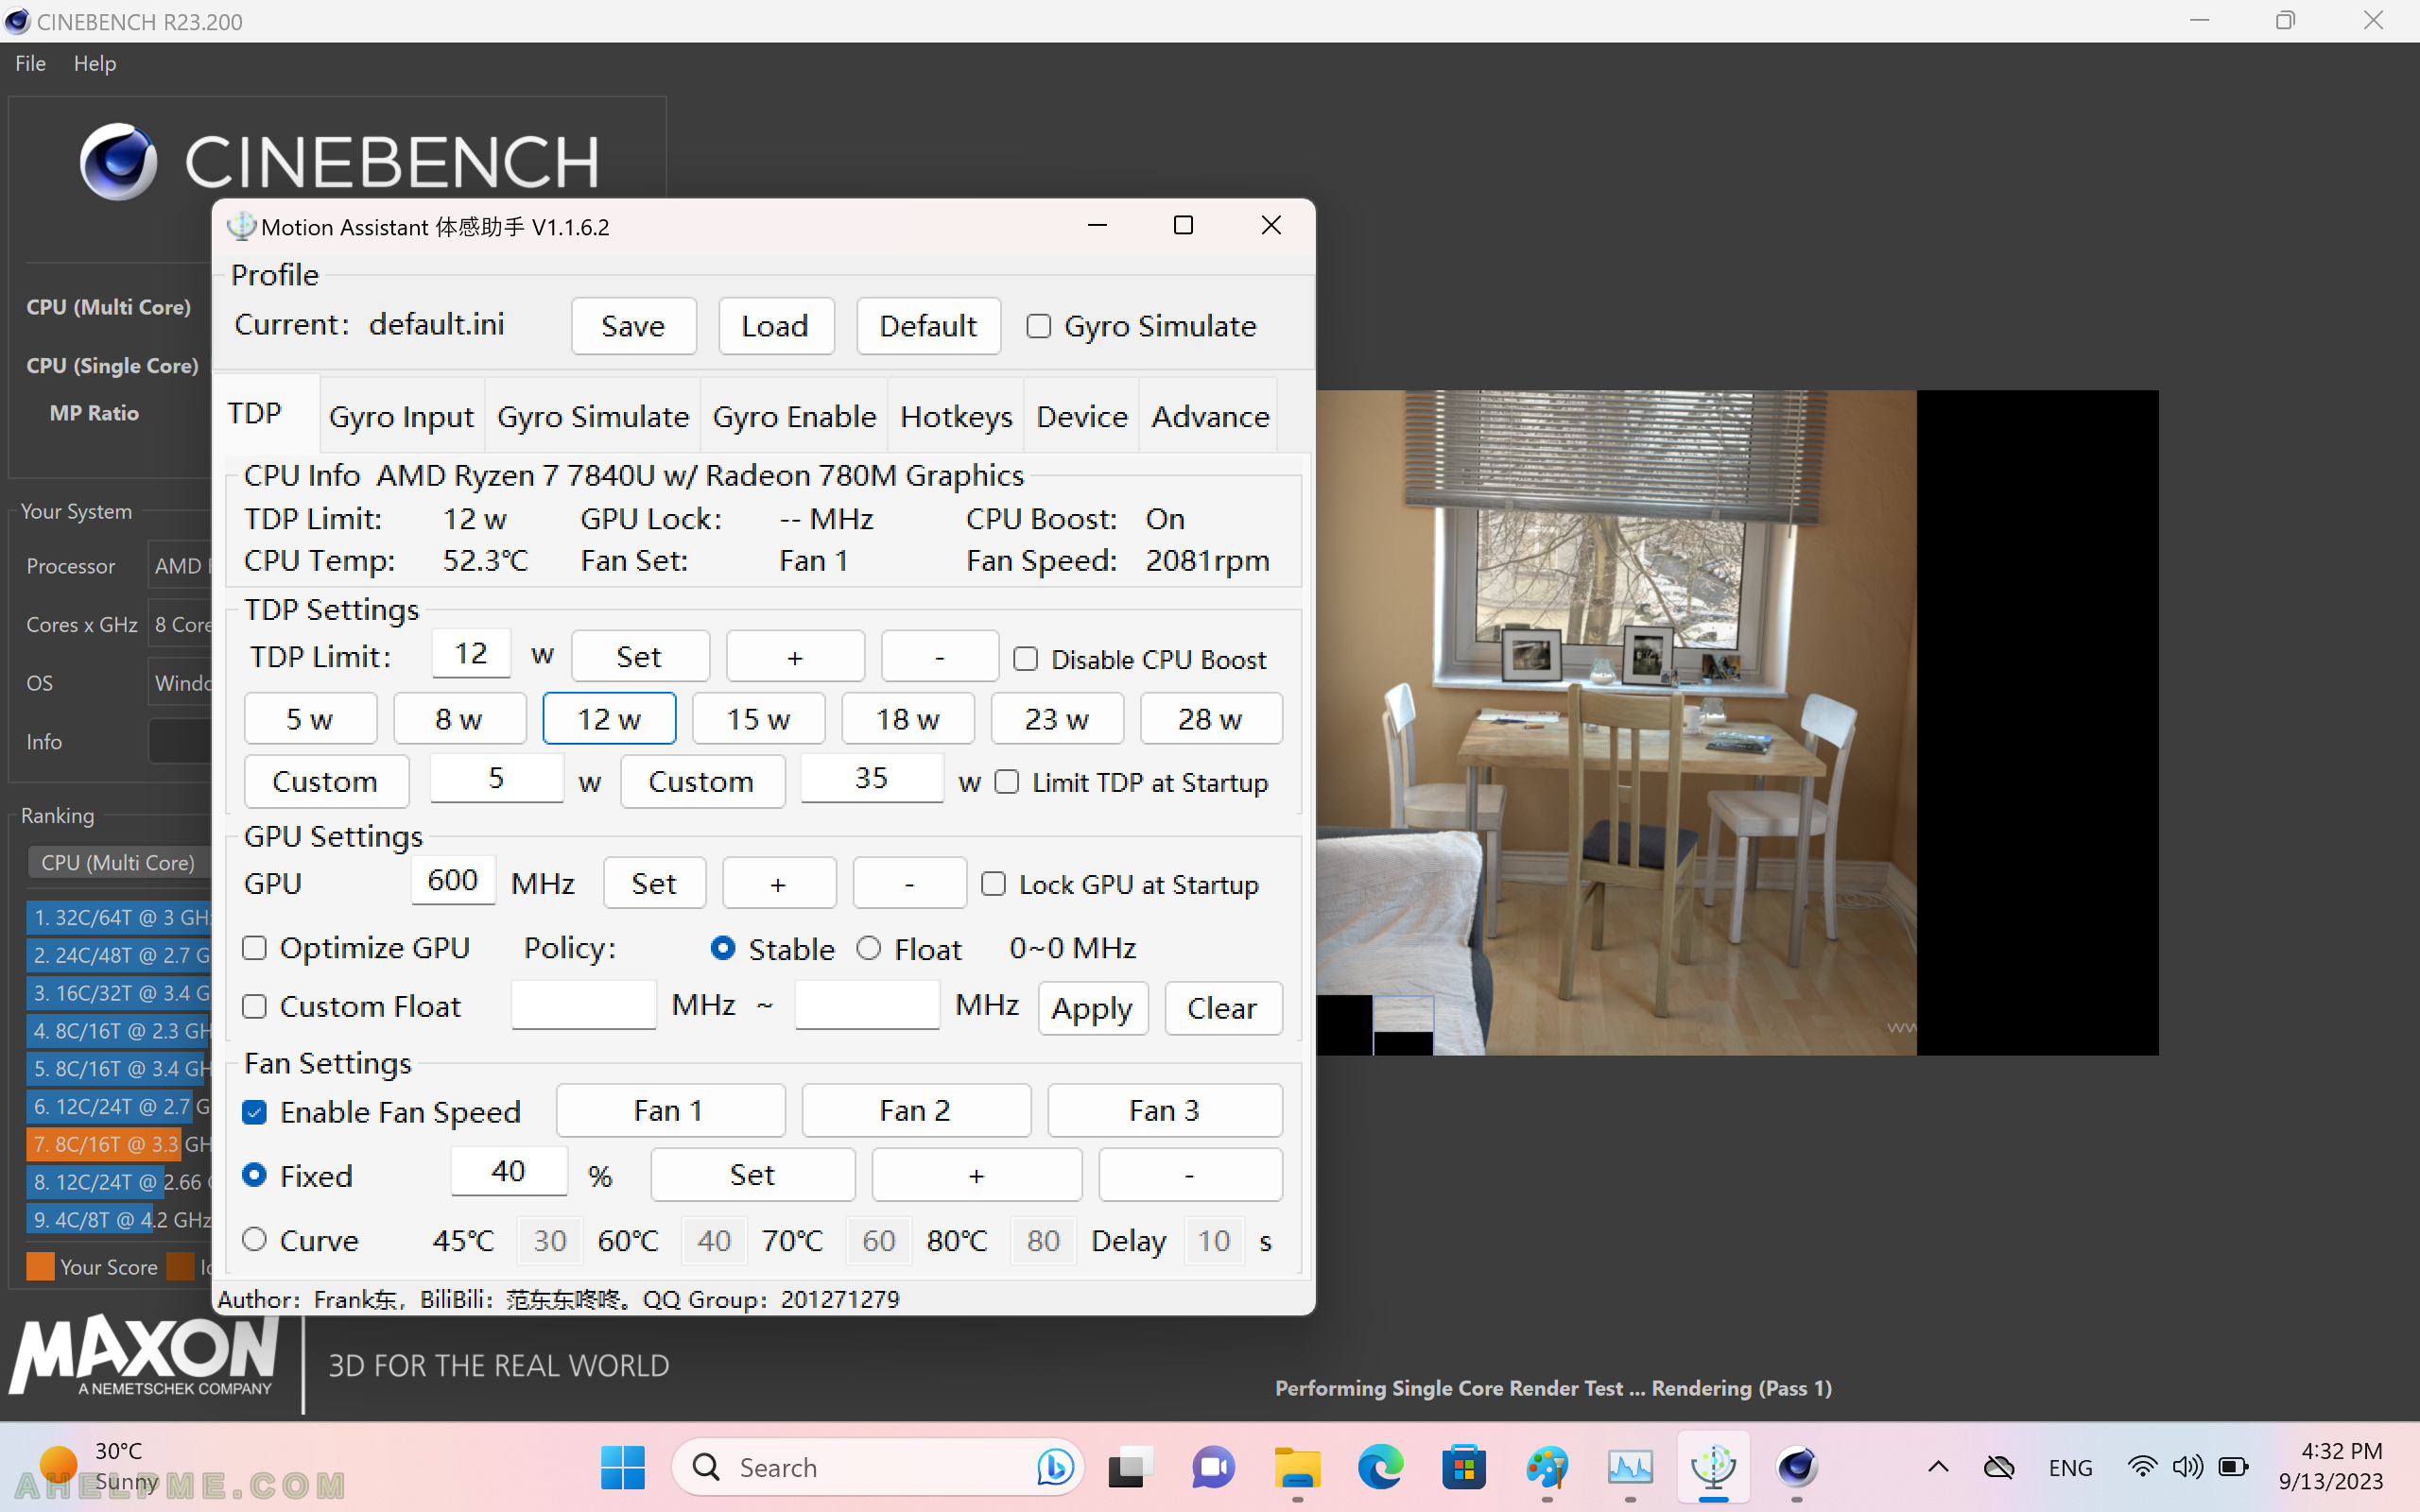
SCREENSHOT 19) 12 watts TDP limit single core test with no FAN noise (2081 rpm) and CPU temperature 52.3’C.
The temperature is a little bit higher than the multi core test, probably because of the higher clock speed.
SCREENSHOT 20) The task manager shows 4 cores are mainly used with limited CPU speed of 3.67 GHz.
The system utilization is only 9%. 9 CPUs seem parked and they have no graphs at all.
