Using the Nginx virtual host traffic status module you can have extended live information for your proxy cache module and the proxy cache upstream servers. We have covered the topic of how to install the module here – Install Nginx virtual host traffic status module – traffic information in Nginx and more per server block and upstreams and this article is just to show you what information you could have using the module with proxy cache (and the upstream servers) module.
In general, there is no live information about Nginx proxy cache. Of course, by the space it is occupied in the disk you can guess how much space is taken by your Nginx cache (or when you restart or upgrade the Nginx it would reinitialize the cache and when finished the numbers would be written in the error log). With this module “Nginx virtual host traffic status module” – https://github.com/vozlt/nginx-module-vts you would have additional status information page containing information for the proxy cache module (we included only for the proxy cache here, for more look at the other article mentioned above), too:
Per upstream server
- state – up, down, backup server and so on.
- Response Time – the time the server responded last time. You can use this to see how far away is your server and to detect problems with your upstreams connectivity.
- Weight – the weight of the server in the group. It’s from the configuration file.
- Max Fails – the max fail attempts before it blacklists the upstream for “Fail Timeout” time. It’s from the configuration file.
- Fail Timeout – the time, which the server will be blacklisted and the time the all fails (from Max Fails) must occur. It’s from the configuration file.
- Requests – Total – from the start of the server, Req/s – Requests per second at the moment of loading the extended status page, Time.
- Responses – Total and split by error codes – 1xx, 2xx, 3xx, 4xx, 5xx.
- Traffic – Sent – total sent from the start of the server), Rcvd – total received from the start of the server, Sent/s – sent per second at the moment, Rcvd/s – received per second at the moment.
Per cache – i.e. key zone name
- Size – Capacity – the capacity from the configuration file, Used – used space lively updated! With this you can have access to the used space of your zones with only loading a page – the extended status page of this module!
- Traffic – Sent – total sent from the start of the server, Rcvd – total received from the start of the server, Sent/s – sent per second at the moment, Rcvd/s – received per second at the moment.
- Cache – Miss, Bypass, Expired, Stale, Updating, Revalidated, Hit, Scarce, Total – they all are self-explanatory and all counters are from the start of the server.
You can compute the effectiveness of your cache for a period of time. For example, you can make different graphs based on this data for long periods and for different short periods like in peaks of off-peaks. We might have an article on the subject.
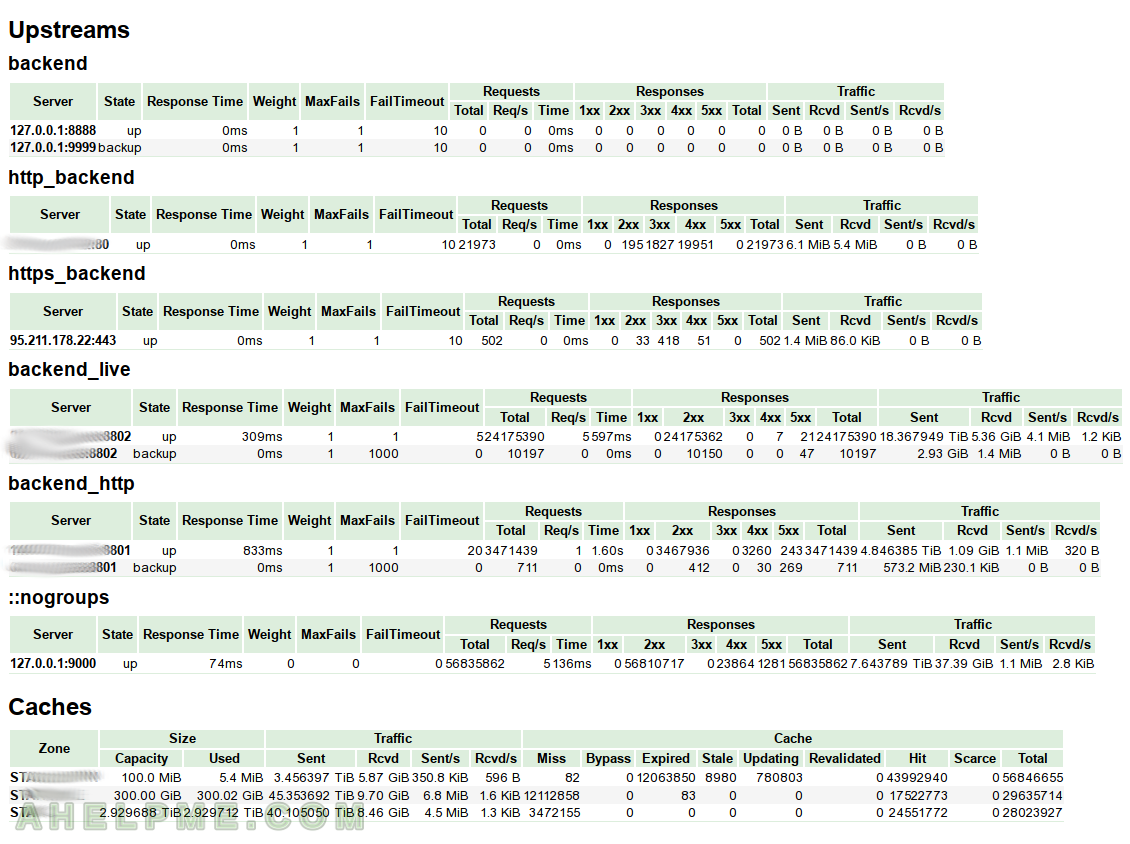
SCREENSHOT 1) Cache with three cache zones and two upstream servers – main and backup
As you can see our biggest zone has 2.92T occupied and it is 100% of the available space, so probably the cache manager is deleteing at the moment. The hits are 24551772 and the total is 28023927 so the ratio in percentages is 87.6%! 87.6% of the hits of this zone is servered by the server without the need of touching the upstream servers. In the first cache zone we have more aggressive time expiring, so there were 21% requests, which were updated.

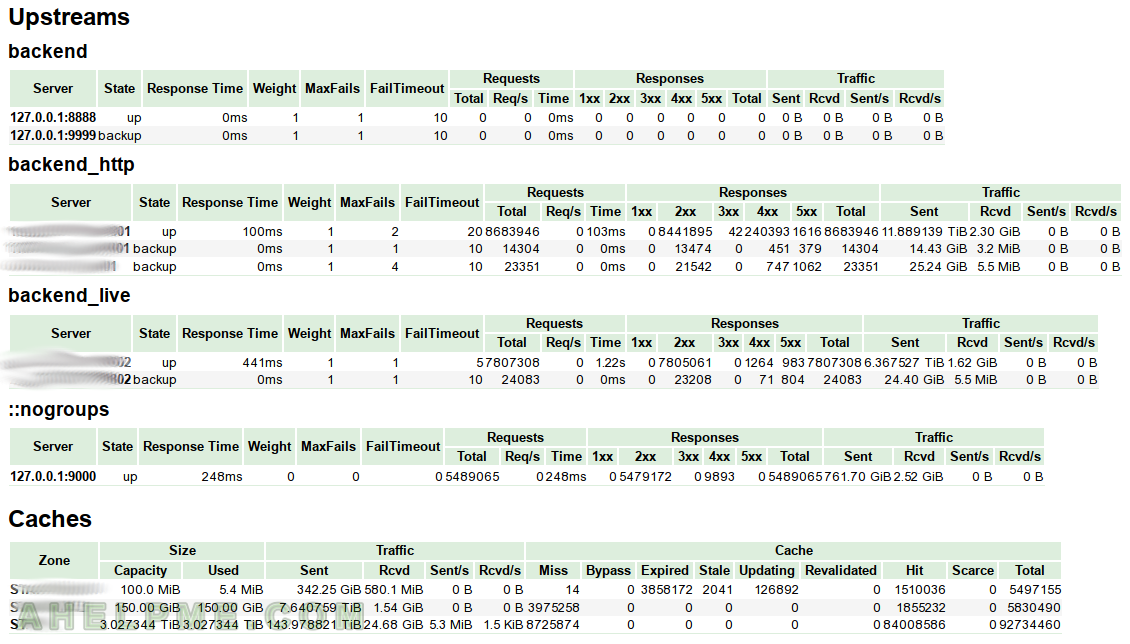
SCREENSHOT 2) Cache with three cache zones and three upstream servers – main and two backup servers
As you can see our biggest zone has 3.02T occupied and it is 100% of the available space, so probably the cache manager is deleteing at the moment. The hits are 84008586 and the total is 92734460 so the ratio in percentages is 90%! 90% of the hits of this zone is servered by the server without the need of touching the upstream servers. So many important graphs you can do with this information offered by this page!

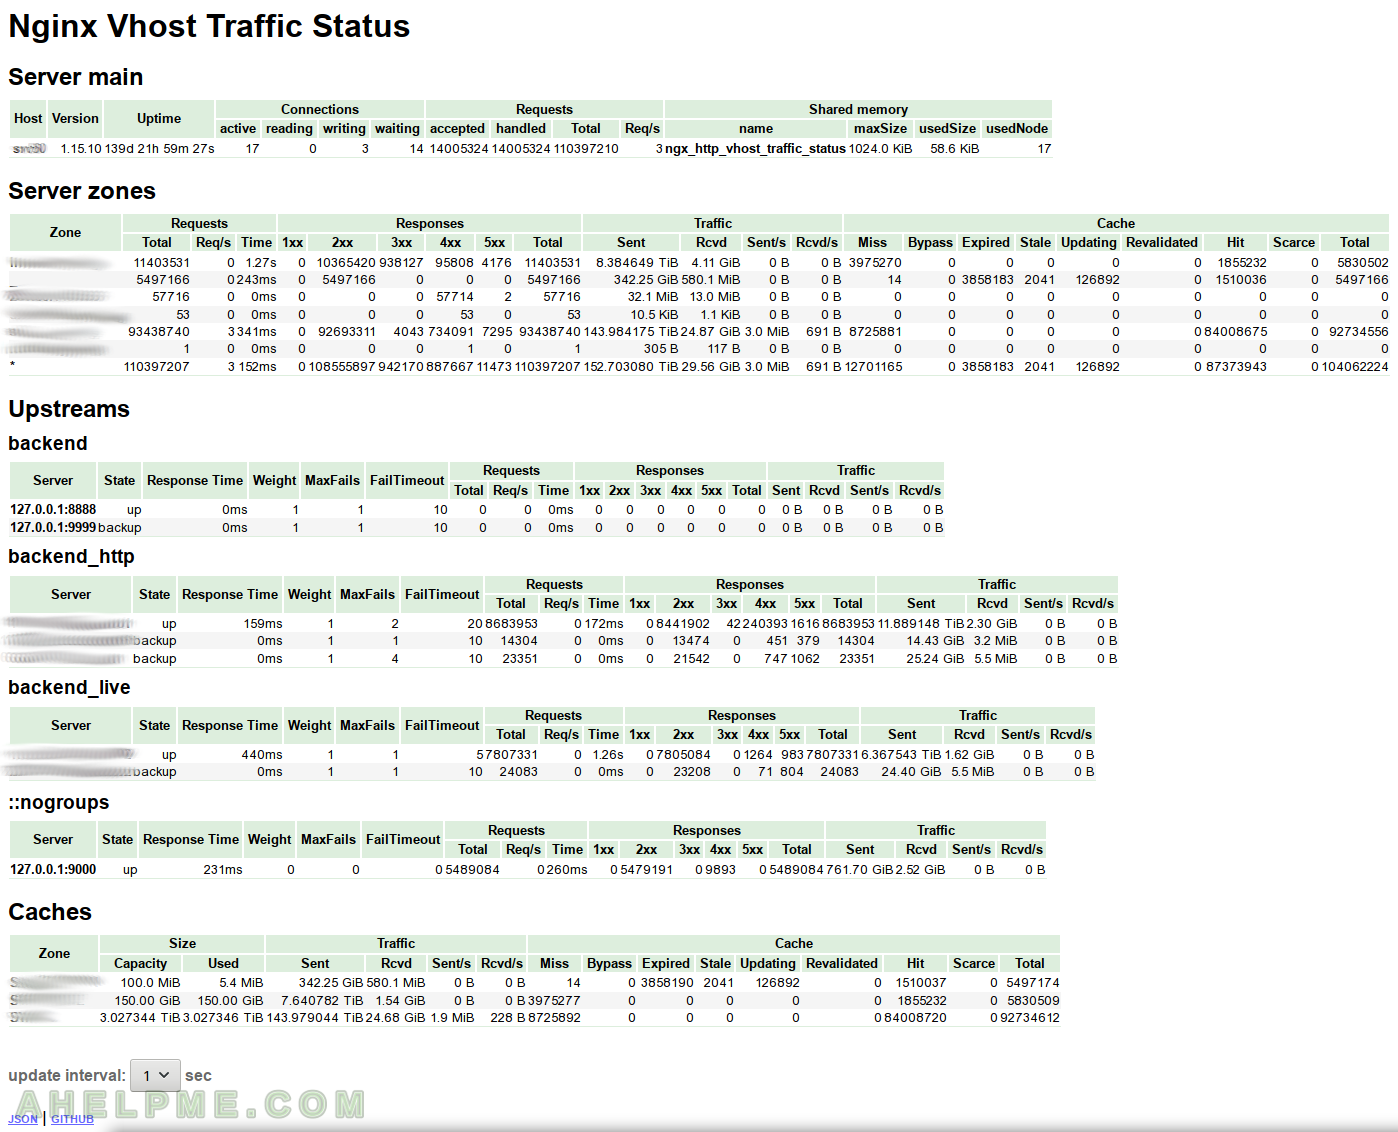
SCREENSHOT 3) The whole Nginx Vhost Traffic Status page with proxy cache infromation
This is the whole page of the module “Nginx Vhost Traffic Status” and it includes all server zones (aka virtual hosts), upstream groups with statistics per server and live information for the proxy cache per cache zones.

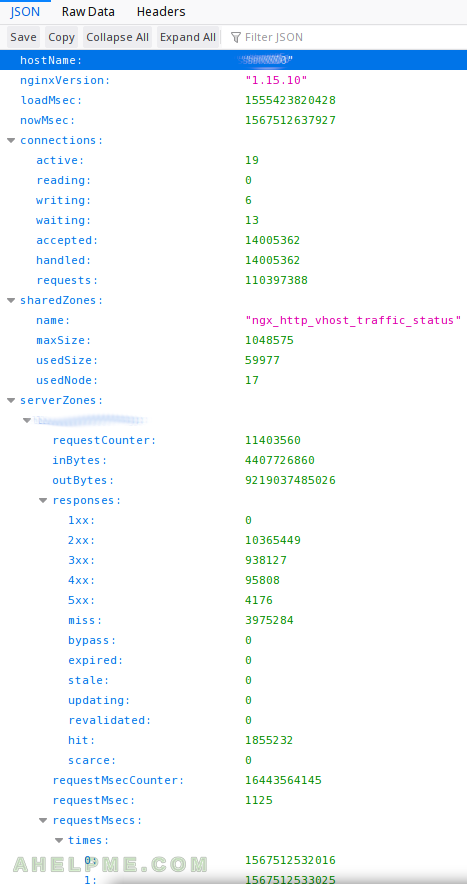
SCREENSHOT 4) This is the same page as above but with parsed JSON data by the browser.
JSON could be used to save the data in a database and then create graphs.

One thought on “Live status information like used space and more for nginx proxy cache”